Thematic modeling of news using factor analysis

Hello colleagues! How to highlight the main topics from 20,000 news in 30 seconds? A review of the thematic modeling that we do at TASS, with mates and code.
To begin with, the information presented in this note is part of a prototype that is being developed at the ITAR-TASS Digital Laboratory in order to maintain the digitalization of the business. The solutions are constantly improving, I will describe the current section, it, obviously, will not be the crown of creation, but rather a support for further developments.
Big idea
In addition to the news agenda, on which TASS editorial offices work daily, it’s good to understand what topics most create the news background in Russian online media. To this end, we collect the latest news from the 300 most popular sites every few minutes, 24/7; then the most interesting comes - the choice of modeling methods and experiments.
When the magic session ends, my colleagues, editors and managers will start using the report with news topics. I believe that for people outside the area of software development and data science, the automatic processing, analysis and visualization of text data looks a little magical. Due to the alienation of a person from high technology, various imperfections in their work can lead to a lack of understanding of what is inside and disappointment. To minimize the negative reaction, I try to make the product simpler and more reliable. And understanding the essence of thematic modeling can be reduced to the fact that news related to one topic and different from news in any other topic belongs to one topic.
I have been experimenting with thematic modeling for about a year now. Unfortunately, most of the approaches that I tried gave me a very dubious quality of filling news topics. At the same time, I performed actions according to the logic of selecting parameters in methods from popular clustering libraries. But I do not have a labeled dataset. Therefore, every time I look at a selection of texts that fall into a particular topic. The case is rather dreary and not grateful.
A particular piquancy of this task is that several specialists, having looked at the news included in the selected topic, will find them to one degree or another inappropriate. For example, the news with Erdogan’s statement about the start of the operation in Syria and the news with the first reports after the start of the operation in Syria can be understood as either one or several topics. Accordingly, the media, quoting TASS or another news agency, will write a number of texts about and about this and that. And the result of my algorithm will tend to combine or separate them based on ... the cosine of the angle between the word frequency vectors, the number of a priori accepted, or the radius in the method of finding the nearest neighbors.
In general, this whole big idea is as fragile as it is beautiful.
Why factor analysis?
A closer look at the methods of clustering texts shows that each of them is based on a number of assumptions. If the assumptions do not correspond to the problem being studied, then the result can also lead to the side. The assumptions of factor analysis seem to me - and to many other researchers - close to the task of modeling topics.
Created at the beginning of the 20th century, this approach was based on the idea that, in addition to the variables characterizing the observations of the sample, there are hidden factors that, speaking a little informally, correlate with some observed variables. For example, the answers to the question “Do you believe in God” and “Do you go to church” will be more likely to coincide than different. It can be assumed that there is a “factor of religiosity,” which manifests itself in a set of interrelated variables. At the same time, there is also the opportunity to measure how strongly the variables are associated with their hidden factor.
For texts, the statement of the problem becomes the following. In the news that describes the same topic, the same words will occur. For example, the words “Syria”, “Erdogan”, “Operation”, “USA”, “Condemnation” will be found together more often in the news that deals with the topic of Turkey’s deployment of military intervention in Syria, and the accompanying reaction to this matter from the United States ( as a geopolitical player in the same territory).
It remains to fish out all the important factors of the news agenda for a period. These will be news topics. But that's not all…
A bit of math
For people sophisticated in topic modeling techniques, I can make such a statement. The version of factor analysis that I tried is a highly simplified version of the ARTM methodology .
But I decided to experiment with methods where there are fewer degrees of freedom, that it is better to learn what is happening inside.
(Big) ARTM grew out of pLSA, probabilistic latent semantic analysis, which, in turn, was an alternative to LSA based on a singular matrix decomposition - SVD.
Intelligence factor analysis goes beyond SVD in that it provides a “simple structure” of the relationship between variables and factors, which may not be a simple matter for SVD, but is limited in that it is not designed to accurately calculate factor values (scores), then there are vectors of factor values that can replace 2 or more observable variables.
Formally, the task of intelligence factor analysis is as follows:
Where are the observed variables
linearly related to hidden factors
Need to find
All! These beta factors are called loadings in the world of factor analysis. Consider their importance a little later.
In order to arrive at the result of the analysis, one can move in various ways. One of them that I used is to find the main components in the classical sense, which then rotate to highlight the “simple structure”. The main components extend just from the singular decomposition of the matrix, or through the decomposition of the variational-covariance matrix into eigenvectors and values. The problem is also solved by maximizing the likelihood function. In general, factor analysis is a large “zoo” of methods, at least 10 that give different results, and it is recommended to choose the method that best suits the task.
The rotation of the load matrix can also be done in different ways, I tried varimax - orthogonal rotation.
Why is everything so complicated?
The fact is that among statisticians and applicants the discussion does not stop about the differences and similarities of the method of principal components, factor analysis and their combination. The methodology is replenished with new knowledge even after more than 100 years from the moment of discovery. One respected statistician brought me the following picture to facilitate understanding with the words: “That's it, sort it out.”
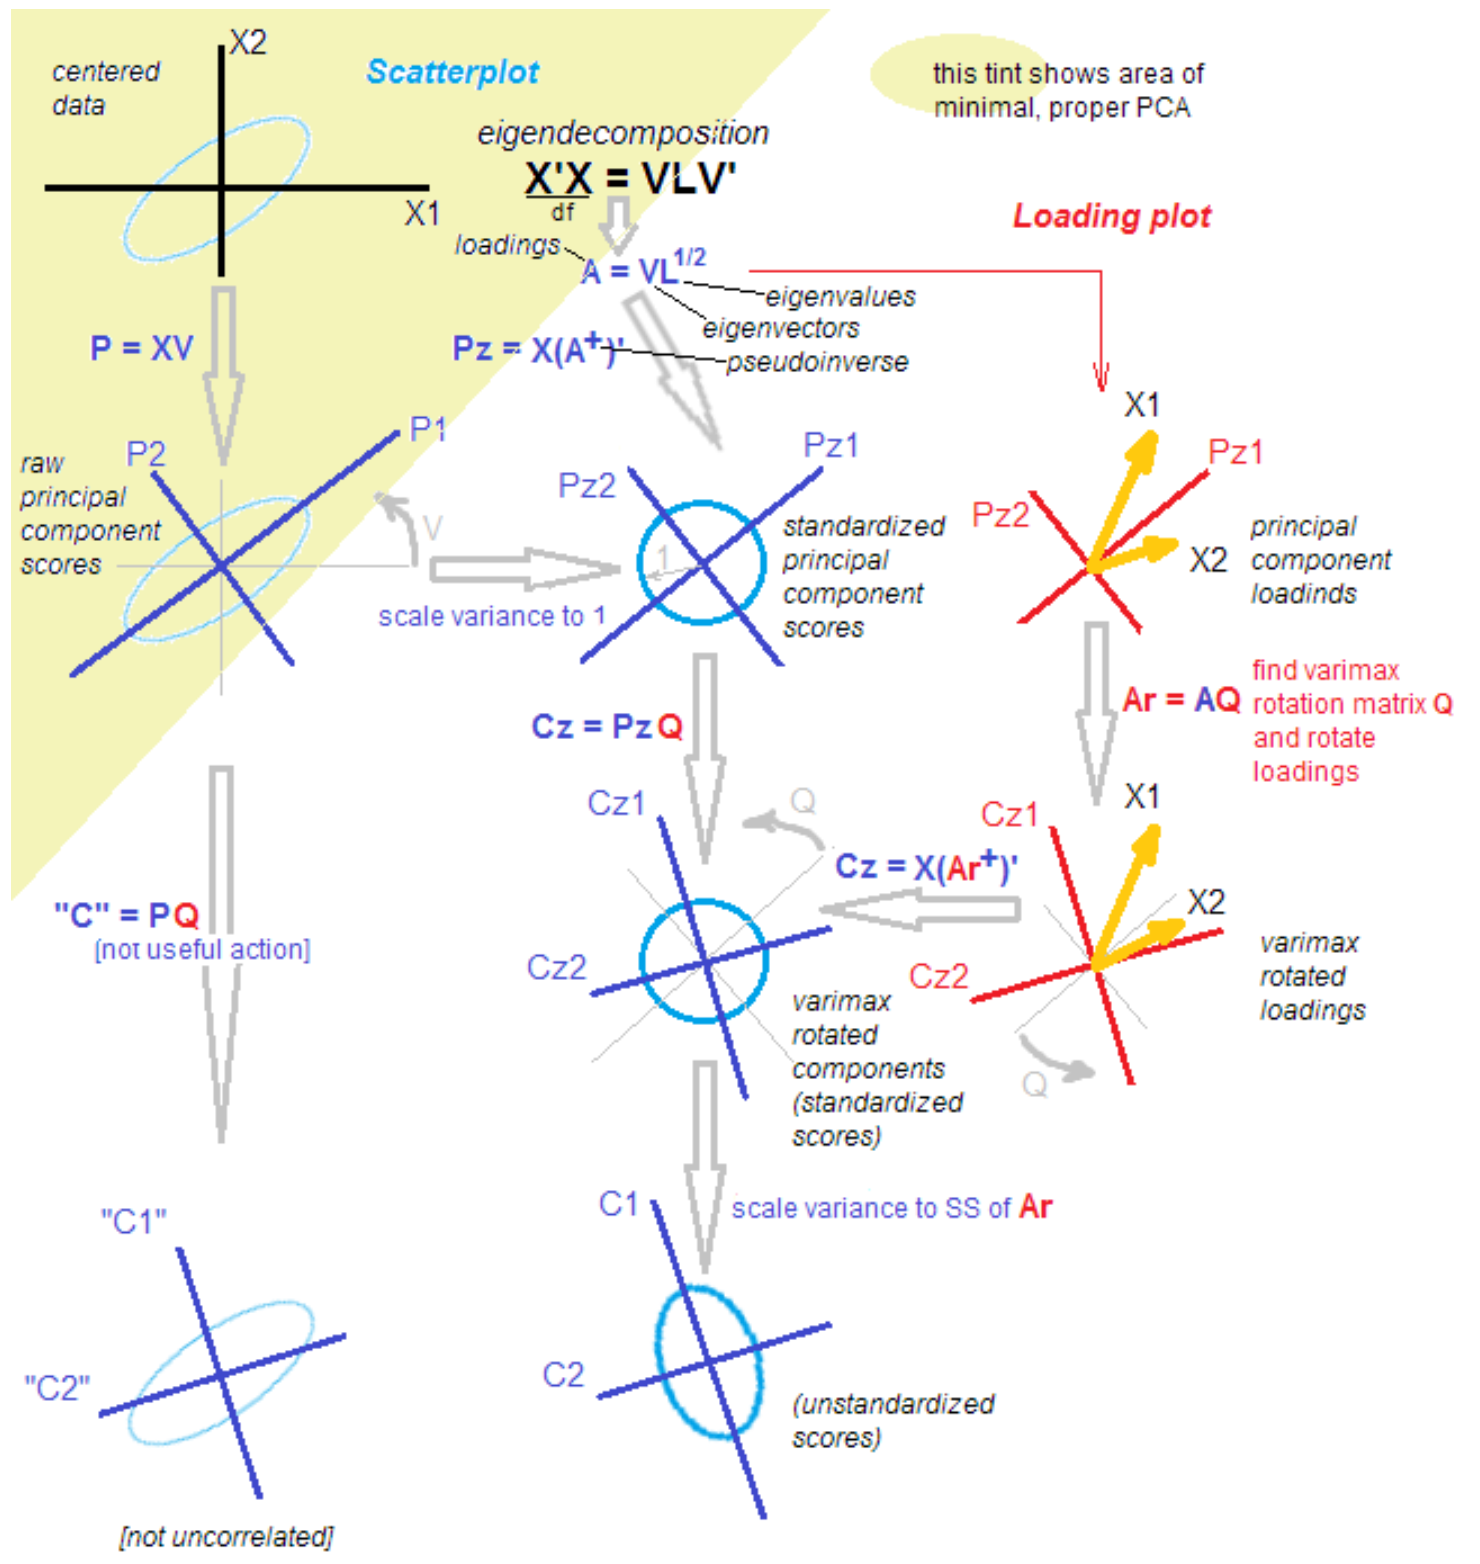
source .
All sort it out!
Just kidding). To understand the next steps, it is enough that after isolating the main components, we rotate them, going from explaining variance within variables to explaining covariance of variables and factors.
Further, I do all this using atomic functions, and not just pressing one “big red button”. This approach allows us to understand the transformation in the data at intermediate stages.
Where did the LDA go?
Update
I decided to add my thoughts on latent Dirichlet arrangements. I tried this popular method, but could not get a clean result in a short time. Simple examples of how to use it, but for “Let us divide the news into politics, economy and culture” really work, but ... In my case, I have to divide, say, politics into 50 daytime topics, where Russia, Putin and Iran will be , and such narrow topics as "the liberation of Kokorin and Mamaev." All this, in fact, 1-2 news agency news, quoted several dozen times in the media.
Moreover, the assumption about the nature of the data inherent in the hypothesis that each text is a probability distribution by topic seems to me a little artificial in the context of my work. No editor agrees that the news of the “dismissal of the case against Golunov” is a mix of themes. For us, this is 1 topic. Perhaps, choosing hyperparameters it is possible to achieve such fragmentation from the LDA, I will leave this question for the future.
The code
I dabble in the R language again, so this little experiment will be Aryan.
We work with 3 pairs of correlated random values. This set contains 3 hidden factors - just for clarity.
set.seed(1) x1 = rnorm(1000) x2 = x1 + rnorm(1000, 0, 0.2) x3 = rnorm(1000) x4 = x3 + rnorm(1000, 0, 0.2) x5 = rnorm(1000) x6 = x5 + rnorm(1000, 0, 0.2) dt <- data.frame(cbind(x1,x2,x3,x4,x5,x6)) M <- as.matrix(dt) sing <- svd(M, nv = 3) loadings <- sing$v rot <- varimax(loadings, normalize = TRUE, eps = 1e-5) r <- rot$loadings loading_1 <- r[,1] loading_2 <- r[,2] loading_3 <- r[,3] plot(loading_1, type = 'l', ylim = c(-1,1), ylab = 'loadings', xlab = 'variables'); lines(loading_2, col = 'red'); lines(loading_3, col = 'blue'); axis(1, at = 1:6, labels = rep('', 6)); axis(1, at = 1:6, labels = paste0('x', 1:6))
We get the following load matrix:
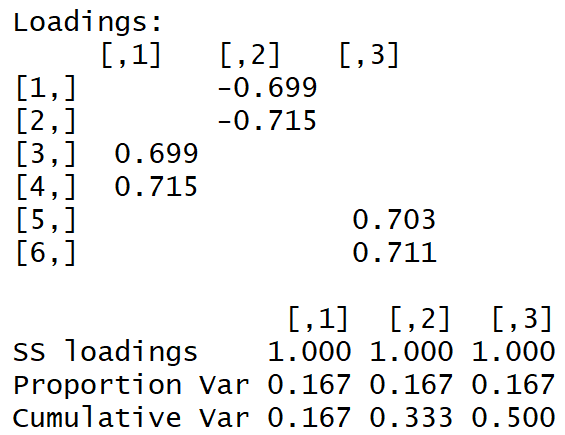
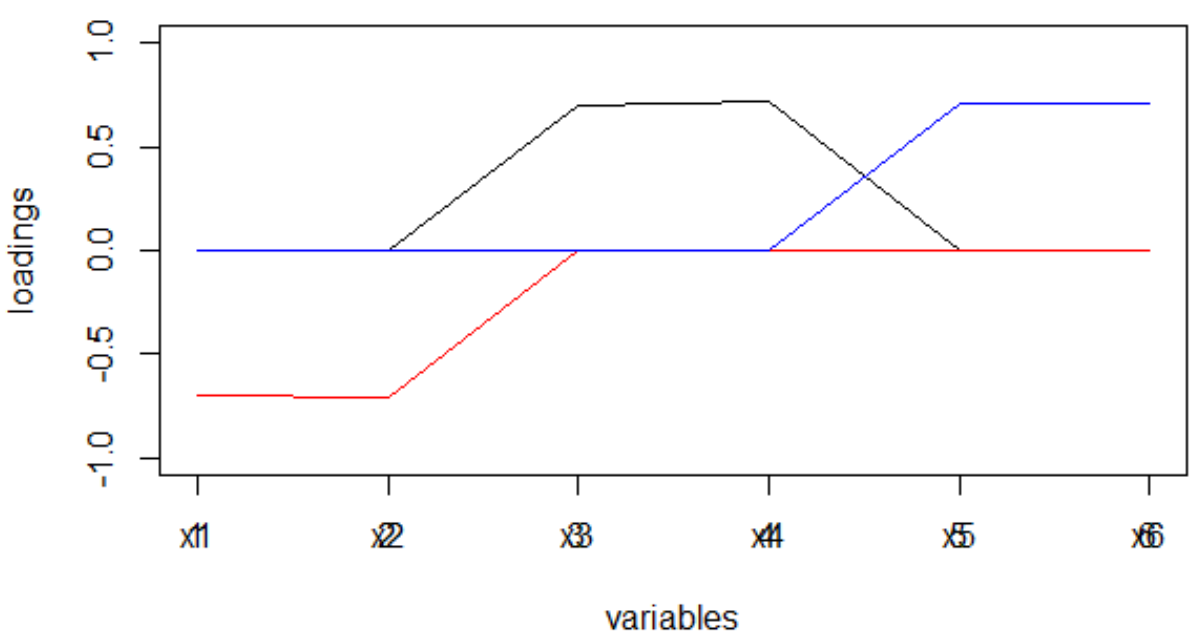
The "simple structure" is visible with the naked eye.
And here is how the loads looked right after the completion of the MGK:
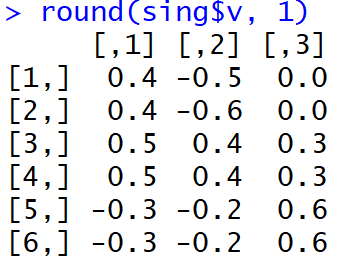
It is not very easy for people to understand what factors are associated with which variables. Moreover, such weights, taken modulo, and in the interpretation of the machine will lead to a very strange distribution of words on topics.
But, bo!, The share of the explained dispersion in the first three main components (before rotation) reached 99%.

What about the news?
For news, our variables x1, x2 ... xm become the frequency (or tf-idf) of the token occurrence in the text. There are many words! For example, 50,000 unique words per week is normal. The bi-gram will be even bigger, understandably. The complexity of the singular decomposition is the average:
That is, it is huge. The decomposition of a matrix of 20,000 * 50,000 values in one stream takes several hours ...
To be able to read topics in real time and display Shiny on the dashboard, I came to the following painful cutoffs:
- top-10% of the most common words
- random sampling of texts using a self-fulfilling formula:
where n is all texts.
As a result, I process weekly data in 30 seconds, one day in 5 seconds. Not bad! But, you must understand that news trends are captured only by the most well-fed.
Having received loads, which, I note, are estimates of the covariance of the observed variables with the factors, I release them from the sign (through the module, not through the degree), which tends to change depending on the rotation method used.
Recall how the load matrix differed after conducting the MHC and after rotation with varimax. The sparseness of the loads, as well as the fact that their dispersion for each factor was maximized: there are very large and very small ones, will lead to the fact that the words will be distributed among the factor quite cleanly, which, in turn, will lead to further and the distribution of factors on the news text will have a pronounced peak.
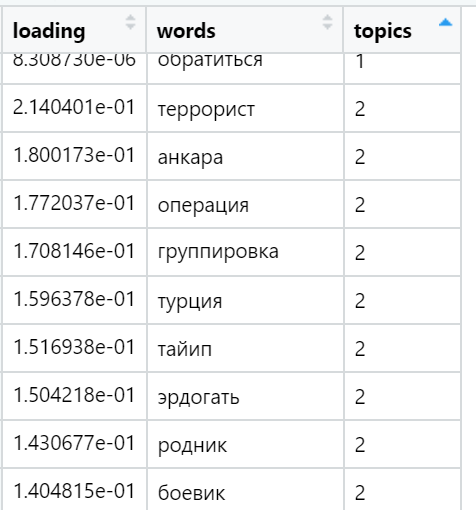
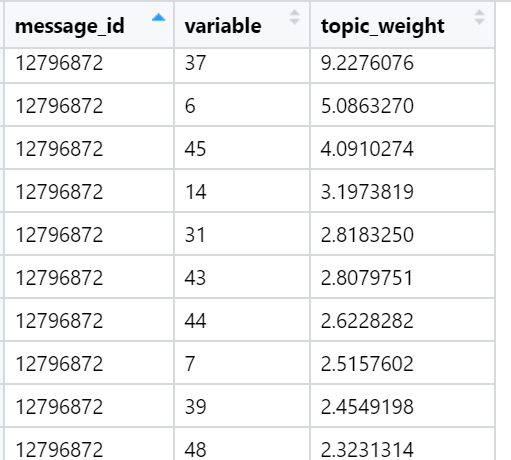
Examples of the most loaded words in various topics found (randomly selected):
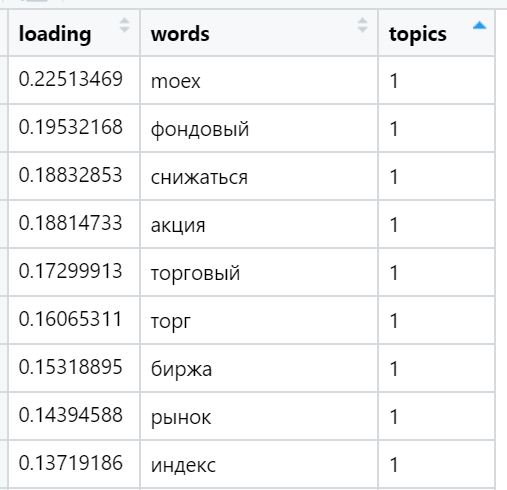

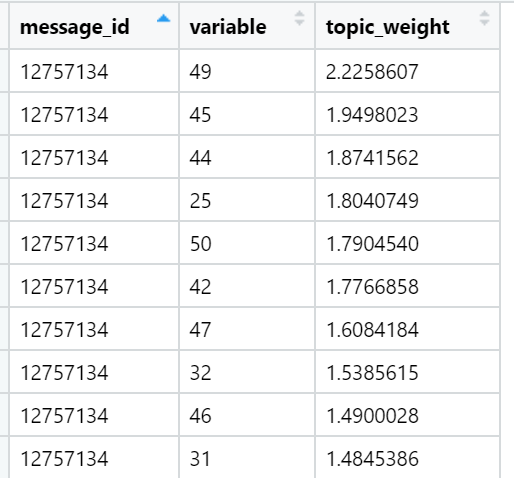
And finally, I consider the sum of the loads in the texts in relation to each factor. The strongest wins: for each text, a factor is selected whose sum of loads is maximized - taking into account the number of words included in the document, which - as we have provided during rotation - have a very uneven distribution between the load factors. In this iteration, all the texts (n) are already involved, that is, the full sample.
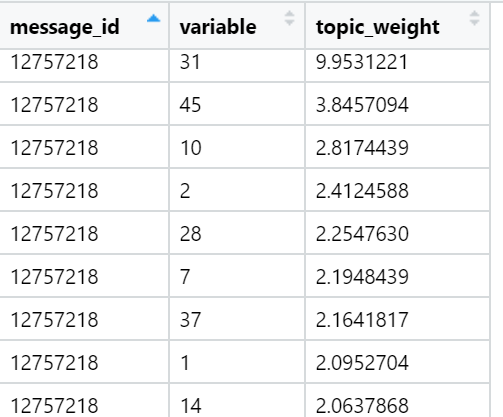
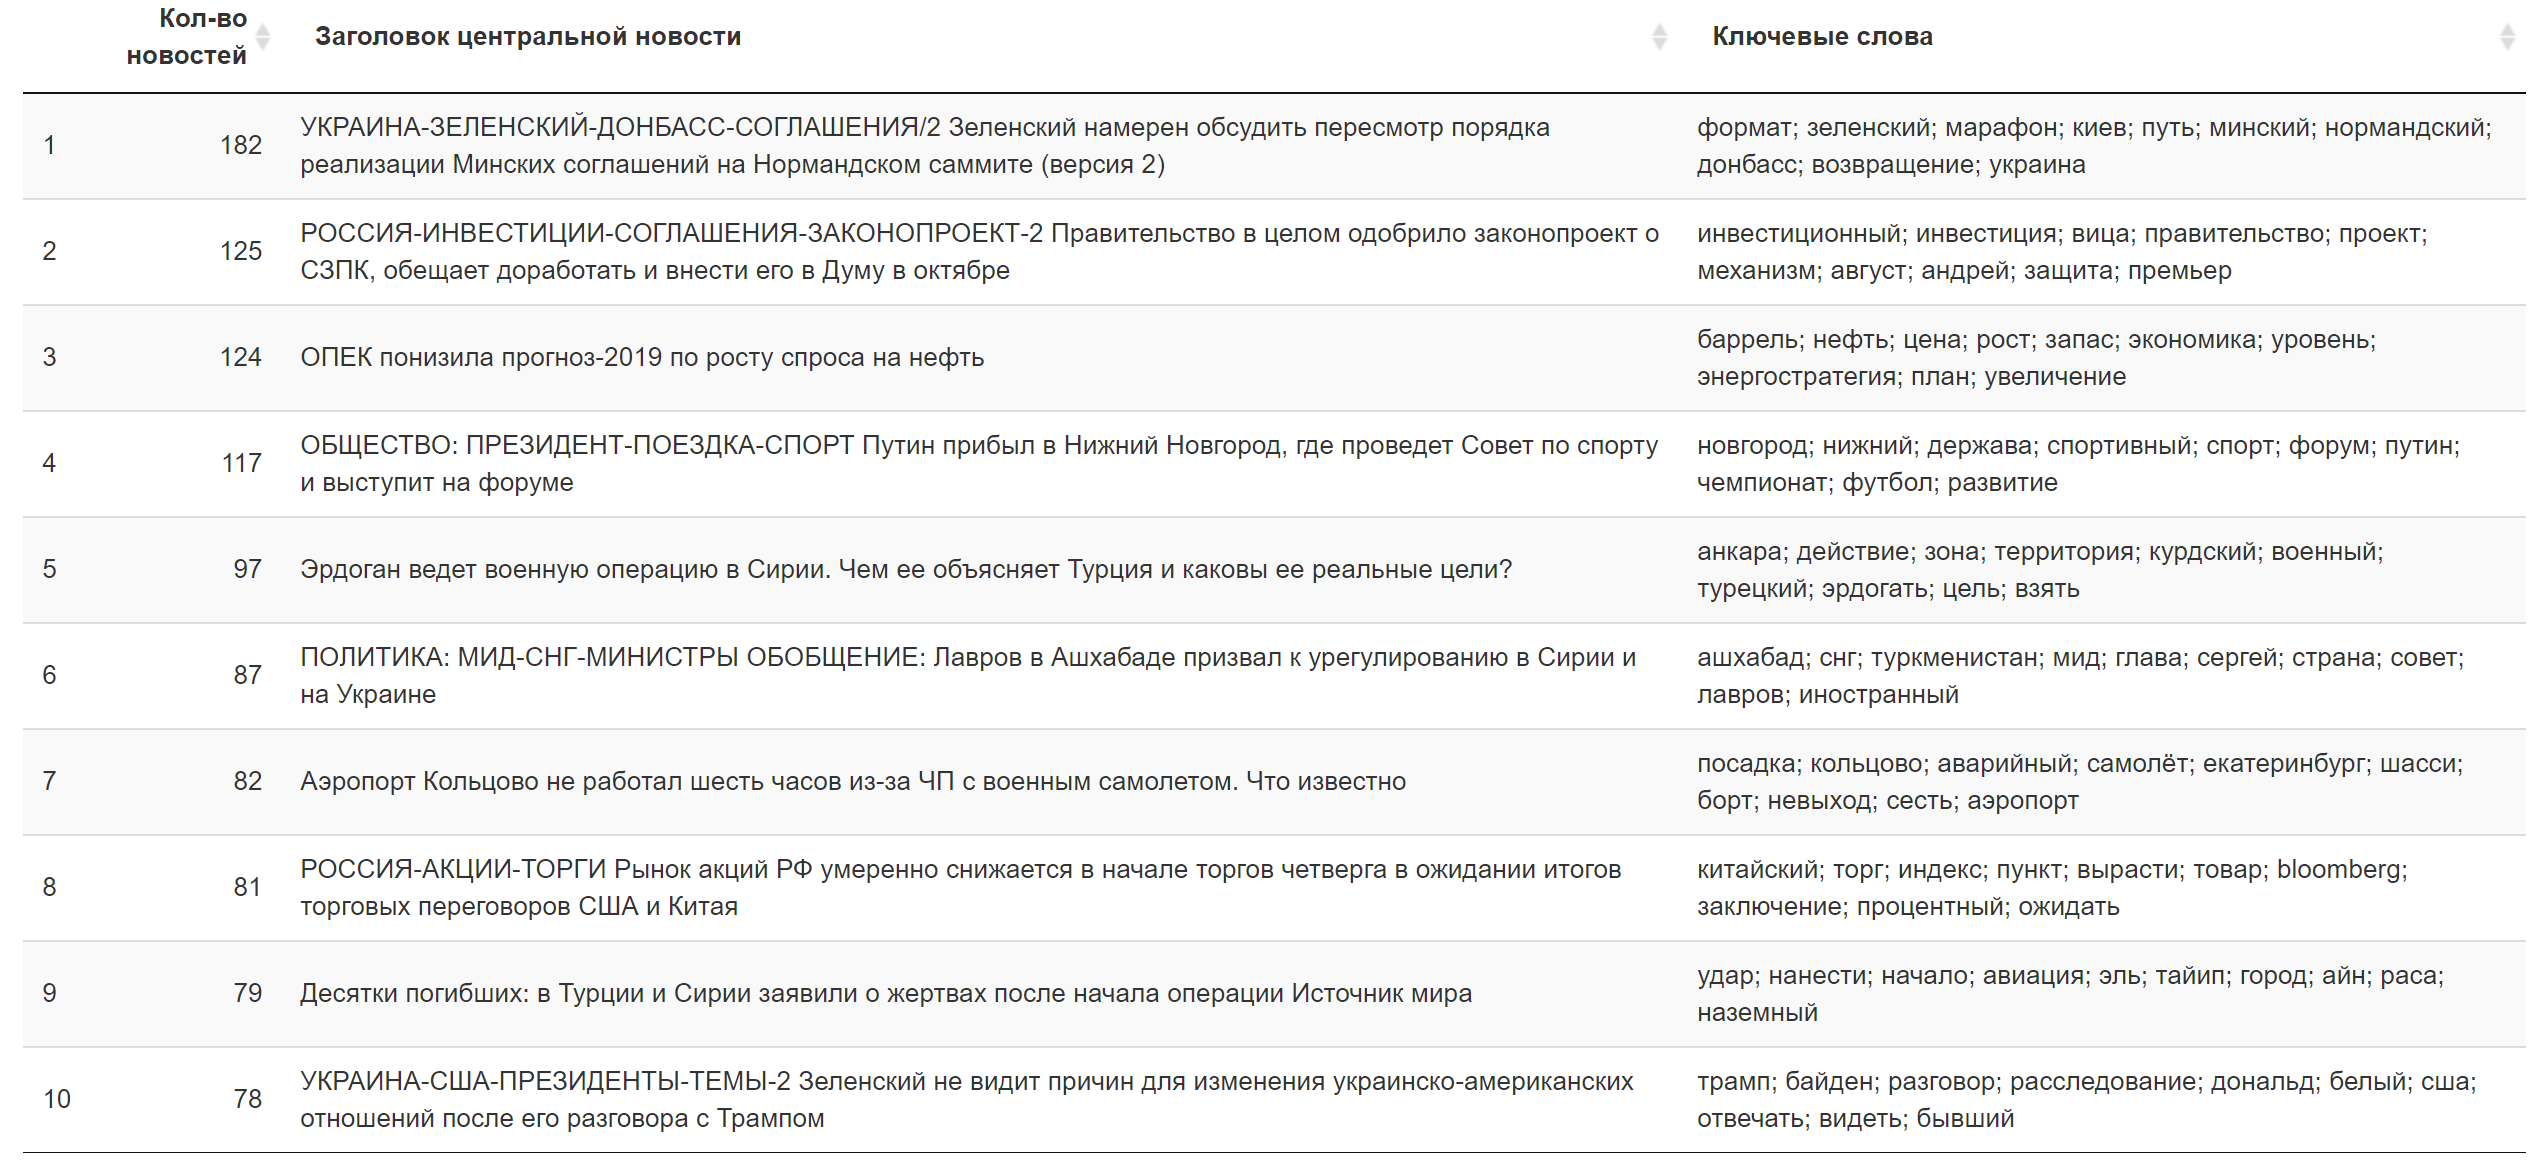
Examples of topics that are top in the sum of loads in specific news texts (randomly selected):
The result for today.

Additional Information.
What to do?
Now, the first thing I will do when ... In general, when inspiration comes, I’ll try to configure the job for hourly training of a neural network with a narrow neck, which will give me just a non-linear approximation of factors - distorted main components - in the form of hidden layer neurons. In theory, learning can be done quickly using the increased learning speed. After that, the hidden layer weights (somehow normalized) will play the role of token loads. They can already be quickly loaded into the final processing environment at an acceptable speed. Perhaps this trick can lead to the fact that the week will be processed in all texts in 10 seconds: the normal time for such a difficult case.
All in all, that’s all I wanted to cover. I hope this short excursion into the topic modeling method allows you to better understand what is being done under the “big red button”, reduce alienation from technology and bring satisfaction. If you already knew this, I will be glad to hear the opinions of a technical or product sense. Our experiment is evolving and changing all the time!
All Articles