Speed of loading sites in e-commerce: analysis of 48 top online stores in Russia

Website loading speed is a sore subject for e-commerce. And if with desktop versions everything is more or less normal, then with mobile the trouble.
We analyzed the largest online stores in Russia using the Google PageSpeed Insights service for 39 variables - by industry and device. How many stores go into the green zone, how long content rendering and full page loading take, what works to speed up sites are the most popular - and read about this in the review.
What is important to know about PageSpeed Insights (PSI)
Performance rating
Observation data: FCP and FID
First Content Rendering (FCP)
First Input Delay (FID)
Simulate page load
First Content Download Time (FCP)
Enough Content Download Time (FMP)
Download speed index
CPU End Time
Interaction Download Time (TTI)
Audit Results
To summarize: is it worth fighting for high speeds?
Why all this and to whom it is useful?
When we analyzed the mobile usability of the TOP-20 online stores in Russia, we found that only 1 store out of 20 passes the test in the Google PageSpeed Insights service . Most do not even fall into the "orange" zone.
Download speed is important for two reasons:
- slow sites lose customers - the longer the site loads, the higher the desire to go back to the search;
- fast sites are more likely to take higher positions in the organic sector (remember the transition to Mobile-First indexing ).
We decided to delve into the topic of site loading speed and look at the real situation in e-commerce. We selected 48 online stores from the DataInsight rating - 8 each from different areas:
- auto products;
- health and beauty;
- clothes, shoes and accessories;
- household products;
- electronics and technology;
- department stores.
Each store was analyzed using PageSpeed Insights and compiled a pivot table .
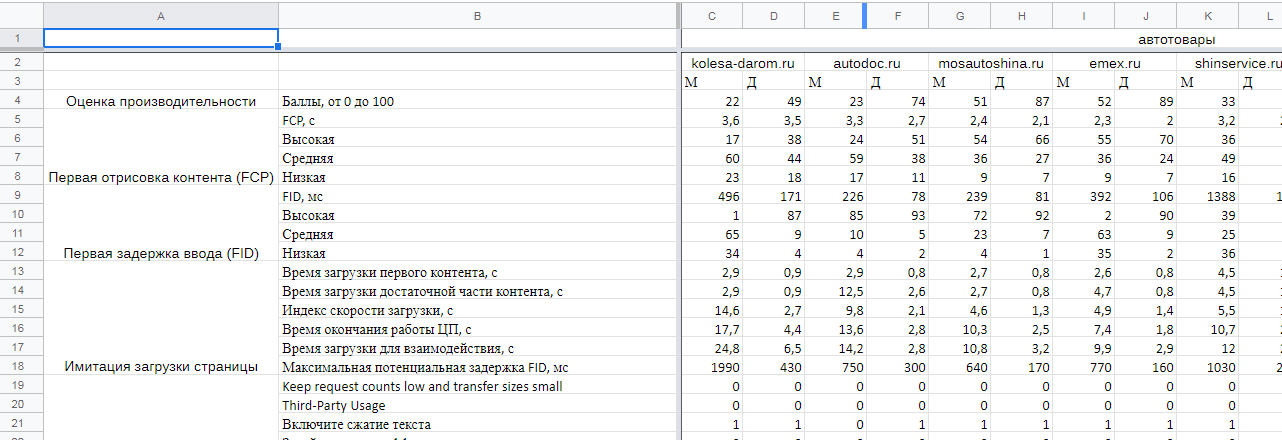
Further we will explain what metrics in PSI mean and analyze them in different segments of e-commerce. The information will be useful not only to developers and optimizers, but also to owners of online stores to understand current trends.
What is important to know about PageSpeed Insights (PSI)
PSI provides information on page loading speeds on mobile devices and PCs, as well as tips on how to make them load faster.
The PSI report is divided into blocks:
- score for page loading speed (performance rating);

- observation data - data on the page loading speed by users for the last 30 days are presented (pulled from the report on the usability of the Chrome browser);

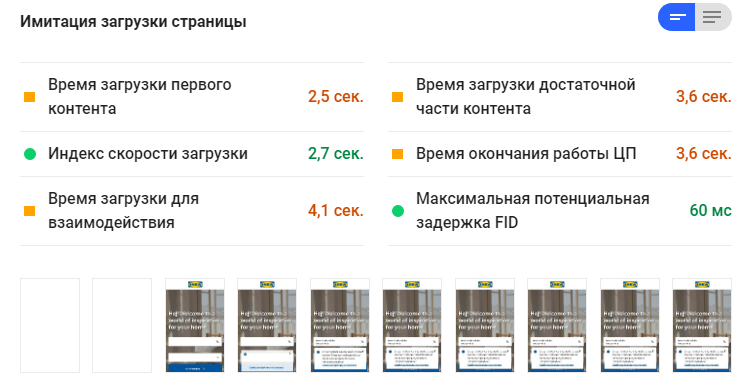
- simulation of loading - data on page loading speed ( Lighthouse technology is used to obtain them);
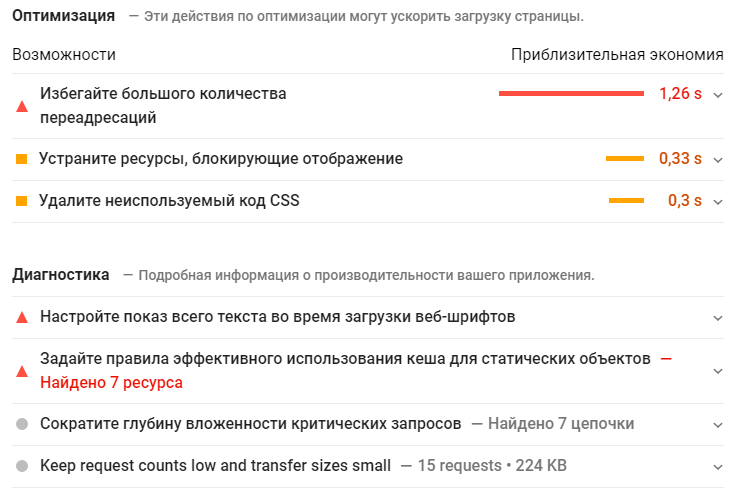
- audit results - a list of tasks that require attention to improve page loading speed.
We will analyze in more detail and analyze each group of indicators.
Performance rating
PageSpeed Insights gives the site a score based on an analysis of its loading speed using the Lighthouse tool (separately for the desktop and mobile versions). Data is updated daily and covers the last 30 days.
Grading grades are as follows:
- 90-100 points - the "green" zone. You can open champagne.
- 50-89 points - the "orange" zone. There are flaws, but you can live.
- 0-49 points - the "red" zone. Everything is bad.
In an ideal world, the site should be in the green zone. But the reality is harsh:
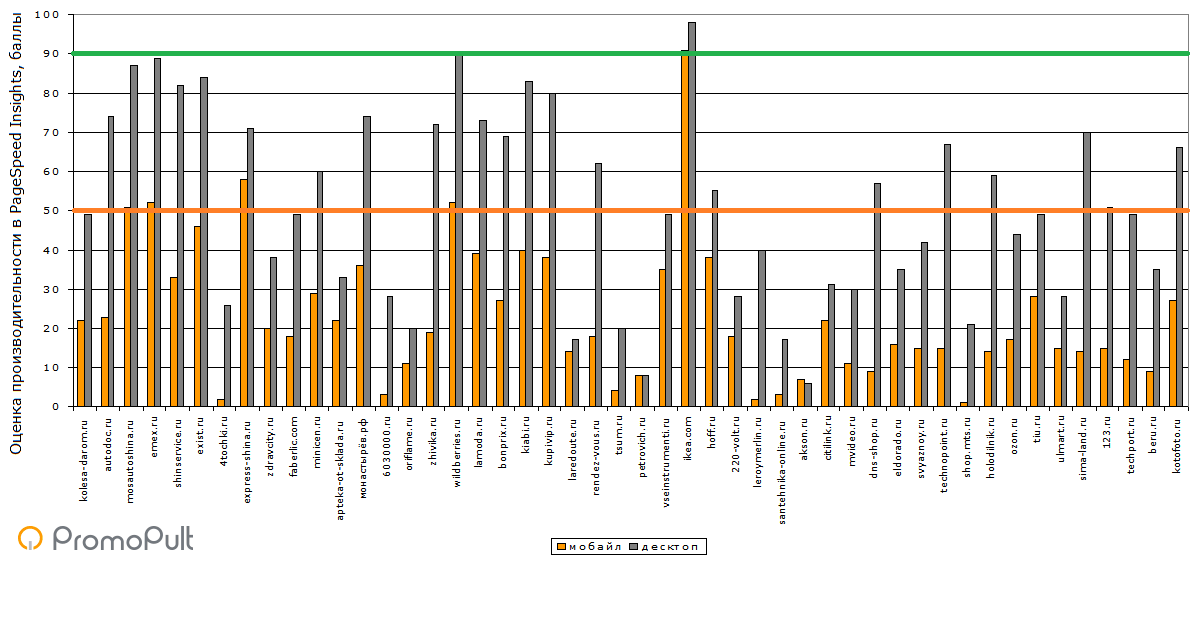
Of the 48 online stores (note from the TOP-100 rating), only one (!) Lives in the green zone when viewed from mobile. The situation is similar with desktops - only 2 sites scored 90 or more points. This is only 2% and 4% of the total number of sites analyzed.
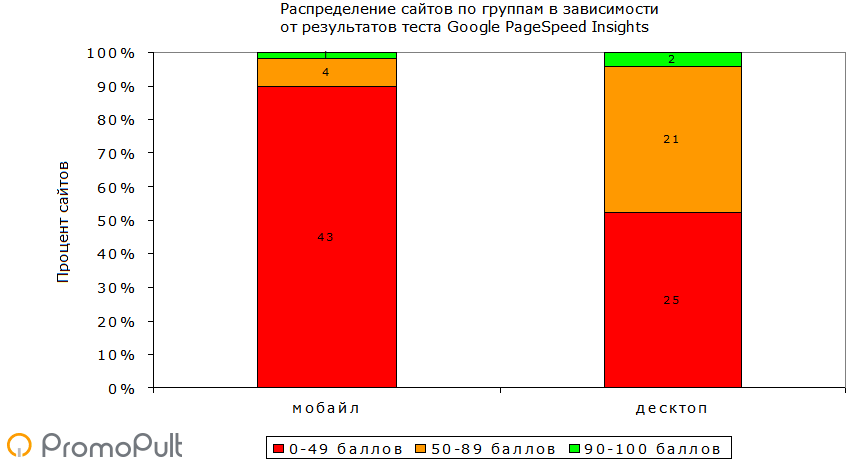
Almost 90% of sites when viewed from mobiles pass the test for download speed with an unsatisfactory result. When viewed from desktops - about 52%.
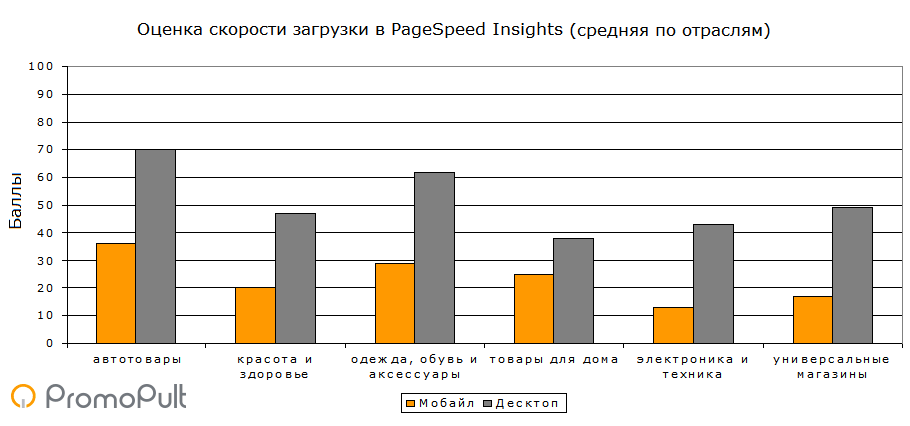
If you look at the average download speed by industry, then online stores of auto goods, as well as clothing, shoes and accessories, load more quickly. Electronics stores and department stores are lagging behind.
Observation data: FCP and FID
First Content Rendering (FCP)
First Contentful Paint (FCP) is the time from the moment you go to the site until the browser displays the first bit of content from the DOM. From the point of view of users, the first rendering signals that the site is really loading.
PageSpeed Insights takes FCP values from the Chrome browser usability report . The 90th FCP percentile is displayed.
Gradation of FCP values:
- 0-1 second - high speed of the first rendering of content;
- 1-2.5 seconds - average speed;
- more than 2.5 seconds - low speed.
Actual FCP Values:
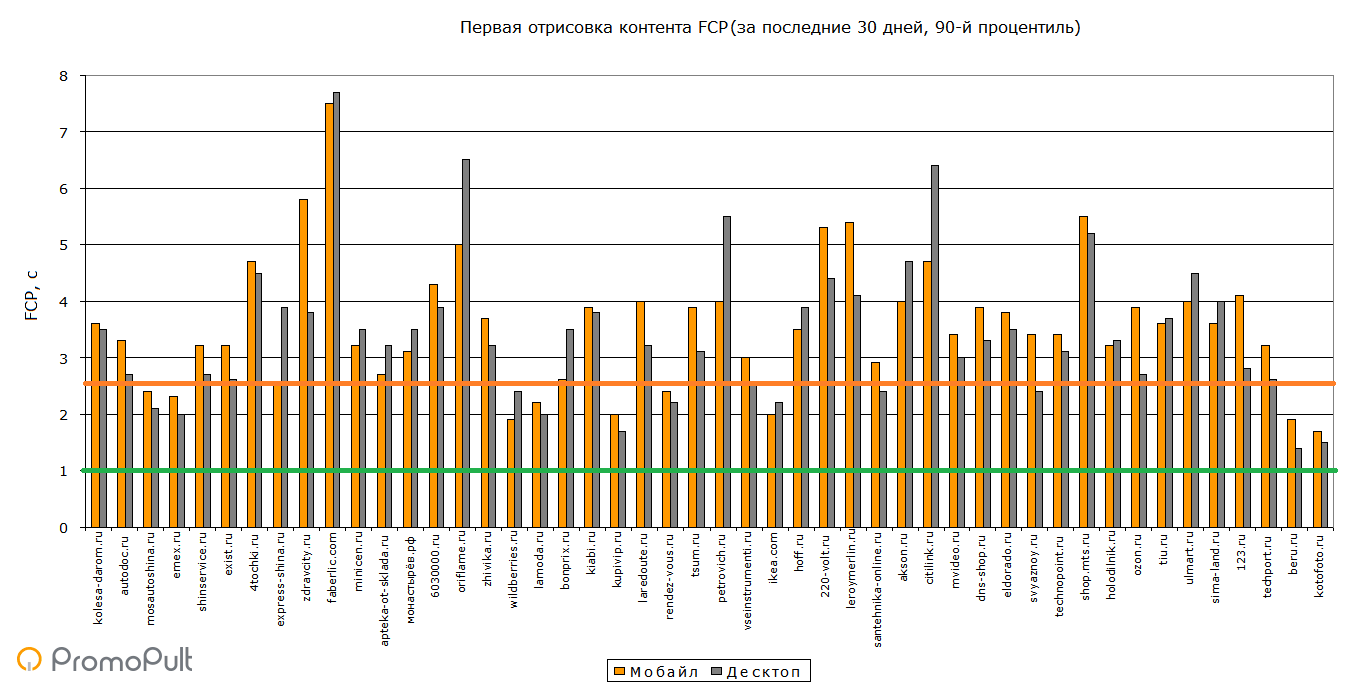
In contrast to the scoring of the site loading speed, according to the FCP indicator, there is no pronounced gap between the desktop and mobile versions in the total mass.
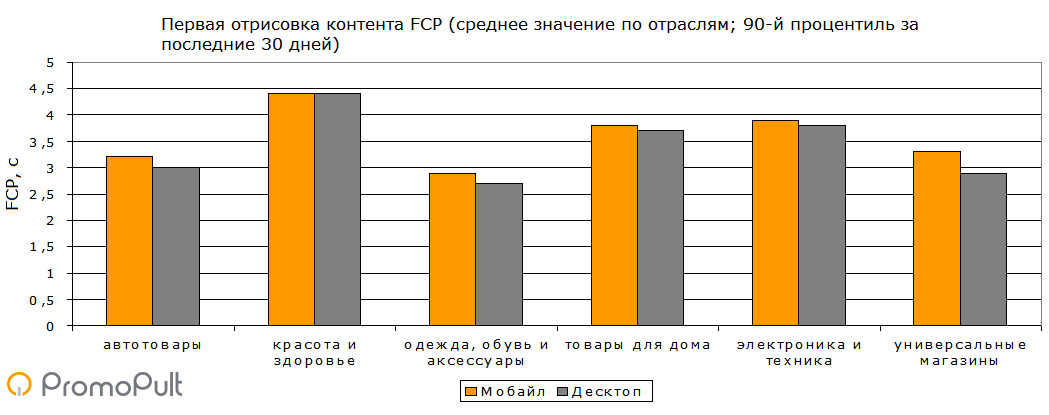
The average FCP values by industry:
In addition to the average FCP value over the last 30 days, the PSI also displays the percentage of page load distribution depending on the FCP value (“high”, “medium” and “low” download speed).
Example:

In this example, in 18% of page loads, the first rendering of content lasted no more than 1 second, in 62% - from 1 to 2.5 seconds, in 20% - more than 2.5 seconds. The average value is 3.3 seconds.
We averaged the percentage of distribution of downloads for each of the 48 analyzed sites and received the following figures:
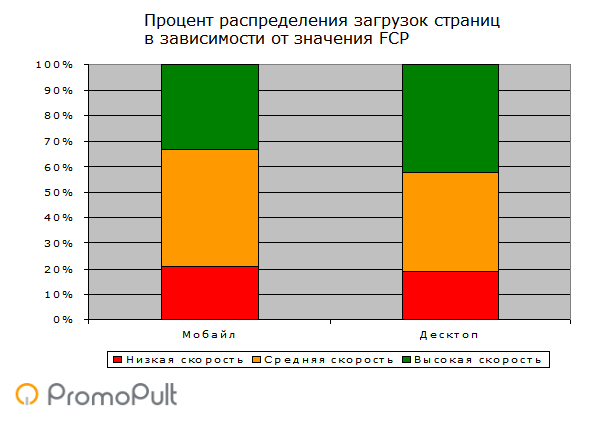
There are no significant differences between the distribution of page loading speeds in mobile and on desktops - unless the percentage of downloads with high speed on desktops is slightly higher.
First Input Delay (FID)
The first input delay (First Input Delay, FID) is the time from the start of user interaction with the site (clicking on a link, button, using a JavaScript element) until the browser responds to this interaction.
The lower the input delay, the less the user will have to wait for the reaction of the browser. But, for example, due to massive scripts, the browser can process them for a long time, which is why there is a high input delay.
The PSI indicates the 95th percentile by FID - the average value for the last 30 days.
Gradation of FID values:
- 0-50 ms - high speed;
- 50-250 ms - average speed;
- more than 250 ms - low speed.
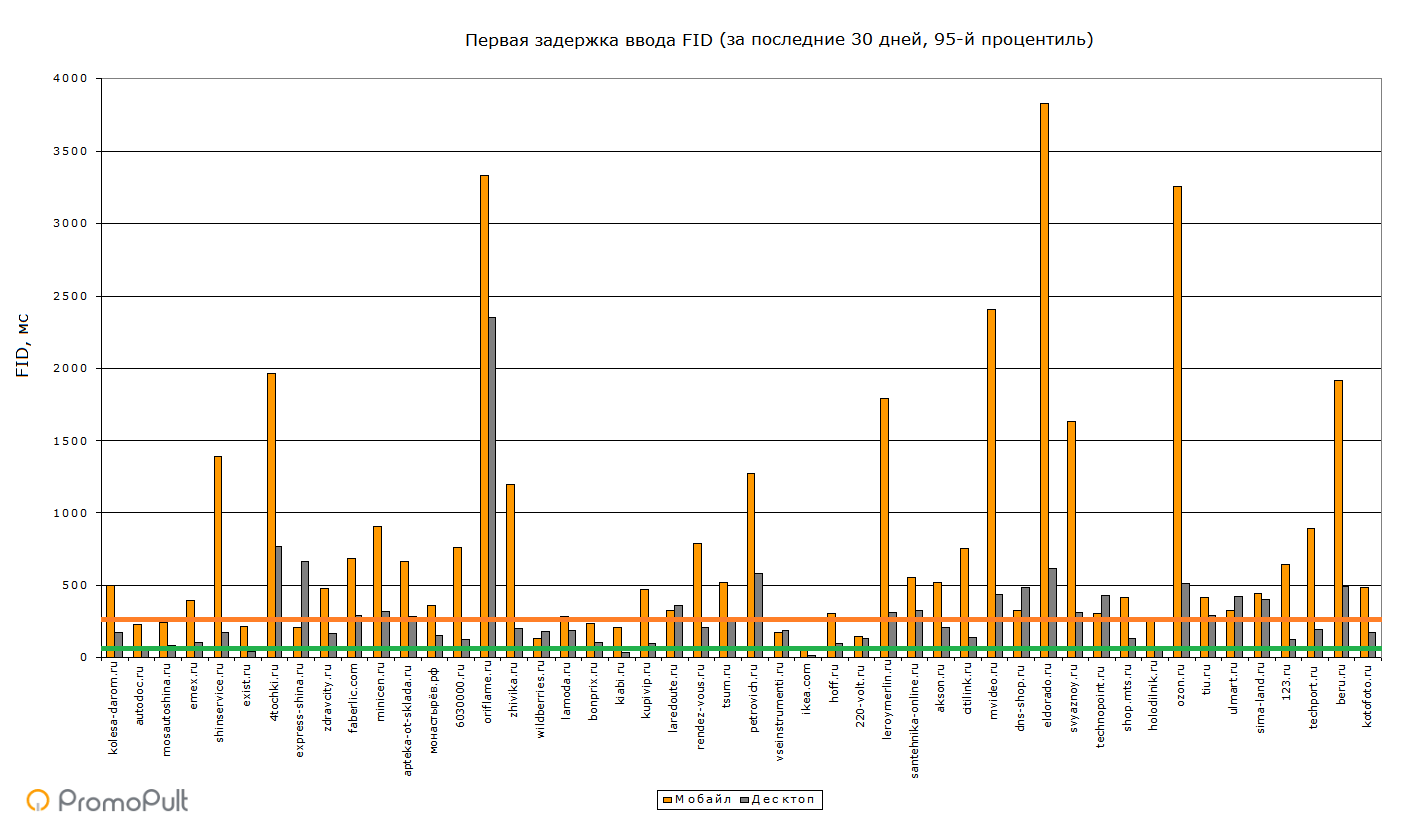
Unlike FCP, the FID values differ depending on the device from which they visited the site. When viewing from a mobile, the first input delay is significantly higher than when viewing from a PC. On 8 sites, users have to wait more than 1.5 seconds for a backlash, and on three sites - more than 3 seconds (which is 60 times higher than normal).
By industry:
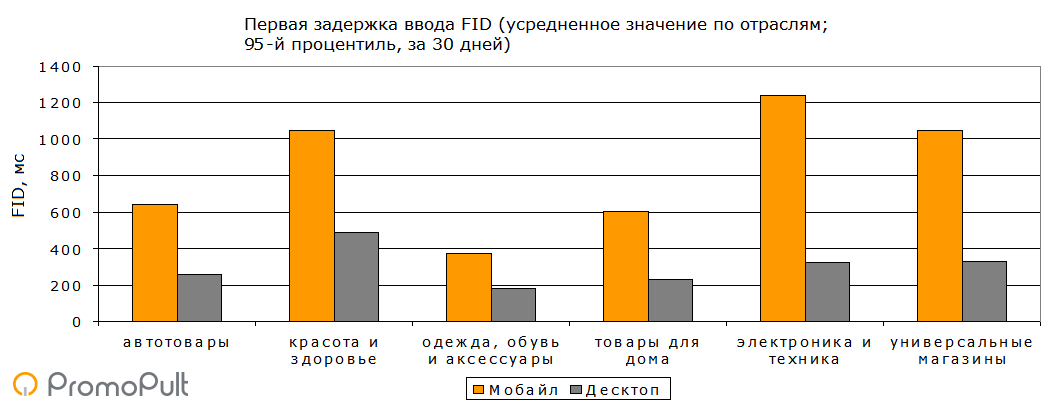
In the field of the sale of clothes, shoes and accessories, sites react most quickly to user actions - both in mobile and on desktops. Sites in the areas of beauty and health, electronics and technology, department stores respond longer.
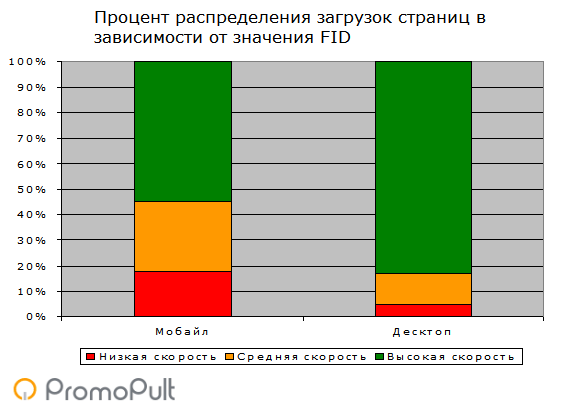
As with FCP, the PSI service displays the percentage distribution of the FID input delay. Example:

The percentage of downloads with medium and low speed in the mobile is more than 2 times higher than the same indicator when viewed from desktops. The share of high-speed downloads is 55% versus 83%, respectively.
Simulate page load
This block of the PSI report displays the results of simulating page loading using Lighthouse technology. Six indicators are presented here. It is on their basis that a point estimate of page loading speed is formed. Moreover, the indicators have different weights . By importance they are distributed as follows:
5 (most important) - load time for interaction (TTI);
4 - download speed index (Speed Index);
3 - loading time of the first content (FCP);
2 - CPU end time (First CPU Idle);
1 - loading time of a sufficient portion of the content (FMP);
0 (not taken into account) - maximum potential delay (FID).
Let's go through each indicator.
First Content Download Time (FCP)
We have analyzed this indicator above. The difference is that in the download simulation block, the data was obtained using Lighthouse, and in the observation block - from the report on the usability of the Chrome browser.
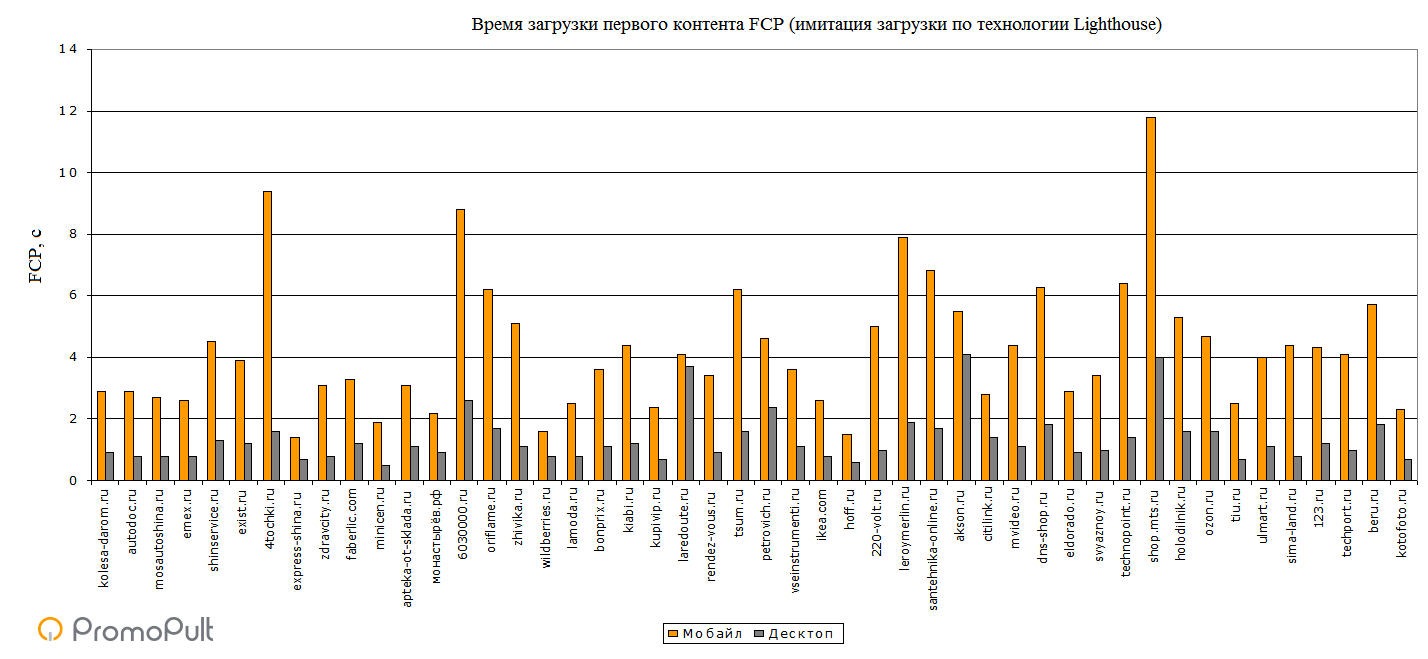
The loading time of the first content is much higher in mobile. On 9 sites out of 48 (19%), it exceeds 6 seconds. When viewed from desktops, the FCP speed is much higher - here only 5 sites (10%) have the first rendering lasting more than 2 seconds.
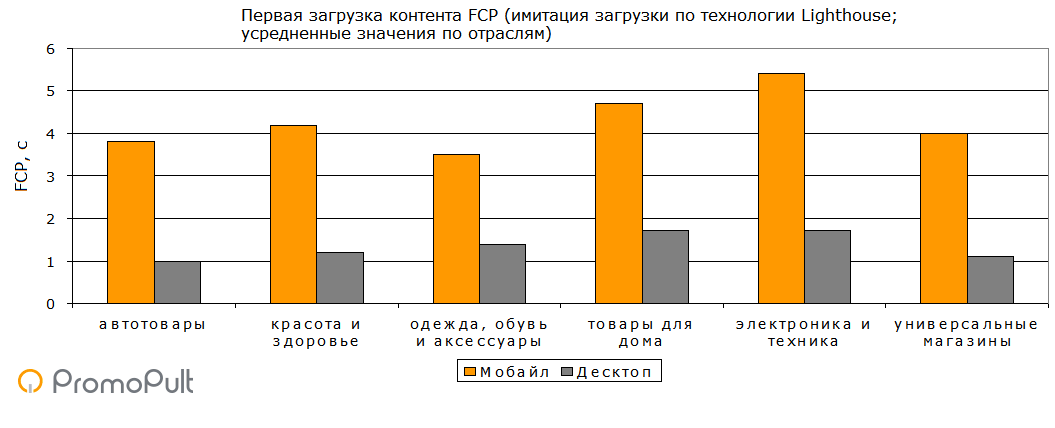
By industry:
Enough Content Download Time (FMP)
First Meaningful Paint (FMP) is the time from the start of the page loading until the moment when the user sees enough content to start working with the page.
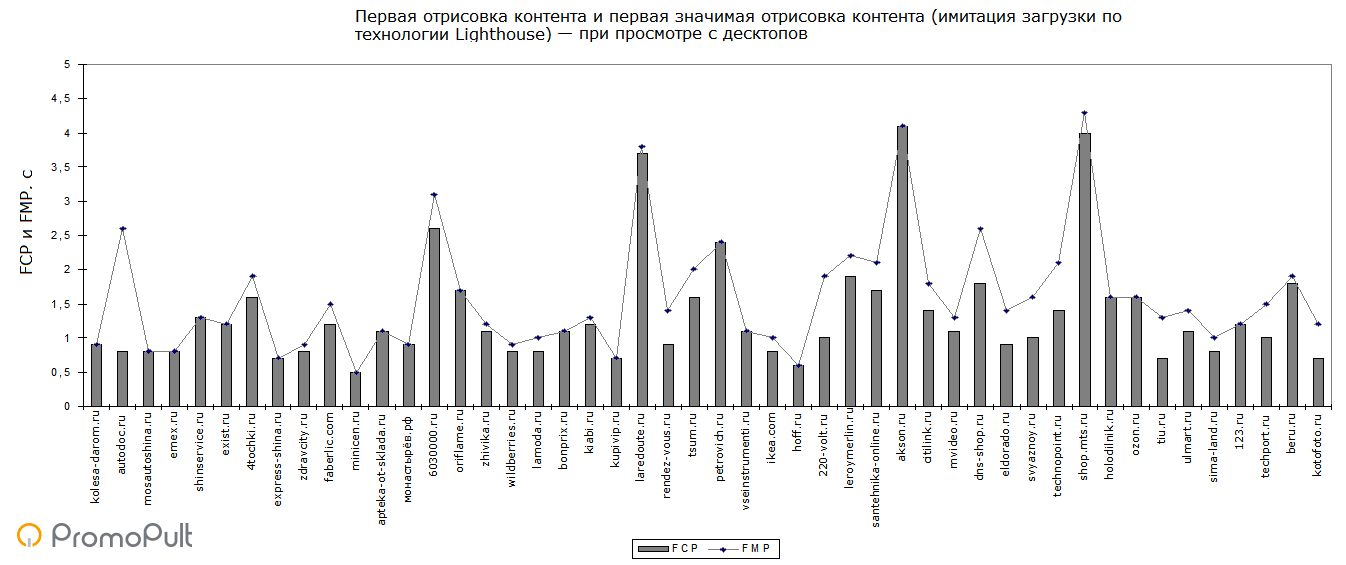
FMP values are interesting to compare with FCP. In 40% of cases, when viewed from desktops, FMP coincides with FCP - users at the first rendering immediately see a significant part of the content. In other cases, users have to additionally wait for the content to load (on average - 0.3 seconds).
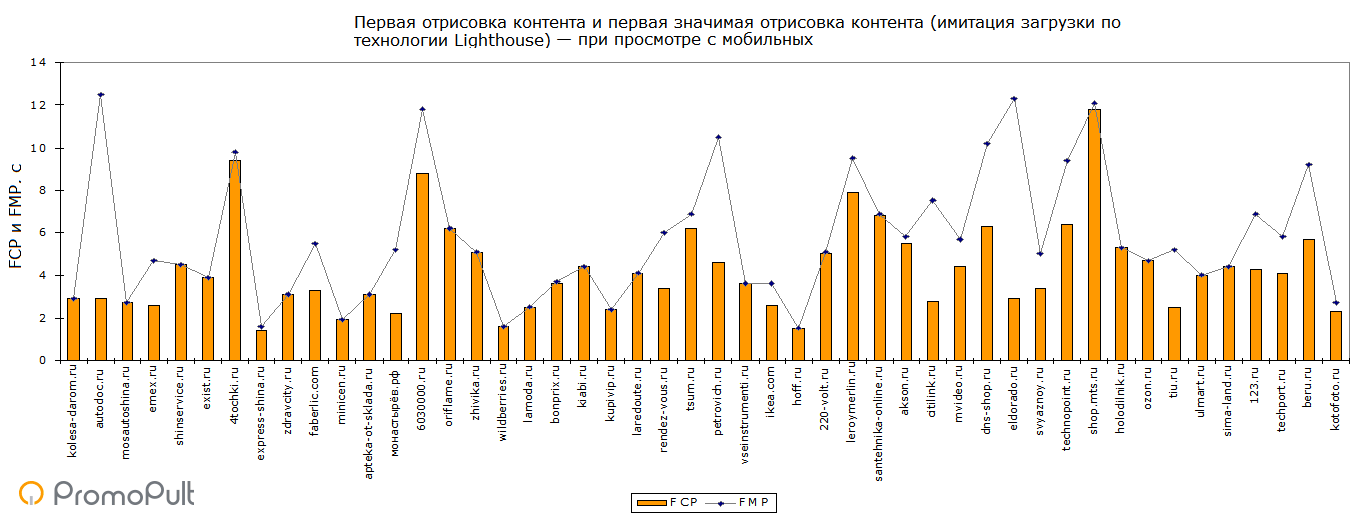
When viewed from mobile, 46% of FCP sites coincide with FMP, but the gap between these indicators is higher - an average of 1.4 seconds (which is 4.7 times higher than when viewed from desktops).
By industry (mobile):
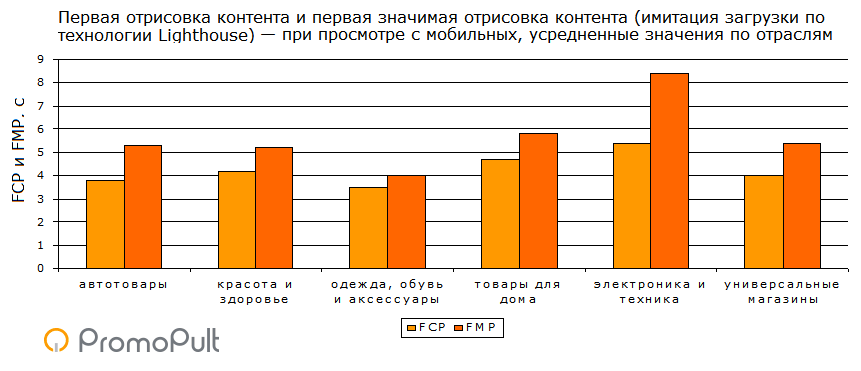
The biggest gap between FMP and FCP is observed in the field of sales of electronics and technology, the smallest - at the online stores of clothing shoes and accessories. Logic - why so - is hard to find. We can assume that this is due to the design features of sites in different industries.
By branches (desktops):
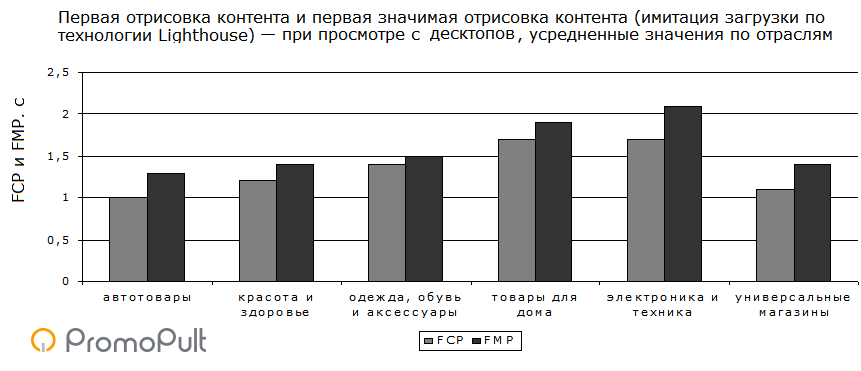
When viewing from desktops, the situation is similar - but the gaps between FCP and FMP are smaller. In addition, the lowest FMP value is observed in the field of automotive products, rather than clothing, shoes and accessories.
Download speed index
The Speed Index is the time it takes for the visible parts of the page to be displayed. This metric is developed and used by webpagetest. org . The service takes successive screenshots of page loading, analyzes the dynamics of content loading and displays the Speed Index.
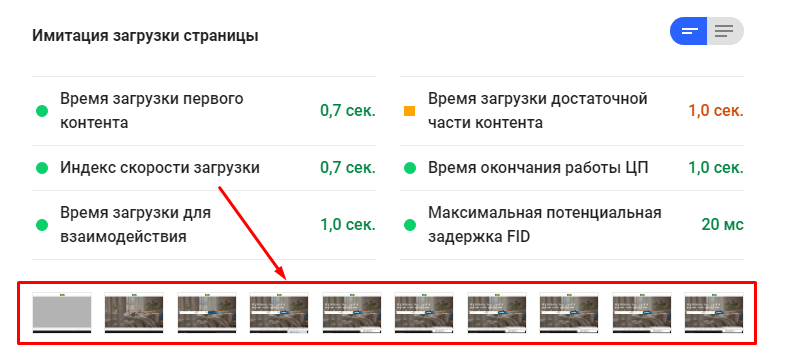
Let's look at the values of the Speed Index for the analyzed sites.

In mobile, 54% of sites have a download speed index above 10 seconds and 85% above 5 seconds (remember that the Speed Index is the second most important factor in the formation of a point estimate of the site load speed in PSI).
On desktops, the situation is much better - here only 23% of sites have a Speed Index above 5 seconds.
By industry:
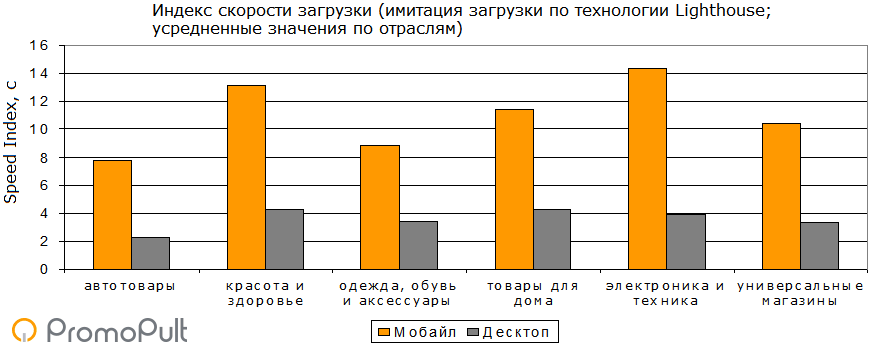
The best values of the Speed Index are observed in the sale of automotive products, as well as clothing, shoes and accessories. Mobile electronics store sites have the longest loading time - an average of more than 14 seconds.
CPU End Time
Previously, this indicator was called the time of the first interaction (First Interactive). But in Lighthouse 3.0, its name was changed to First CPU Idle.
First CPU Idle shows the period of time from the start of the page loading until the moment when it becomes minimally interactive:
- most, but perhaps not all interface elements become interactive;
- the page responds on average to most of the manual input in a reasonable amount of time.
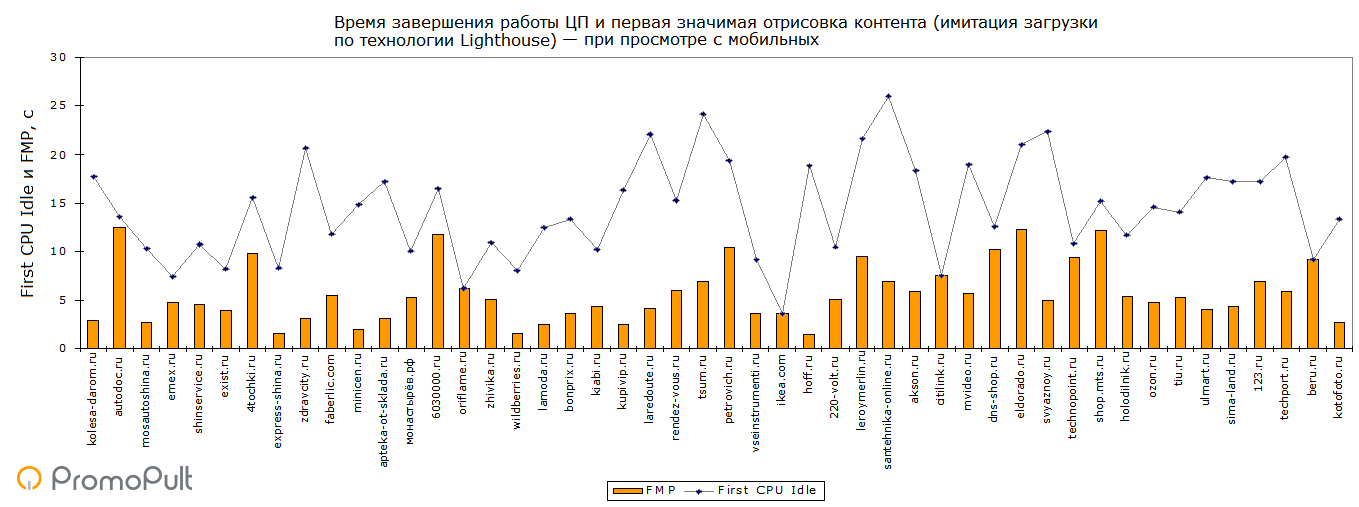
Compare the First CPU Idle values with the loading time of a sufficient portion of the content (FMP). The bottom line is to see how many users, after gaining access to content, have to wait for the opportunity to interact with page elements.
In mobile only 8% of sites match the values of First CPU Idle and FMP. In other cases, there is a gap (on average - 8.7 seconds). That is, if the user wants to click something on the page, the element will not be available immediately.
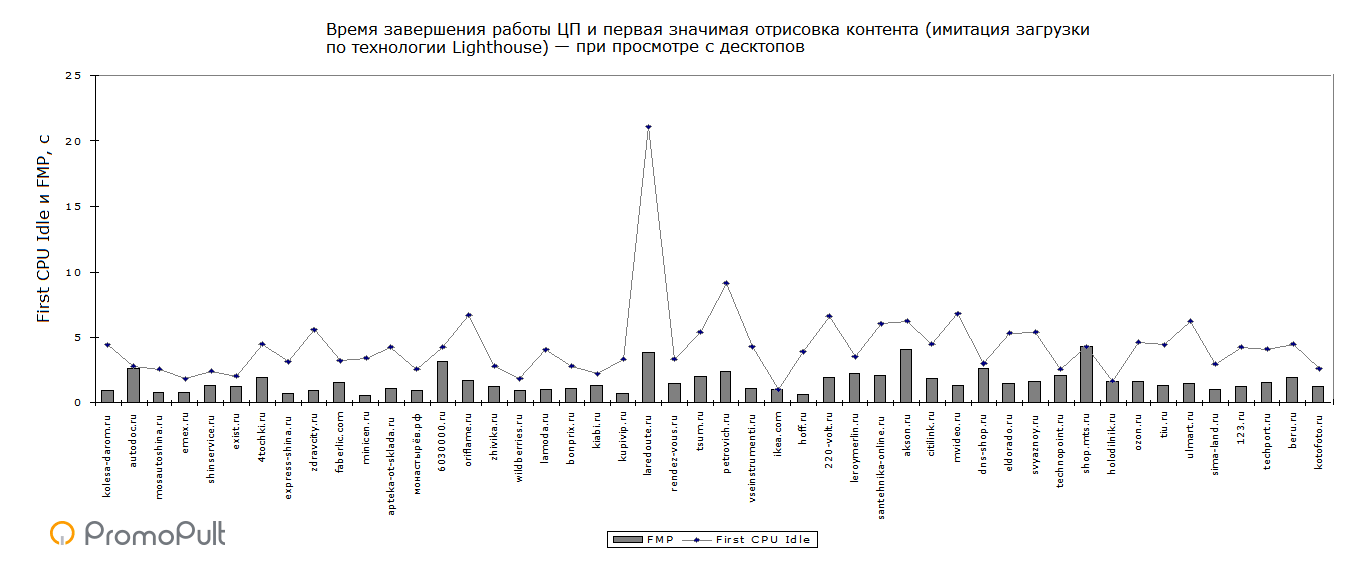
In the desktop, 6% of sites have the same First CPU Idle and FMP values. On average, the gap between these indicators is 2.7 seconds (3.2 times less than in mobile).
By industry (mobile):
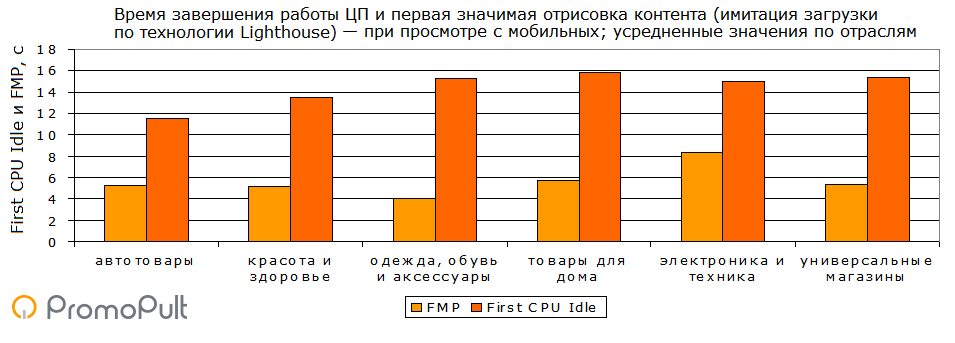
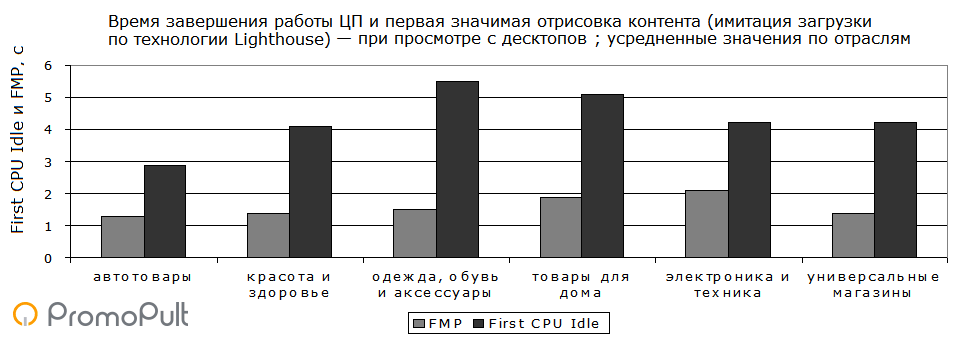
The smallest value of First CPU Idle is in the field of sales of automotive products, the largest is in the field of household goods. The maximum gap is at the online stores of clothes, shoes and accessories.
By branches (desktops):
Interaction Download Time (TTI)
This is the most significant metric when evaluating the speed of loading a site in PSI.
Time to Interaction (TTI) is the time from the user’s transition to the page until it is ready for interaction.
Analysis Results:
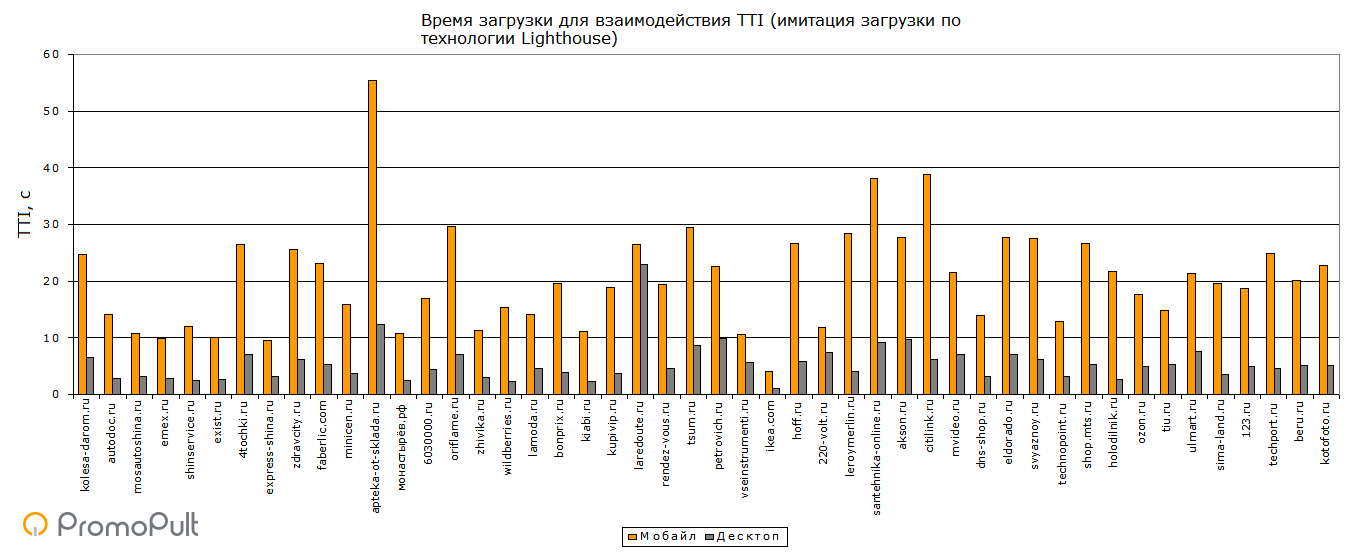
In 46% of sites when browsing from mobile, the total loading time is more than 20 seconds, in 94% - more than 10 seconds. When viewed from a PC, only 7% of sites load longer than 10 seconds.
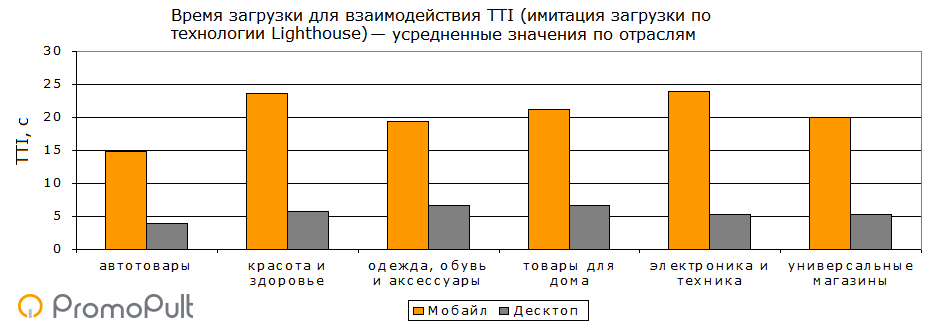
By industry:
Audit Results
In addition to metrics that characterize page loading speed, we also analyzed in which areas sites are successfully tested in PSI.
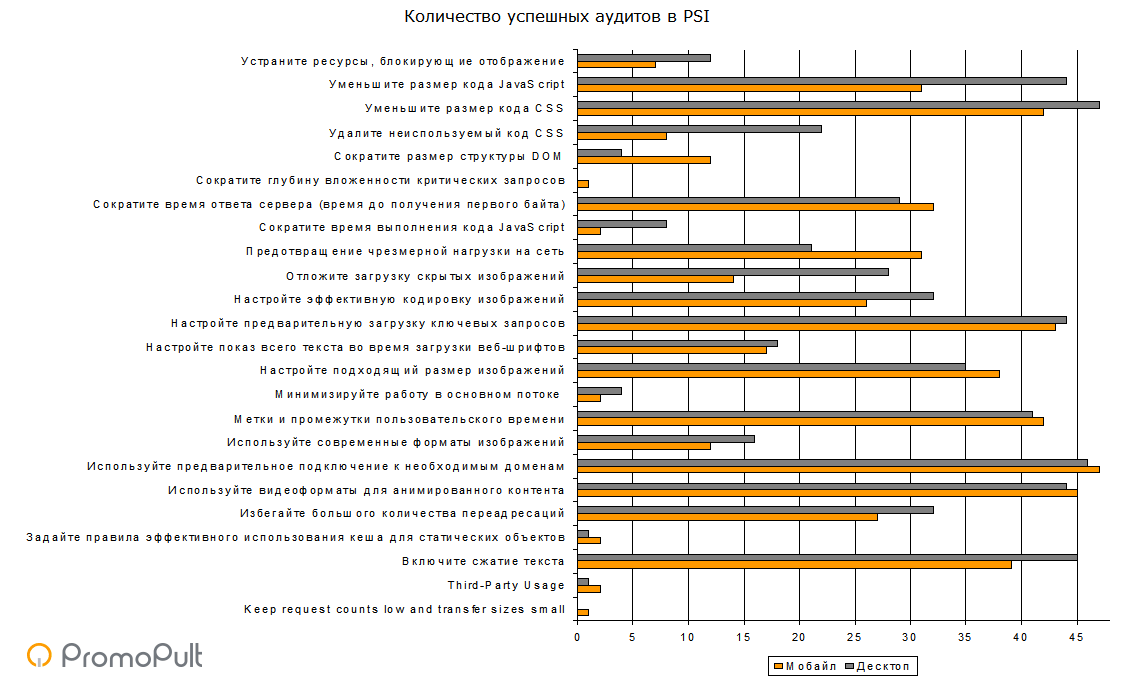
The average number of successfully completed audits in mobile is 11, desktop - 12.
It is unlikely that 100% audits can be completed, and this does not make sense, because some of them are for reference only.
For example, the Third-Party Usage audit shows external resources connected to the site (for example, Yandex.Metrica, Google Analytics, social network widgets, etc.). Naturally, no one will remove such resources from the site for the sake of a green tick in the PSI.
On the other hand, there are works that can be completed in a few minutes. For example, setting up caching, text compression, delayed loading of images, shortening CSS and JavaScript code - all this is done simply. But at the same time, the download speed can grow well.
Naturally, not only the download speed affects the quality of communication with the client. Try the SEO module in the Promopult system. There are all the tools to improve the quality of the site and search engine promotion. A full range of work - with us you will not miss a single trifle. Checklists, tips, transparent reporting and professional recommendations. And yes, we also have a site audit, no less demanding than PSI.
To summarize: is it worth fighting for high speeds?
When you look at the results of the analysis of the download speed of top online stores, you don’t add much desire to speed up your own website. Of the 48 sites, only one passes the PSI test in mobile and desktop with its head held high. With the rest, everything is either not very, or very bad. And these are “tops” - with a team and money. And then what about small regional stores? ..
But such a train of thought will lead you to the wrong place.
It’s useful to look at the “tops,” but not always to focus on them. Large sites are taxiing out due to a host of other factors besides loading speed. Here and assortment, and lending, and the availability of delivery, and loyalty programs. Do not forget about the strength of the brand. If a person is looking for a specific store, he is ready to survive a long load.
Small shops live by other rules. In terms of assortment and service, competing with large sites is not easy. But due to the quality - for example, a quick and convenient site - you can retain the client and at the same time improve your position in the local search results.
Of course, when speeding up the site, you need to compare the costs and the expected effect. Up to a point, you can speed up your site quickly and for free. The same lazy load loading, caching settings and GZIP compression are implemented using plugins or simple codes.
But already optimization of the structure, scripts, server response speed may require serious website redesign. And if your site converts traffic well in the current state, then it is better to invest in attracting users - SEO, context, advertising in social networks - than to fight for a couple of points in PSI.
All Articles