Debugging games for NES: how it happens today
If you have ever been involved in programming, you are familiar with the concept of bugs. If they did not bother us, the development process would become much faster and more enjoyable. But these bugs are just waiting for the moment to ruin our code, work schedule and creative flow. Fortunately, there are many tools and strategies for killing bugs even in the code of retro game programmers.
Debugging Tools
One of the best ways to debug code is to use a debugger. Some versions of the FCEUX and Mesen emulators have a built-in debugger that allows you to interrupt the program at any time to check the health of the code.

FCEUX emulator debugger
It is worth noting that this method is more suitable for advanced programmers working with assembly language. But we are new, so we will write in C (cc65). Of course, the compiler will play by its own rules, and it will be difficult for us to deal with machine code compiled from C code.
Hex editor FCEUX
Let's say we need to observe some kind of variable or array. Add the following line to the linker options (ld65):
-Ln labels.txt
After compiling the project, the
labels.txt
file will appear in its folder. Just open it in any program for viewing texts and look for the name of the variable that we want to observe.
( Note: if you declared a static variable, it will not be included in this list. Therefore, instead of
static unsigned char playerX
use
unsigned char playerX
)

Now we know the address of the desired variable, not bad. Let's find it in the debugger. Run the ROM games in the FCEUX emulator. In the Debug menu, select Hex Editor, and in the window that opens, press Ctrl + G and enter the address of our variable:

Press OK, and the cursor will move to the address where the variable is located. Let's take a look at it:
This can be useful for checking if the array is filled correctly or for tracking changes in specific variables. In addition, you can feel like a Big Brother, carefully monitoring your code.
Explore other useful FCEUX emulator Debug menu tools, such as PPU Viewer, Name table Viewer, etc.
Simplify the debugging process
And if we do not want to run a debugger each time to observe a variable? A more advanced way is to write a procedure that displays the value to the screen. Let's try using the score in the interface to display the player’s position on the Y axis:

It works perfect!
Retro-coder and nesdoug blog owner Doug Fraker has created a similar method for using on-screen visualizations for debugging purposes. The procedure shown below creates a gray line on the screen that clearly shows the degree of CPU load:
// void gray_line(void); // For debugging. Insert at the end of the game loop, to see how much frame is left. // Will print a gray line on the screen. Distance to the bottom = how much is left. // No line, possibly means that you are in v-blank. _gray_line: lda <PPU_MASK_VAR and #$1f ;no color emphasis bits ora #1 ;yes gray bit sta PPU_MASK ldx #20 ;wait @loop2: dex bne @loop2 lda <PPU_MASK_VAR ;normal sta PPU_MASK rts
You can simply copy this procedure into your code or include the nesdoug.h library in the project. The procedure must be called after the completion of the game cycle, then a gray bar will be displayed on the screen.

It worked, but it looks like I have one more bug! We will get rid of him later. In the meantime, let's move on.
The power of macros
Macros can also be a useful debugging tool. They will allow you to find a place in the code that has become the source of the bug.
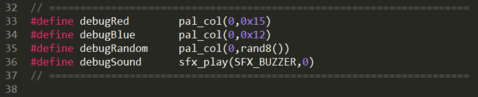
Let's create some kind of macro that will give us signals at the right time, for example, play a sound or select a zero palette with the necessary value. We have several macros that change the zero palette to red, blue and random colors, as well as reproducing sound:
How it works? Suppose you successfully compiled a project, you start the emulator with your game, click on the Start button and ...
There seems to be nothing but a white screen. In addition, some emulators may indicate in the status bar “CPU jam!” What to do next?
First, you need to localize the code in which the error occurs. And here my macro of sound comes into play.
We know for sure that the main menu is working. Let's see what happens after it:
playMainMenu(); player.lives = 9; points = 0; gameFlags = 0; while(current_level<7 && player.lives>0) { set_world(current_world); debugSound; playCurrentLevel(); }
I have a suspicion that the game crashes when the
set_world
procedure is
set_world
. Let's check this hunch. I simply enter the macro name in the next line after the procedure being checked.
We start the project and ... I hear a sound! That is, this procedure was successful, and we need to check the following:
playCurrentLevel
. Let's move the debug macro below:
while(current_level<7 && player.lives>0) { set_world(); playCurrentLevel(): debugSound; }
I start the project again, but I can’t hear a sound. This means that the procedure is not completed, and a failure occurs inside it.
In such cases, you should open the procedure code and continue to apply this technique until you can narrow your search for a possible bug location.
A palette-changing macro can also be useful for checking conditions. For example, our code performs a complex test of several conditions:
if ( (getTile(objX, objY+16) || collide16() ) || (objsOX[i] && objY>objsOX[i])) { debugRed; objsSTATE[i]=THWOMP_SMASH; objY=objsY[i]-=4; objsFRM[i]=0; sfx_play(SFX_THWOMP_SLAM_DOWN,2); }
If we change the color of the palette here, we will see if the condition is satisfied:

This chicken seems to be okay. But if the flag does not work, then one of the conditions is not fulfilled. In this case, you need to check them all separately and then, perhaps, you will find another bug.
Nuclear option
I recently discovered that one of the ghosts in my game exhibits some kind of suspicious behavior. From time to time, he refused to attack the player.
Take a look at this ghost hit by a bug - it only attacks when the character is close to the center of the screen:
No matter how hard I studied the code of this procedure, I could not figure out where the bug was hidden, so I decided to take extreme measures and test the work of this code in a modern development environment.
I took everything I needed: a screen map, an array with meta-file attributes, a procedure code, and simply inserted them into Visual Studio 2017:

On PC, the code worked exactly the same. As it turned out, the bug was hiding in a procedure that filled the cache to find obstacles between the player and the enemy. The array was filled incorrectly. I am sure there should be 0 instead of 0x80.
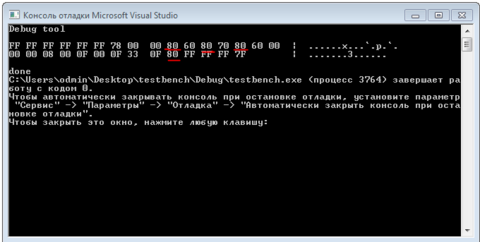
So, I will try to step by step debug the code to find out why this is happening.
Funny, but it looks like I was doing the actions in the wrong sequence. Let's fix it and check the array again!
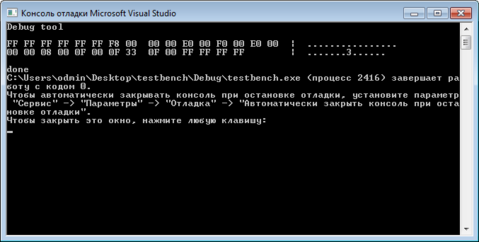
It seems now the array is populating correctly. That is, I just need to fix the cc65 code and compile the NES project again.
So, modern development tools can help in debugging algorithms and fixing bugs.
Get rid of bugs calmly
Bugs are annoying, as can code annoying. Just stay calm, do not lose control and use the entire range of available tools to find and destroy these pests. The quality of your code and peace of mind will increase significantly.
Want to get advice directly from retro-design professionals? Welcome to our Discord!
Our game The Meating is available here !
All Articles