Training Cisco 200-125 CCNA v3.0. Day 31. CDP, Syslog and NTP. Part 1
Today we’ll cover 3 concepts: the proprietary Cisco CDP protocol, the Syslog system log, and the NTP network time protocol. We will also continue to discuss the topic of problems and look at a few tools for diagnosing them, then look at Syslog and NTP and at the end of the lesson discuss CDP and LLDP.
In the previous lesson, we looked at the troubleshooting methodology, and now I’ll talk about several tools built into the operating system and Cisco devices that can help you solve network problems.
The first tool is the ipconfig command, and since most people use Windows 10, we will look at this command using an example of this OS. If you go to the command line terminal of your computer and enter the ipconfig command, you can see the configuration parameters of all the network interfaces available on your computer.
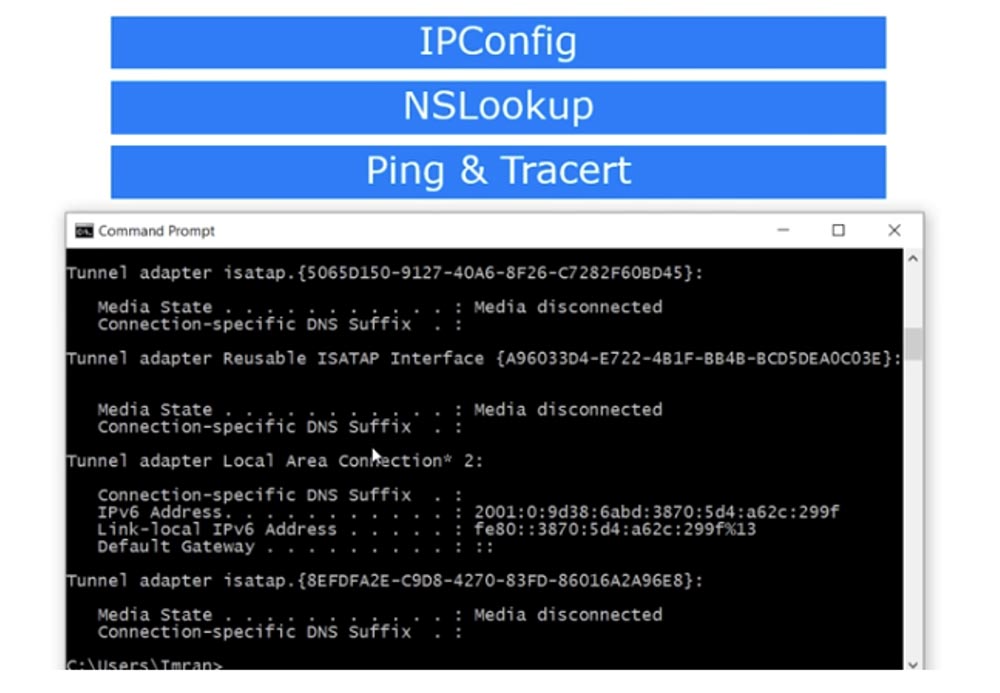
You will see the software virtual interface Ethernet Adapter VPN and several more software interfaces, the number of which depends on the drivers available in the system. Here is shown my Wi-Fi wireless LAN adapter, with which I am now connected to the Internet, data on the WMware Network WMnet1 virtual adapter is located a little higher. The tunnel adapter is shown below, i.e. all adapters installed by the VPN software are displayed here.
The CCNA course topic requires you to know about two adapters: a wireless Wi-Fi adapter and an Ethernet adapter.
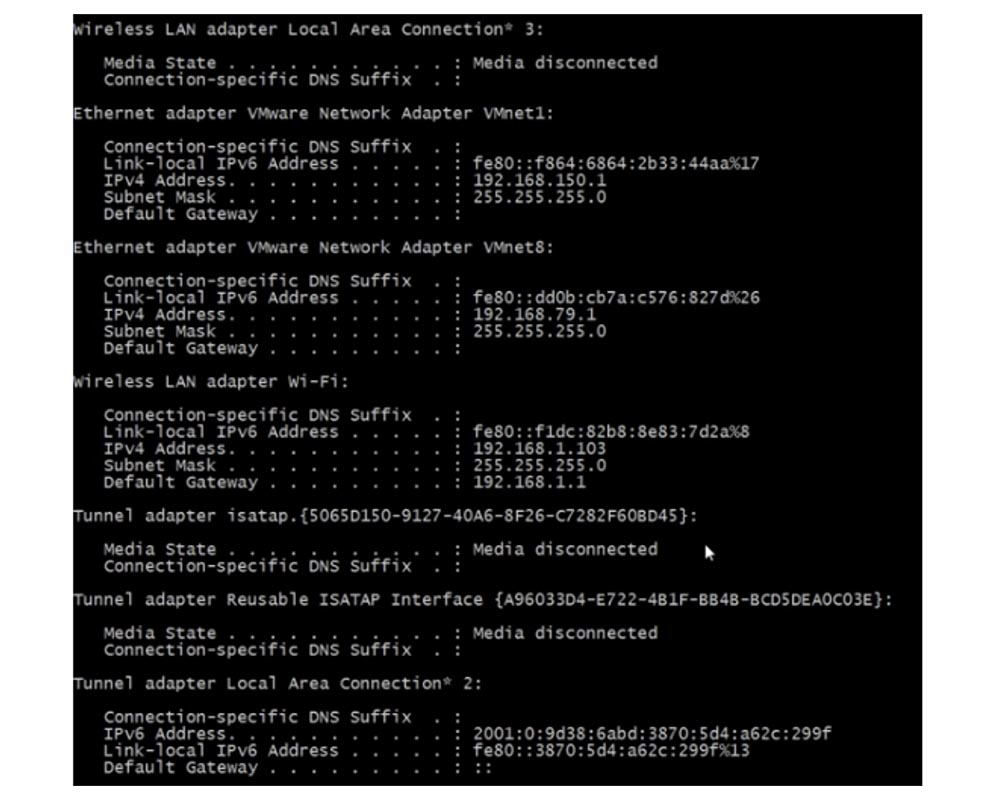
For an office network, the wireless adapter is more important, and if any of the users contact you with a problem, you first need to use the ipconfig command and look at the IP address of the device. You should check if this address is in the DHCP address range. Perhaps the user turned off the dynamic and turned on the static IP, which is not part of DHCP, or the device is configured to automatically obtain an IP address and cannot for some reason contact the DHCP server.
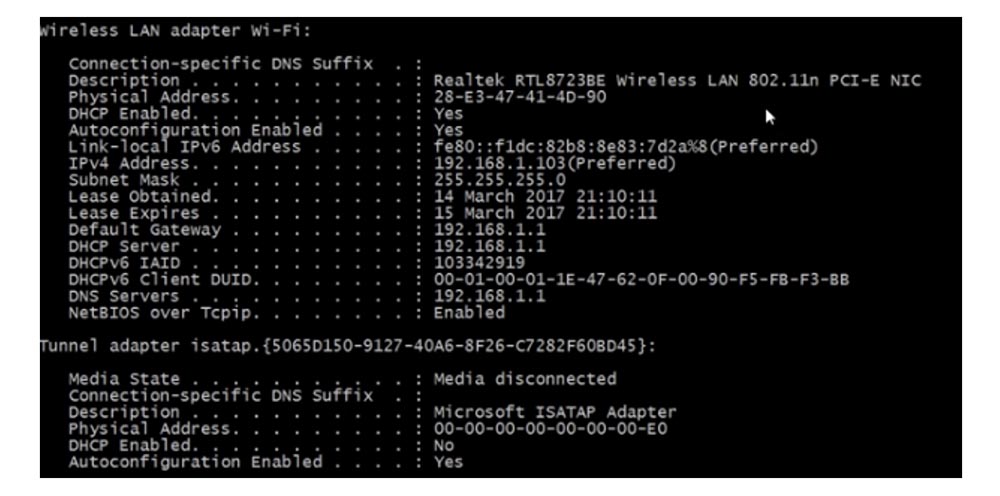
If you need more complete information, use the ipconfig / all command. You will receive the same data, but in a more detailed form, with the description of the adapter brand, DHCP parameters, Link Local address, IP address, server lease validity period, default gateway address and so on.
If, as a result of checking this information, it turns out that everything is OK with the IP address and the interface settings are not the cause of the problem, you should use other diagnostic tools, for example NSLookup. This is a utility that allows you to access the DNS system through the command line. If this does not resolve the problem, use ping. I use the ping 8.8.8.8 command, that is, I ping Google’s public DNS. If the ping passes, then everything is in order with the connection and the reason should be sought elsewhere.
If ping fails, you need to use a tool called Trace Route, or tracert. This is a Windows command to trace the route to a given host. If you type tracert 8.8.8.8 on the command line, you will get ping with a value of TTL = 1 with a route trace of up to 30 nodes. As you can see, the first node is my router, the system showed its DD-WRT firmware and IP address 192.168.1.1, the second one is the server of my provider with the IP address 192.168.100.1, through which I go to the Internet, then pings on other nodes and reaches the Google server. In our case, it turned out 14 hopes, but if, for example, a problem arose on the side of my provider, then the trace will stop after the 3rd node characterizing the ISP server.

So, Trace Route is an excellent tool for identifying problems along the route of traffic.
Let's take a closer look at what NSLookup is. This is a command that talks about your DNS server. If you type nslookup, I get two lines: the default server is DD-WRT, that is, my router, and its address is 192.168.1.1. If I specify a specific DNS server with the server 8.8.8.8 command, the system will give me its description and IP address. This way you can check any given DNS server. In the same way, I can get data about a specific domain by typing, for example, www.cisco.com .
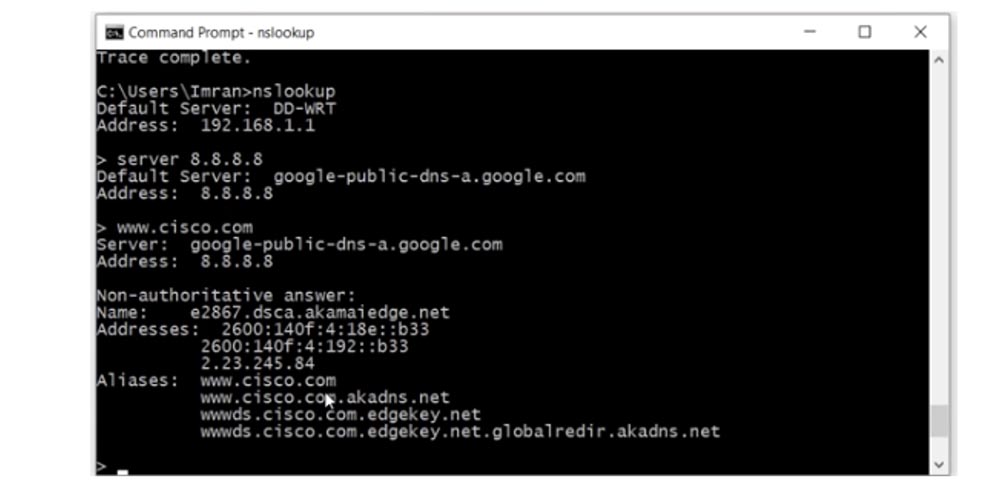
As you can see, Cisco uses two versions of the IP address, and if I type google.com, we will see many IP addresses used by this server. This is a huge service, which is accessed by so many people that one IP address may not be enough.
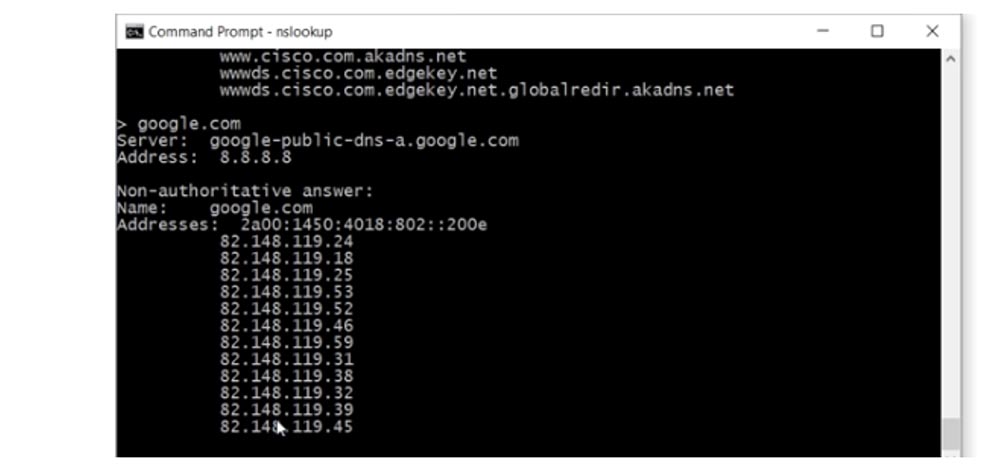
There is a joke that when people want to know if the Internet is working, they simply type google.com. In addition to PC users, owners of smartphones running Android are constantly accessing this service, so there is simply huge traffic passing through the servers of this company.
Thus, the nslookup command allows you to find out the IP address of a specific domain name. All the tools mentioned above do not fix the problems, but serve to diagnose them. The more you practice in the IT industry, the more effectively you will be able to use these tools, because only practice and experience can teach you to quickly diagnose and fix network problems. Practice will give you the opportunity to understand what the problem is, from a glance at the network settings console of the computer. Therefore, after we complete the study of the topic of ICND1, I will post practical laboratory work on the site so that you can apply the acquired knowledge of the theory.
Before I talk about the syslog, I want to talk about the Terminal Monitor command of the Cisco IOS operating system. I will go into the Packet Tracer program (if you have not already installed it, you can register with Network Academy and download this program), take two routers and connect them with a cable.
Then I will go into global configuration mode and take turns setting up these routers, giving them the names R0 and R1.
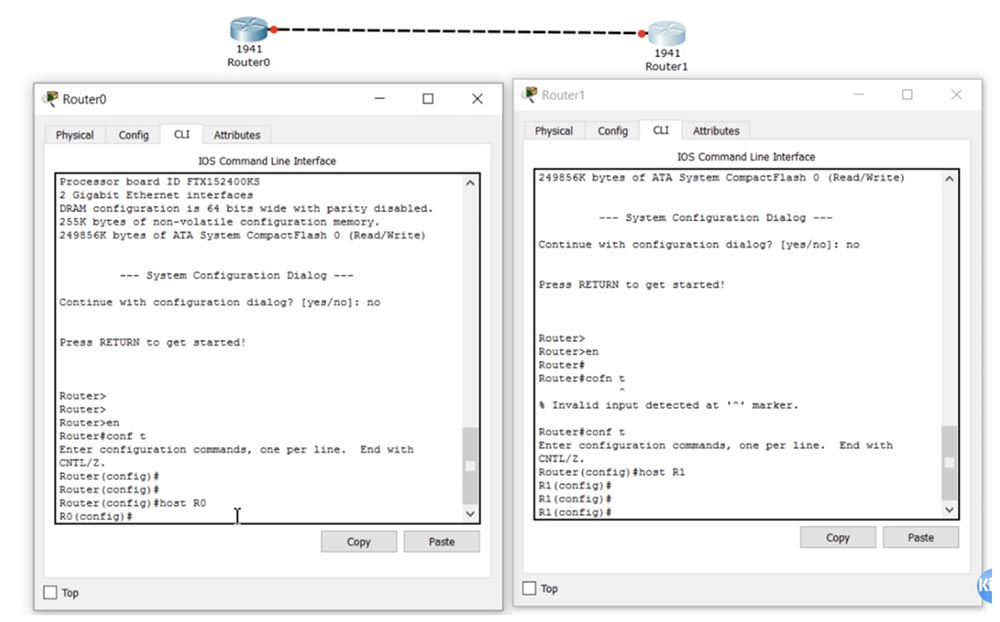
Next, in the R1 settings, I will enter the enable password enable command to set the password and configure the g0 / 0 interface using the ip add 10.1.1.2 255.255.255.0 and no shut commands. In the same way, I will configure the R0 router by assigning it the IP address 10.1.1.1. Then I activate the Telnet protocol with the line vty 0 4 command and set the password for entering Telnet with the login and password telnet commands. Next, I will go to the settings of R0 and use the telnet 10.1.1.2 command to establish a connection with the R2 router. After that, the system will ask for a password to establish a connection, and I will enter the word telnet, which I set as the password for R2. As you can see, after that, on the command line, the name of the router R0 changed to R1 - this means that I went through the router R0 to the settings of the router R1.
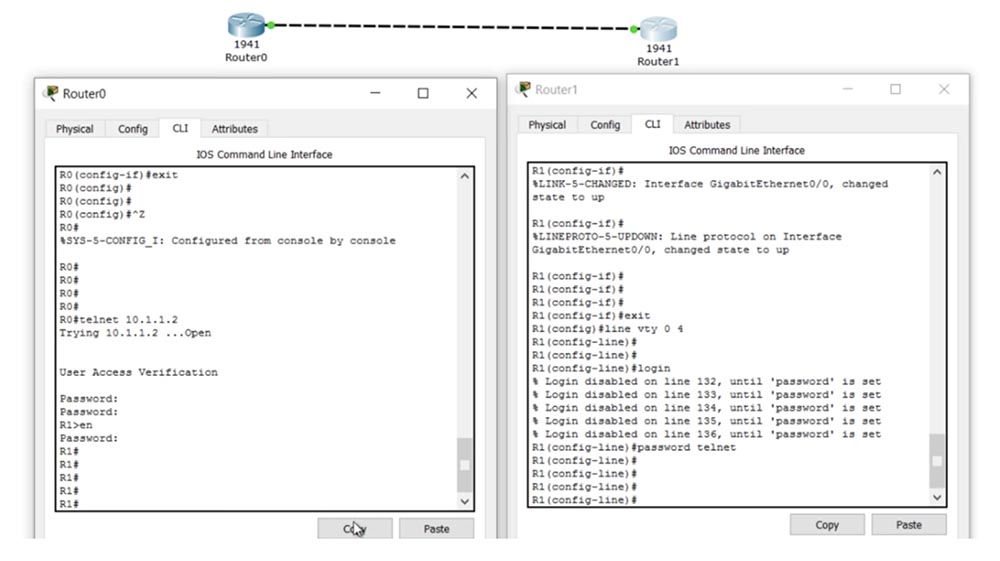
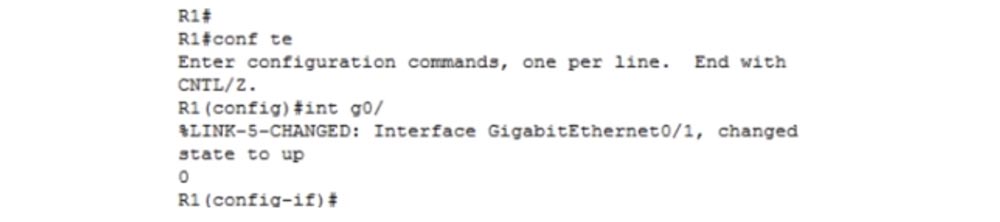
Now let's move on to the g0 / 1 interface and I will show you a couple of things. First, I use the no shut command for it. You see that a log message appeared in the CLI window of the second router, that the state of the g0 / 1 interface has changed to up.

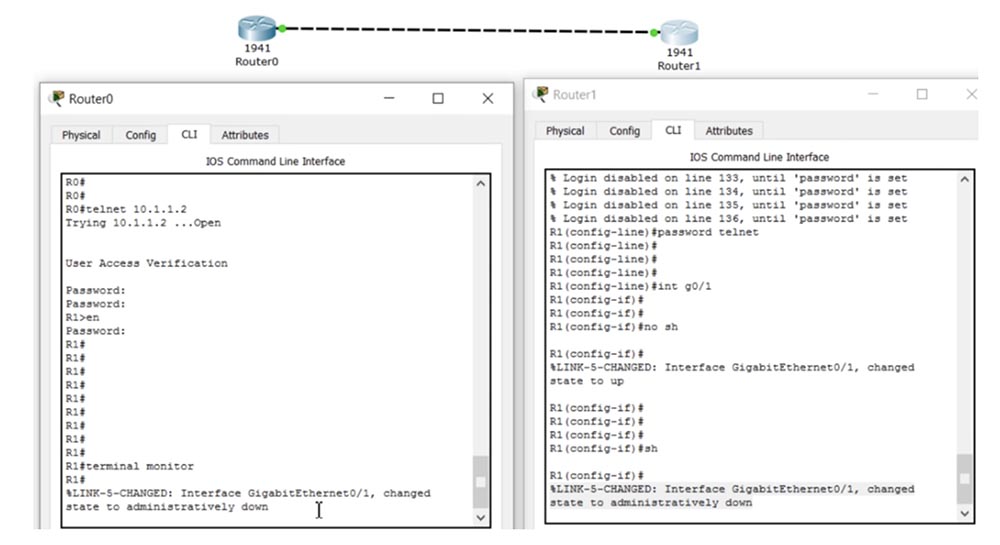
Since I entered the R1 settings from the R0 router, it turned out that I had connected a regular laptop to the second router with a cable and controlled it remotely. However, this log message appeared only in the R1 window, because I was connected to the second router only via the Telnet channel and it was not duplicated in the CLI window of the first router. The fact is that if you remotely entered the settings of a device located, for example, in another building, by default the log messages of this device will not be displayed on your screen.
In order for these log messages to be displayed on the screen of your device, you must use the terminal monitor command. In fact, it means that if any event log messages appear on the screen of another device, they must be sent in the form of packets via the Telnet protocol to the IP address of your device. By default, log messages are not sent to the IP address, but after entering the terminal monitor command, this will begin to happen. If I now enter the shutdown command in the settings window of the R1 router, a log message about the change in the state of the interface will simultaneously appear on both screens.
Now I will go into the global settings mode R1 in the first window and start typing some command, for example, int g0 / 0. Suppose I managed to print only int g0 /, and at that moment some kind of log message appeared. My team will be torn by this message into two parts, so 0 will be on the next line, and the device may not understand it. This is especially inconvenient if I type a long command, or if the log messages consist of many lines, because I won’t know where to stop typing so that my team doesn’t get torn to pieces, or I can forget where I left off.
To prevent this, log synchronization is used. I type the line vty 0 4 command in the right window to go into Telnet settings, after which the command line header changes its appearance from R1 (config-if) to R1 (config-line). Then I enter the logging synchronous command and go back to the left window.
Now I repeat the same situation - type int g0 / and pause, during which the log message appears again. It also appears on both screens, but now its text does not break my command, and underneath it just repeats what I started typing. Now I can calmly continue to type the team I started, without fear that it will be split into pieces by the appearing logs. For me, as a user, this is very convenient, because you do not need to think about how to type a command faster, until suddenly an event log message appears. This is what the logging synchronous command does, or "synchronize logs".

Each of the log messages has a certain priority level, in our example it is level 5. The lower the value of the logging level, the more important the message. In total there are 8 priority levels of Cisco logs.

0 - emergency, the system is not fully operational,
1 - an alarming situation, urgent intervention is necessary,
2 - critical events, the system may fail,
3 - error messages,
4 - all kinds of warnings
5 - various important notifications,
6 - informational messages,
7 - debug messages.
The first three levels report dangerous conditions of the system, level 3 indicates problems in the system, the fourth level warns that the state of the system may become unstable, but it is still functioning. Level 5 notifies about various events, for example, about a change in the link state, as in our example. If you are using debug mode, level 7 debug messages will appear on the screen. If you are a busy person and do not want to read all the logs, you can choose which level of danger messages will be displayed on the screen.
For example, I want to see only log messages up to the 3rd level of danger. In this case, the system will only display messages of levels 0, 1, 2, and 3, ignoring messages of levels 4-7. By default, level 7 is set, so you will see the logs of all levels, from zero to seventh.
We looked at what Terminal monitor is, and now let's move on to Syslog. If important log messages appear on your screen, you might want to save them somehow on the Syslog server, because usually these messages are stored only in the router’s memory and you won’t be able to analyze them after some time.
Let's go back to Packet Tracer and add a server to the circuit, which is directly connected to the first router. In practice, the switch should be located between them, but we use this scheme for training purposes, so we can do without the switch. I go into the server’s network settings and assign it a static IP address 10.1.2.10, a subnet mask of 255.255.255.0 and a default gateway address of 10.1.2.1. This address does not exist yet, but I will configure it when I proceed to configure the interface of the R0 router.
Next, I’ll go to the settings of R0, use the g0 / 1 command and assign it the address 10.1.2.1 with a subnet mask of 255.255.255.0. Thus, the server and the router will be on the same network. Then I need to go into the settings of the second R1 router and configure the connection with the first router. You can configure a RIP or a static route, in this case I choose the latter.
To do this, I enter the ip route 0.0.0.0 0.0.0.0 10.1.1.1 command, that is, I indicate that all traffic is sent to the address 10.1.1.1. Then I enter do show ip route and see that the gateway of the last queue Gateway of last resort has the address 10.1.1.1 for the network 0.0.0.0.
Now I will check whether it is possible to ping the device at 10.1.2.10. If you remember, ping is a diagnostic tool for problems, and as you can see, ping was successful. Next, I turn on debug mode with the debug ip icmp command, this means that every time the router pings, a corresponding message will appear in the console window.
If I ping R1 from the left router R0 using the ping 10.1.1.2 command, log messages will appear in the CLI window of the right router, by default, priority level 7. I want any log messages that appear during the configuration process to be sent to the Syslog server. To do this, I go to the Services tab of the server settings panel and see that the Syslog parameter is enabled by default. Okay, now I have to tell R1: “every time a log message appears, please send it to the Syslog server at 10.1.2.10!”. To do this, I enter the logging 10.1.2.10 command. Now all log messages will be sent to the server. Let's see how this happens.
I enter the settings of R0 and again I ping the router R1. In the CLI window of the right server, debug message appears, which should be forwarded to the Syslog server. I go to the Syslog tab of the server and see that all these messages appeared there.
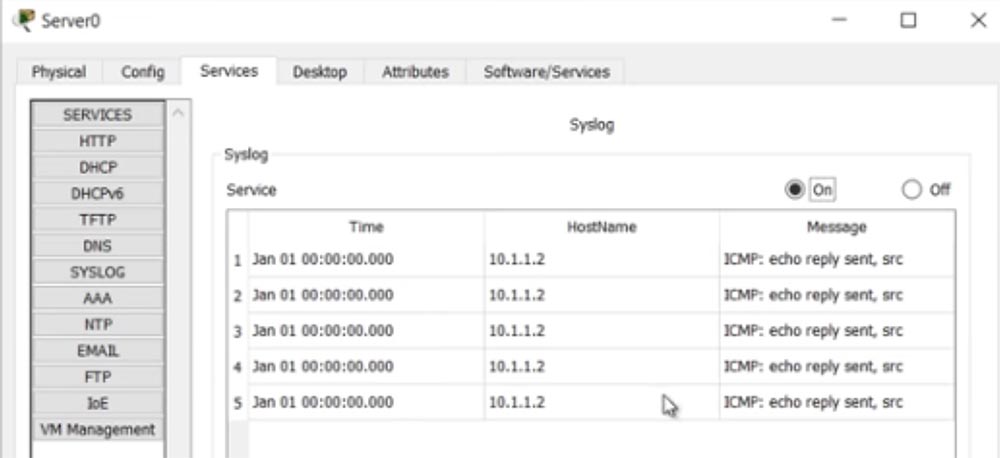
Thus, if any events occurred during the weekend, then having come to work on Monday, you will be able to view all the log messages in which these events are recorded. If you have any problems, then you can analyze what happened and apply measures to eliminate them.
However, if you look closely at the Syslog messages, you will see an error: they all have a time stamp on January 1 of zero hour. This means that I can’t find out when the recorded events really happened. This happened because the system clock of the R1 router shows the wrong time. If I enter the show clock command in the settings of this router, I will see the message 0: 26: 9.539 UTC Mon Mar 1 1993. This means that 26 minutes 9 seconds have passed since the router was turned on, and the default clock starts counting from March 1, 1993 of the year.
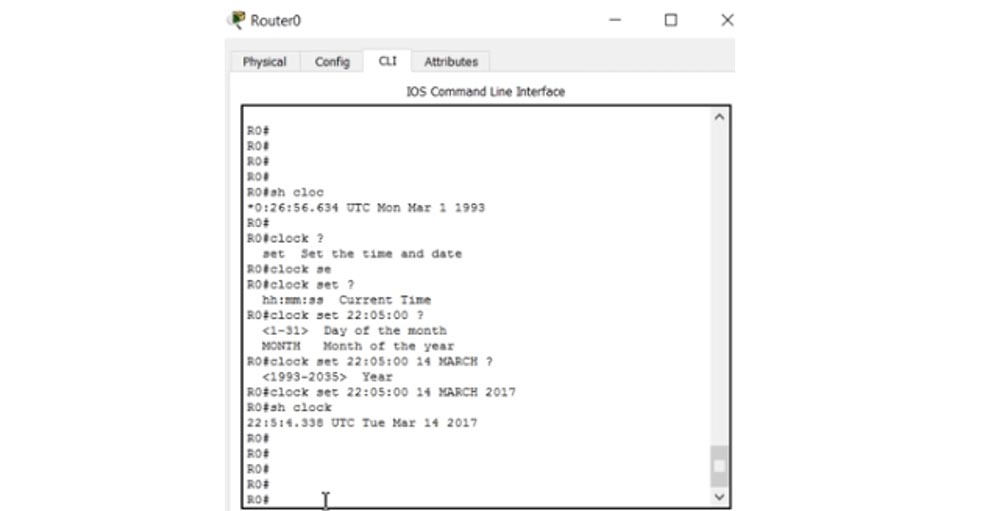
I can manually set the correct time and start doing it with R0 router. I enter the clock set command and then set the correct time in the format hh: mm: ss. After I enter 22:05:00, the system gives a hint for entering the day of the month from 1 to 31 and the name of the month. I am printing 14 MARCH and should now enter the year in the range from 1993 to 2035. As a result, I type in the line 22:05:00 on MARCH 14, 2017, after which I press Enter. If you now type show clock, the system will display the correct time.
You may ask why I set the time on the router R0, and not on R1. This is because I want to show you the automatic time setting of the second router. Next, I enter the debug ip icmp and logging 10.1.2.10 commands in the R0 settings so that the logs are sent to the Syslog server.
Then I disable the debugging of the R1 router with the un all command and ping the device 10.1.1.1. Ping is successful, and if you now look at the server’s logs, it’s clear that new messages have been added here, but for some reason again with the wrong time and zero date. This is strange, because the correct time is also shown in the settings of the R1 router. I again ping R0 router from R1 router, log messages appear on the screen and in the server log, but again with the wrong date. Probably the information has not yet been updated, and I will try to find out why.
I go to the settings of the R0 router and turn off the debug messages with the un all command, after which I go to the settings of the R1 router and enter the service timestamps command, which puts a time stamp on debug messages or log messages. In our case, I use service timestamps log datetime ms.
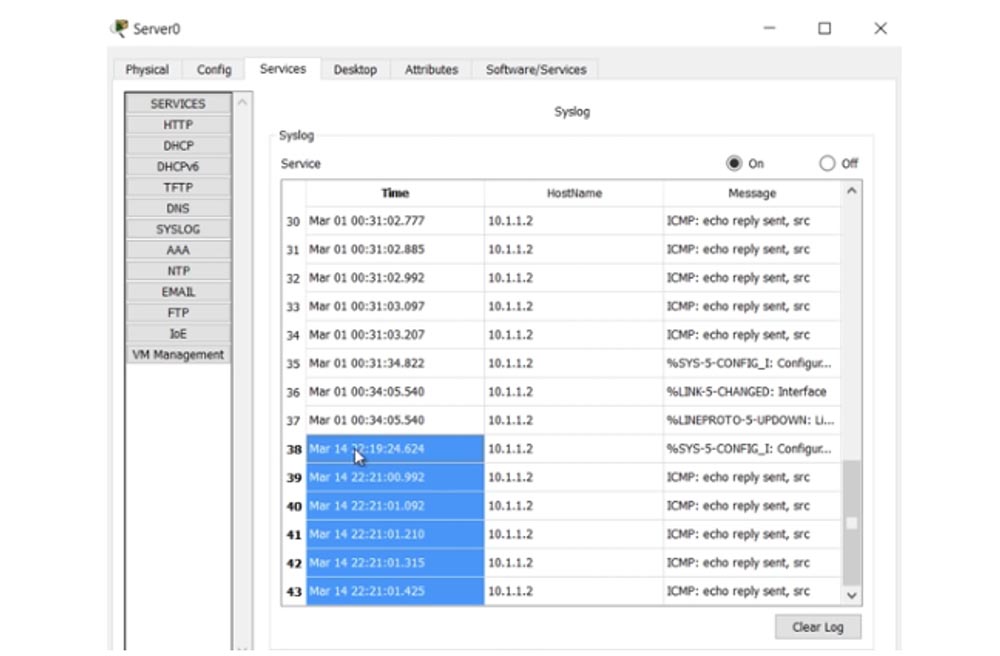
Then I go back to the settings of R0 and ping R1. Now you see that the messages appeared on the server with the date and time: March 1 00:31:02 with milliseconds. But this is the wrong date, since I set not March 1, but March 14! I apologize for making mistakes in this video tutorial, now I will fix them.
I will try to set the correct time in a different way. The fact is that until I activated the time stamp service, messages arrived with the default time and date. Then I turned on the timestamps service, but after that I did not set the correct time and date, which is why the time stamp in the log messages turned out to be incorrect.
The problem with manually setting the time is that if you have hundreds of devices, you need to go into the settings of each device and set the time and date. To avoid this, there is an automatic NTP mechanism, or network time protocol, which synchronizes computer time with the time of network devices. You can select one network device as NTP-master and set the desired time. Studying this protocol is beyond the scope of the CCNA course, and I’m not sure that the ntp master command is supported by Packet Tracer. But I’m still trying to set the right time, for which I’ll add another server to our network and assign it an NTP server.
To do this, I will go into its settings and check the NTP tab. As you can see, the correct date and time are set here and the NTP function is enabled.

Then I go into the network settings of Server1 and assign it an IP address 10.1.3.10, a subnet mask of 255.255.255.0 and a default gateway of 10.1.3.1. As I mentioned earlier, this gateway is not configured, so I go into the settings of the R1 router and configure the g0 / 1 interface to communicate with the server by entering the ip add 10.1.3.1 255.255.255.0 and no shut commands.
Further, in the settings of the router, I enter the ntp server 10.1.3.10 command, after which the R1 router will be able to receive the correct time from the NTP server. As you can see, now we have level 5 log messages with the correct time stamp.
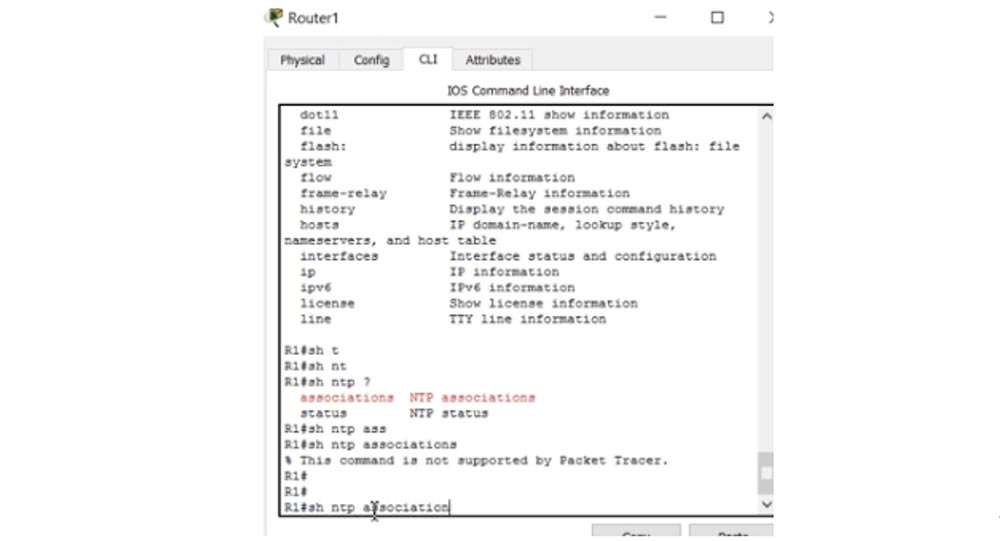
show clock, , . ntp association, , Packet Tracer, ntp.
ntp status , . , Stratum 2 – , NTP-, R2 , 1. , R1, stratum 3 (NTP- + R1 + ), R1 NTP- 2. , .
R0 R1 10.1.1.2, , Server0 , .
, NTP Syslog. – CDP, Cisco Discovery Protocol. .
, , , , . Cisco, , , IP-. , LLDP, Link Layer Discovery Protocol, , CDP, .
CDP Cisco . LLDP, Cisco . , LLDP, Cisco, CDP.
, , Packet Tracer. , , CDP , Server0 R0. , , .
CLI R0 show cdp. , cdp- 60 , 180 , – CDPv2.
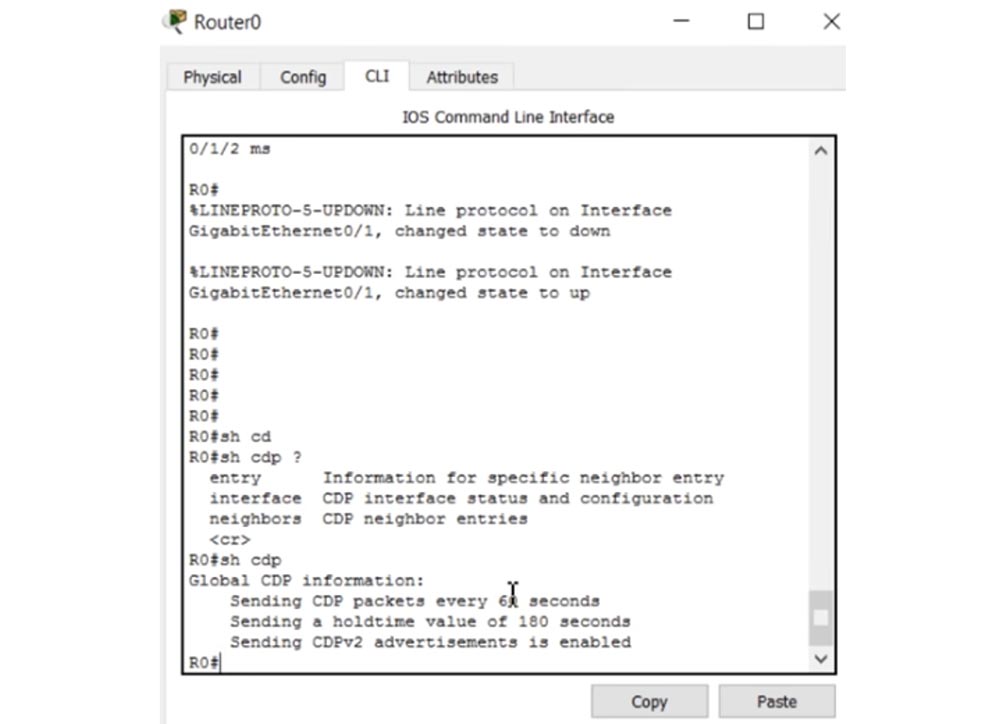
CDP , , , . 60 . show cdp neighbors, , R0 CDP-.
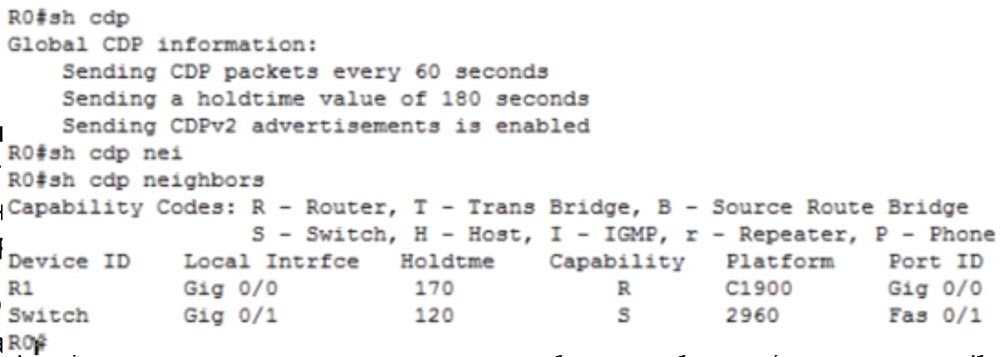
, R0 – R1 . R1 R 1900 R0 g0/0, g0/0 R0.
, show cdp neighbors , , , . , .
R0 – 2960, g0/1. , , , , , Capability, : R – , S – , H- .. R0 FastEthernet 0/1.
, CDP . , , – CDP . , , . CDP? config t cdp run. , cdp . cdp no cdp run. , cdp, show cdp – , CDP is not enable.
, cdp , . , , cdp cdp run, , , int g0/1, cdp enable, , no cdp enable, . no cdp enable cdp , . , / cdp run, – enable.
show cdp neighbors, , R0 – R1. cdp g0/1, «».
LLDP , CDP, lldp run/no lldp run. , Cisco CDP , LLDP – . LLDP , , g0/1, lldp receive, , lldp transmit, LLDP -.
, no lldp receive, – no lldp transmit. CDP LLDP , , – , LLDP -.
Thank you for staying with us. Do you like our articles? Want to see more interesting materials? Support us by placing an order or recommending it to your friends, a 30% discount for Habr users on a unique analogue of entry-level servers that was invented by us for you: The whole truth about VPS (KVM) E5-2650 v4 (6 Cores) 10GB DDR4 240GB SSD 1Gbps from $ 20 or how to divide the server? (options are available with RAID1 and RAID10, up to 24 cores and up to 40GB DDR4).
Dell R730xd 2 times cheaper? Only we have 2 x Intel TetraDeca-Core Xeon 2x E5-2697v3 2.6GHz 14C 64GB DDR4 4x960GB SSD 1Gbps 100 TV from $ 199 in the Netherlands! Dell R420 - 2x E5-2430 2.2Ghz 6C 128GB DDR3 2x960GB SSD 1Gbps 100TB - from $ 99! Read about How to Build Infrastructure Bldg. class c using Dell R730xd E5-2650 v4 servers costing 9,000 euros for a penny?
In the previous lesson, we looked at the troubleshooting methodology, and now I’ll talk about several tools built into the operating system and Cisco devices that can help you solve network problems.
The first tool is the ipconfig command, and since most people use Windows 10, we will look at this command using an example of this OS. If you go to the command line terminal of your computer and enter the ipconfig command, you can see the configuration parameters of all the network interfaces available on your computer.
You will see the software virtual interface Ethernet Adapter VPN and several more software interfaces, the number of which depends on the drivers available in the system. Here is shown my Wi-Fi wireless LAN adapter, with which I am now connected to the Internet, data on the WMware Network WMnet1 virtual adapter is located a little higher. The tunnel adapter is shown below, i.e. all adapters installed by the VPN software are displayed here.
The CCNA course topic requires you to know about two adapters: a wireless Wi-Fi adapter and an Ethernet adapter.
For an office network, the wireless adapter is more important, and if any of the users contact you with a problem, you first need to use the ipconfig command and look at the IP address of the device. You should check if this address is in the DHCP address range. Perhaps the user turned off the dynamic and turned on the static IP, which is not part of DHCP, or the device is configured to automatically obtain an IP address and cannot for some reason contact the DHCP server.
If you need more complete information, use the ipconfig / all command. You will receive the same data, but in a more detailed form, with the description of the adapter brand, DHCP parameters, Link Local address, IP address, server lease validity period, default gateway address and so on.
If, as a result of checking this information, it turns out that everything is OK with the IP address and the interface settings are not the cause of the problem, you should use other diagnostic tools, for example NSLookup. This is a utility that allows you to access the DNS system through the command line. If this does not resolve the problem, use ping. I use the ping 8.8.8.8 command, that is, I ping Google’s public DNS. If the ping passes, then everything is in order with the connection and the reason should be sought elsewhere.
If ping fails, you need to use a tool called Trace Route, or tracert. This is a Windows command to trace the route to a given host. If you type tracert 8.8.8.8 on the command line, you will get ping with a value of TTL = 1 with a route trace of up to 30 nodes. As you can see, the first node is my router, the system showed its DD-WRT firmware and IP address 192.168.1.1, the second one is the server of my provider with the IP address 192.168.100.1, through which I go to the Internet, then pings on other nodes and reaches the Google server. In our case, it turned out 14 hopes, but if, for example, a problem arose on the side of my provider, then the trace will stop after the 3rd node characterizing the ISP server.
So, Trace Route is an excellent tool for identifying problems along the route of traffic.
Let's take a closer look at what NSLookup is. This is a command that talks about your DNS server. If you type nslookup, I get two lines: the default server is DD-WRT, that is, my router, and its address is 192.168.1.1. If I specify a specific DNS server with the server 8.8.8.8 command, the system will give me its description and IP address. This way you can check any given DNS server. In the same way, I can get data about a specific domain by typing, for example, www.cisco.com .
As you can see, Cisco uses two versions of the IP address, and if I type google.com, we will see many IP addresses used by this server. This is a huge service, which is accessed by so many people that one IP address may not be enough.
There is a joke that when people want to know if the Internet is working, they simply type google.com. In addition to PC users, owners of smartphones running Android are constantly accessing this service, so there is simply huge traffic passing through the servers of this company.
Thus, the nslookup command allows you to find out the IP address of a specific domain name. All the tools mentioned above do not fix the problems, but serve to diagnose them. The more you practice in the IT industry, the more effectively you will be able to use these tools, because only practice and experience can teach you to quickly diagnose and fix network problems. Practice will give you the opportunity to understand what the problem is, from a glance at the network settings console of the computer. Therefore, after we complete the study of the topic of ICND1, I will post practical laboratory work on the site so that you can apply the acquired knowledge of the theory.
Before I talk about the syslog, I want to talk about the Terminal Monitor command of the Cisco IOS operating system. I will go into the Packet Tracer program (if you have not already installed it, you can register with Network Academy and download this program), take two routers and connect them with a cable.
Then I will go into global configuration mode and take turns setting up these routers, giving them the names R0 and R1.
Next, in the R1 settings, I will enter the enable password enable command to set the password and configure the g0 / 0 interface using the ip add 10.1.1.2 255.255.255.0 and no shut commands. In the same way, I will configure the R0 router by assigning it the IP address 10.1.1.1. Then I activate the Telnet protocol with the line vty 0 4 command and set the password for entering Telnet with the login and password telnet commands. Next, I will go to the settings of R0 and use the telnet 10.1.1.2 command to establish a connection with the R2 router. After that, the system will ask for a password to establish a connection, and I will enter the word telnet, which I set as the password for R2. As you can see, after that, on the command line, the name of the router R0 changed to R1 - this means that I went through the router R0 to the settings of the router R1.
Now let's move on to the g0 / 1 interface and I will show you a couple of things. First, I use the no shut command for it. You see that a log message appeared in the CLI window of the second router, that the state of the g0 / 1 interface has changed to up.
Since I entered the R1 settings from the R0 router, it turned out that I had connected a regular laptop to the second router with a cable and controlled it remotely. However, this log message appeared only in the R1 window, because I was connected to the second router only via the Telnet channel and it was not duplicated in the CLI window of the first router. The fact is that if you remotely entered the settings of a device located, for example, in another building, by default the log messages of this device will not be displayed on your screen.
In order for these log messages to be displayed on the screen of your device, you must use the terminal monitor command. In fact, it means that if any event log messages appear on the screen of another device, they must be sent in the form of packets via the Telnet protocol to the IP address of your device. By default, log messages are not sent to the IP address, but after entering the terminal monitor command, this will begin to happen. If I now enter the shutdown command in the settings window of the R1 router, a log message about the change in the state of the interface will simultaneously appear on both screens.
Now I will go into the global settings mode R1 in the first window and start typing some command, for example, int g0 / 0. Suppose I managed to print only int g0 /, and at that moment some kind of log message appeared. My team will be torn by this message into two parts, so 0 will be on the next line, and the device may not understand it. This is especially inconvenient if I type a long command, or if the log messages consist of many lines, because I won’t know where to stop typing so that my team doesn’t get torn to pieces, or I can forget where I left off.
To prevent this, log synchronization is used. I type the line vty 0 4 command in the right window to go into Telnet settings, after which the command line header changes its appearance from R1 (config-if) to R1 (config-line). Then I enter the logging synchronous command and go back to the left window.
Now I repeat the same situation - type int g0 / and pause, during which the log message appears again. It also appears on both screens, but now its text does not break my command, and underneath it just repeats what I started typing. Now I can calmly continue to type the team I started, without fear that it will be split into pieces by the appearing logs. For me, as a user, this is very convenient, because you do not need to think about how to type a command faster, until suddenly an event log message appears. This is what the logging synchronous command does, or "synchronize logs".
Each of the log messages has a certain priority level, in our example it is level 5. The lower the value of the logging level, the more important the message. In total there are 8 priority levels of Cisco logs.
0 - emergency, the system is not fully operational,
1 - an alarming situation, urgent intervention is necessary,
2 - critical events, the system may fail,
3 - error messages,
4 - all kinds of warnings
5 - various important notifications,
6 - informational messages,
7 - debug messages.
The first three levels report dangerous conditions of the system, level 3 indicates problems in the system, the fourth level warns that the state of the system may become unstable, but it is still functioning. Level 5 notifies about various events, for example, about a change in the link state, as in our example. If you are using debug mode, level 7 debug messages will appear on the screen. If you are a busy person and do not want to read all the logs, you can choose which level of danger messages will be displayed on the screen.
For example, I want to see only log messages up to the 3rd level of danger. In this case, the system will only display messages of levels 0, 1, 2, and 3, ignoring messages of levels 4-7. By default, level 7 is set, so you will see the logs of all levels, from zero to seventh.
We looked at what Terminal monitor is, and now let's move on to Syslog. If important log messages appear on your screen, you might want to save them somehow on the Syslog server, because usually these messages are stored only in the router’s memory and you won’t be able to analyze them after some time.
Let's go back to Packet Tracer and add a server to the circuit, which is directly connected to the first router. In practice, the switch should be located between them, but we use this scheme for training purposes, so we can do without the switch. I go into the server’s network settings and assign it a static IP address 10.1.2.10, a subnet mask of 255.255.255.0 and a default gateway address of 10.1.2.1. This address does not exist yet, but I will configure it when I proceed to configure the interface of the R0 router.
Next, I’ll go to the settings of R0, use the g0 / 1 command and assign it the address 10.1.2.1 with a subnet mask of 255.255.255.0. Thus, the server and the router will be on the same network. Then I need to go into the settings of the second R1 router and configure the connection with the first router. You can configure a RIP or a static route, in this case I choose the latter.
To do this, I enter the ip route 0.0.0.0 0.0.0.0 10.1.1.1 command, that is, I indicate that all traffic is sent to the address 10.1.1.1. Then I enter do show ip route and see that the gateway of the last queue Gateway of last resort has the address 10.1.1.1 for the network 0.0.0.0.
Now I will check whether it is possible to ping the device at 10.1.2.10. If you remember, ping is a diagnostic tool for problems, and as you can see, ping was successful. Next, I turn on debug mode with the debug ip icmp command, this means that every time the router pings, a corresponding message will appear in the console window.
If I ping R1 from the left router R0 using the ping 10.1.1.2 command, log messages will appear in the CLI window of the right router, by default, priority level 7. I want any log messages that appear during the configuration process to be sent to the Syslog server. To do this, I go to the Services tab of the server settings panel and see that the Syslog parameter is enabled by default. Okay, now I have to tell R1: “every time a log message appears, please send it to the Syslog server at 10.1.2.10!”. To do this, I enter the logging 10.1.2.10 command. Now all log messages will be sent to the server. Let's see how this happens.
I enter the settings of R0 and again I ping the router R1. In the CLI window of the right server, debug message appears, which should be forwarded to the Syslog server. I go to the Syslog tab of the server and see that all these messages appeared there.
Thus, if any events occurred during the weekend, then having come to work on Monday, you will be able to view all the log messages in which these events are recorded. If you have any problems, then you can analyze what happened and apply measures to eliminate them.
However, if you look closely at the Syslog messages, you will see an error: they all have a time stamp on January 1 of zero hour. This means that I can’t find out when the recorded events really happened. This happened because the system clock of the R1 router shows the wrong time. If I enter the show clock command in the settings of this router, I will see the message 0: 26: 9.539 UTC Mon Mar 1 1993. This means that 26 minutes 9 seconds have passed since the router was turned on, and the default clock starts counting from March 1, 1993 of the year.
I can manually set the correct time and start doing it with R0 router. I enter the clock set command and then set the correct time in the format hh: mm: ss. After I enter 22:05:00, the system gives a hint for entering the day of the month from 1 to 31 and the name of the month. I am printing 14 MARCH and should now enter the year in the range from 1993 to 2035. As a result, I type in the line 22:05:00 on MARCH 14, 2017, after which I press Enter. If you now type show clock, the system will display the correct time.
You may ask why I set the time on the router R0, and not on R1. This is because I want to show you the automatic time setting of the second router. Next, I enter the debug ip icmp and logging 10.1.2.10 commands in the R0 settings so that the logs are sent to the Syslog server.
Then I disable the debugging of the R1 router with the un all command and ping the device 10.1.1.1. Ping is successful, and if you now look at the server’s logs, it’s clear that new messages have been added here, but for some reason again with the wrong time and zero date. This is strange, because the correct time is also shown in the settings of the R1 router. I again ping R0 router from R1 router, log messages appear on the screen and in the server log, but again with the wrong date. Probably the information has not yet been updated, and I will try to find out why.
I go to the settings of the R0 router and turn off the debug messages with the un all command, after which I go to the settings of the R1 router and enter the service timestamps command, which puts a time stamp on debug messages or log messages. In our case, I use service timestamps log datetime ms.
Then I go back to the settings of R0 and ping R1. Now you see that the messages appeared on the server with the date and time: March 1 00:31:02 with milliseconds. But this is the wrong date, since I set not March 1, but March 14! I apologize for making mistakes in this video tutorial, now I will fix them.
I will try to set the correct time in a different way. The fact is that until I activated the time stamp service, messages arrived with the default time and date. Then I turned on the timestamps service, but after that I did not set the correct time and date, which is why the time stamp in the log messages turned out to be incorrect.
The problem with manually setting the time is that if you have hundreds of devices, you need to go into the settings of each device and set the time and date. To avoid this, there is an automatic NTP mechanism, or network time protocol, which synchronizes computer time with the time of network devices. You can select one network device as NTP-master and set the desired time. Studying this protocol is beyond the scope of the CCNA course, and I’m not sure that the ntp master command is supported by Packet Tracer. But I’m still trying to set the right time, for which I’ll add another server to our network and assign it an NTP server.
To do this, I will go into its settings and check the NTP tab. As you can see, the correct date and time are set here and the NTP function is enabled.
Then I go into the network settings of Server1 and assign it an IP address 10.1.3.10, a subnet mask of 255.255.255.0 and a default gateway of 10.1.3.1. As I mentioned earlier, this gateway is not configured, so I go into the settings of the R1 router and configure the g0 / 1 interface to communicate with the server by entering the ip add 10.1.3.1 255.255.255.0 and no shut commands.
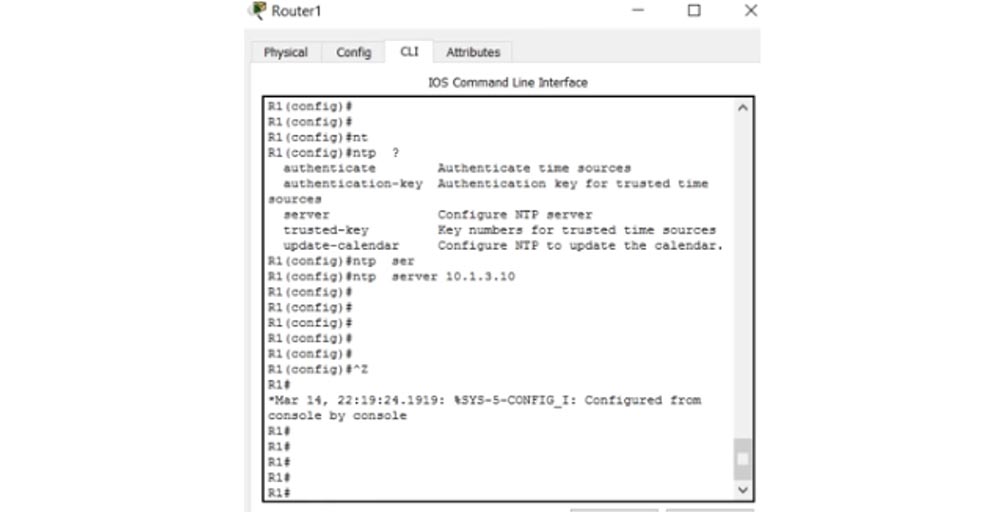
Further, in the settings of the router, I enter the ntp server 10.1.3.10 command, after which the R1 router will be able to receive the correct time from the NTP server. As you can see, now we have level 5 log messages with the correct time stamp.
show clock, , . ntp association, , Packet Tracer, ntp.
ntp status , . , Stratum 2 – , NTP-, R2 , 1. , R1, stratum 3 (NTP- + R1 + ), R1 NTP- 2. , .
R0 R1 10.1.1.2, , Server0 , .
, NTP Syslog. – CDP, Cisco Discovery Protocol. .
, , , , . Cisco, , , IP-. , LLDP, Link Layer Discovery Protocol, , CDP, .
CDP Cisco . LLDP, Cisco . , LLDP, Cisco, CDP.
, , Packet Tracer. , , CDP , Server0 R0. , , .
CLI R0 show cdp. , cdp- 60 , 180 , – CDPv2.
CDP , , , . 60 . show cdp neighbors, , R0 CDP-.
, R0 – R1 . R1 R 1900 R0 g0/0, g0/0 R0.
, show cdp neighbors , , , . , .
R0 – 2960, g0/1. , , , , , Capability, : R – , S – , H- .. R0 FastEthernet 0/1.
, CDP . , , – CDP . , , . CDP? config t cdp run. , cdp . cdp no cdp run. , cdp, show cdp – , CDP is not enable.
, cdp , . , , cdp cdp run, , , int g0/1, cdp enable, , no cdp enable, . no cdp enable cdp , . , / cdp run, – enable.
show cdp neighbors, , R0 – R1. cdp g0/1, «».
LLDP , CDP, lldp run/no lldp run. , Cisco CDP , LLDP – . LLDP , , g0/1, lldp receive, , lldp transmit, LLDP -.
, no lldp receive, – no lldp transmit. CDP LLDP , , – , LLDP -.
Thank you for staying with us. Do you like our articles? Want to see more interesting materials? Support us by placing an order or recommending it to your friends, a 30% discount for Habr users on a unique analogue of entry-level servers that was invented by us for you: The whole truth about VPS (KVM) E5-2650 v4 (6 Cores) 10GB DDR4 240GB SSD 1Gbps from $ 20 or how to divide the server? (options are available with RAID1 and RAID10, up to 24 cores and up to 40GB DDR4).
Dell R730xd 2 times cheaper? Only we have 2 x Intel TetraDeca-Core Xeon 2x E5-2697v3 2.6GHz 14C 64GB DDR4 4x960GB SSD 1Gbps 100 TV from $ 199 in the Netherlands! Dell R420 - 2x E5-2430 2.2Ghz 6C 128GB DDR3 2x960GB SSD 1Gbps 100TB - from $ 99! Read about How to Build Infrastructure Bldg. class c using Dell R730xd E5-2650 v4 servers costing 9,000 euros for a penny?
All Articles