We continue our series of articles on forensics from Check Point. In a previous article, we looked at a new network sandbox report that helps catch 0-day attacks on the network perimeter. Unfortunately (for “security guards”), the perimeter has long lost clear boundaries. Mobile devices, BYOD, flash drives, cloud services - all this creates additional “holes” in protecting the corporate network. That is why forensics is important not only on the perimeter, but also on the workstations of your users. This forensic is even more important, because You will explore malware that has already penetrated your network. I want to understand what channel they penetrated through (the Internet, the “USB flash drive”, file exchanger, email, corporate chat), the vulnerability in which software they used, what data could be damaged, etc. This and much more allows you to see the Check Point SandBlast Agent . It will be discussed.
Sandblast agent
A long time ago we published a video tutorial on SandBlast Agent . Also for version R77.30. Since then, much has changed, but the concept has remained the same. Modern SandBlast Agent includes the following modules:
Endpoint Threat Prevention features:
- Endpoint Threat Emulation and Extraction - allows you to scan files in the sandbox (local or cloud);
- Zero-Phishing - user protection against phishing;
- Anti-Ransomware - protection against ransomware with the ability to back up files;
- Endpoint Anti-Bot - helps to determine if the PC is a member of the botnet network, and block this process;
- Anti-Exploit - defines malware at the stage of exploitation of vulnerabilities;
- Behavioral Guard - Behavioral Analysis;
- Endpoint Anti-Virus - a classic signature antivirus;
- Forensic collection and automated reports - forensics and report generation.
Endpoint Access Control Features (here I think everything is clear and without comment):
- Endpoint Firewall, Application Control, Port Protection
- Endpoint Compliance, Remote Access VPN
The agent can run on Windows and MacOS. For centralized management, the EndPoint Management Server (both on-premises and cloud) is used. With your permission, we will not consider in detail all the announced functions. Perhaps in the near future we will publish a whole course on SandBlast Agent. In this article, we will focus on the function of forensics.
Forensic collection and automated reports
The forensic blade indicated above allows you to generate incredibly detailed reports on security incidents at workstations. To do something like this manually is almost impossible. At a minimum, you need to be an expert on forensics, be able to work with specialized software, understand the basics of creating viruses, and very well (to put it mildly) understand the features of operating systems - Windows, MacOS. On the other hand, if you know all this, then this is very cool and you probably have a “good” salary. In the case of the SandBlast Agent, the forensic report is automatically generated after each incident, providing comprehensive information about exactly what happened:

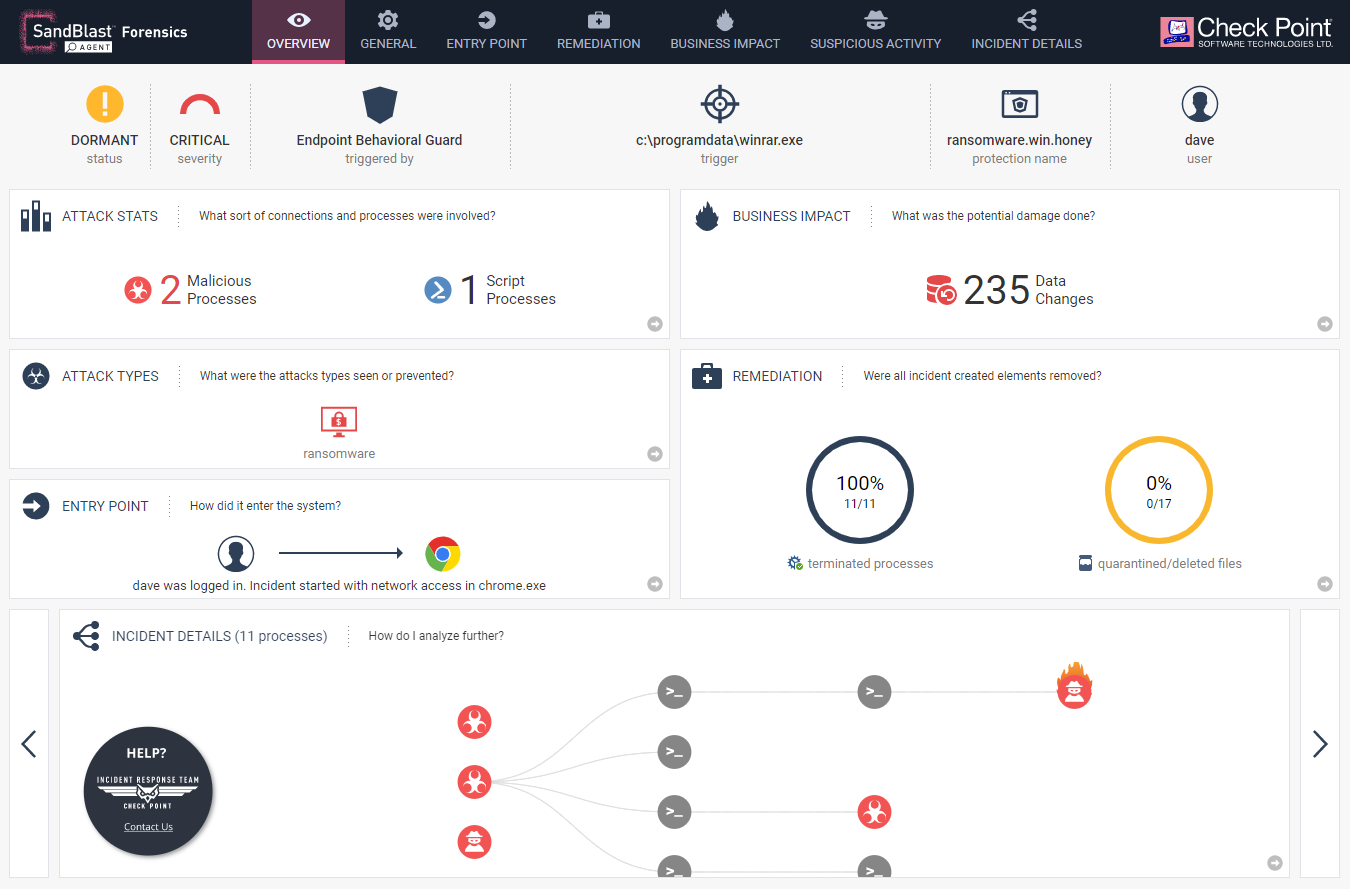
Here is a report on the malware - CTB-Faker Ransomware . You can open an example of this report. I highly recommend opening and familiarizing yourself. As you can see, it is an interactive HTML page where absolutely all elements are “clickable”. Here are some more examples of forensics for known malware:
At the top of each report, you can see 7 dashboard tabs:
1. Overview
General and most important incident data. The picture above is an example of Overview. In the same dashboard, you can change the Incedent Details view to MITER ATT & CK:

2. General
Here you can see what type of viruses our malware belongs to, what process was the trigger, and what is the importance of the event (severity):

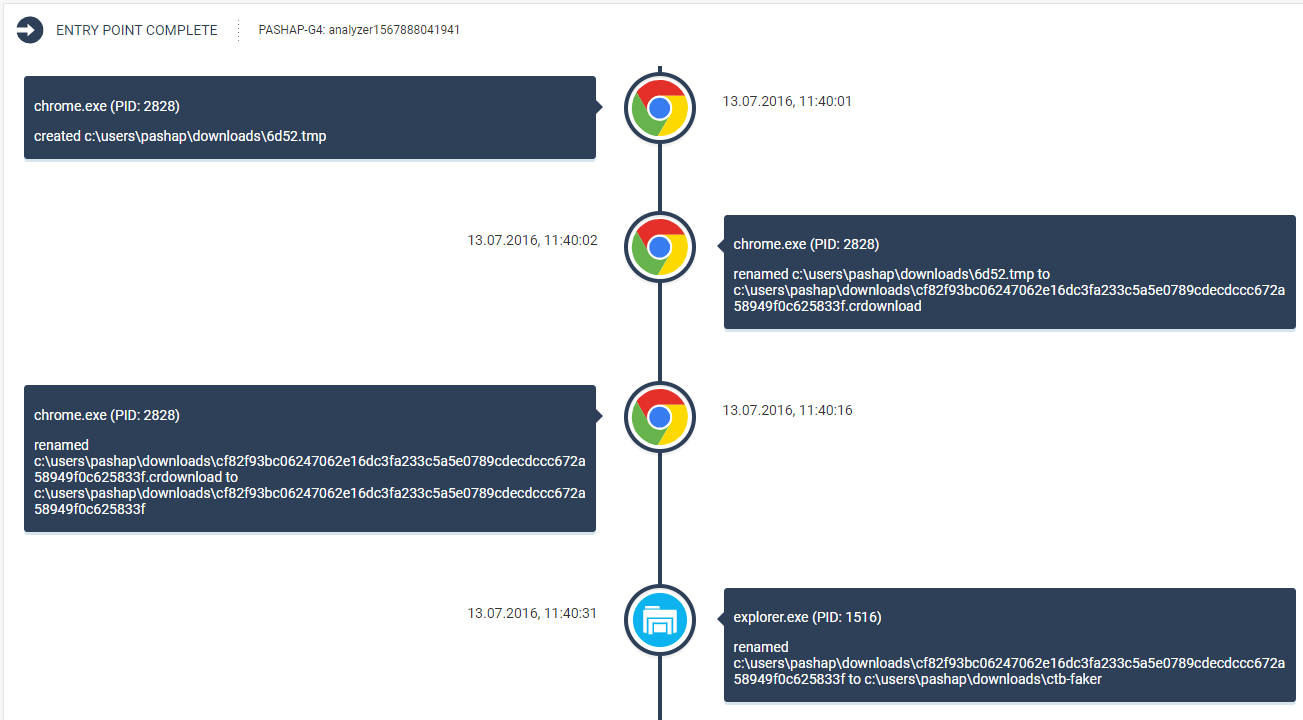
3. Entry Point
Here you can see where the attack began. In our case, everything is quite simple (downloaded the file via chrome):

But there are times more interesting.
4. Remediation
Here you can see what SandBlast Agent did by detecting the virus. Terminated processes, recovered files (especially relevant when encryptors are detected), etc.

5. Business Impact
Here you can see which assets were affected by the attack:

6. Suspicious Activity
You can familiarize yourself in detail with what Check Point considered suspicious in the activity of this virus. Pretty comprehensive information to help investigate incidents:

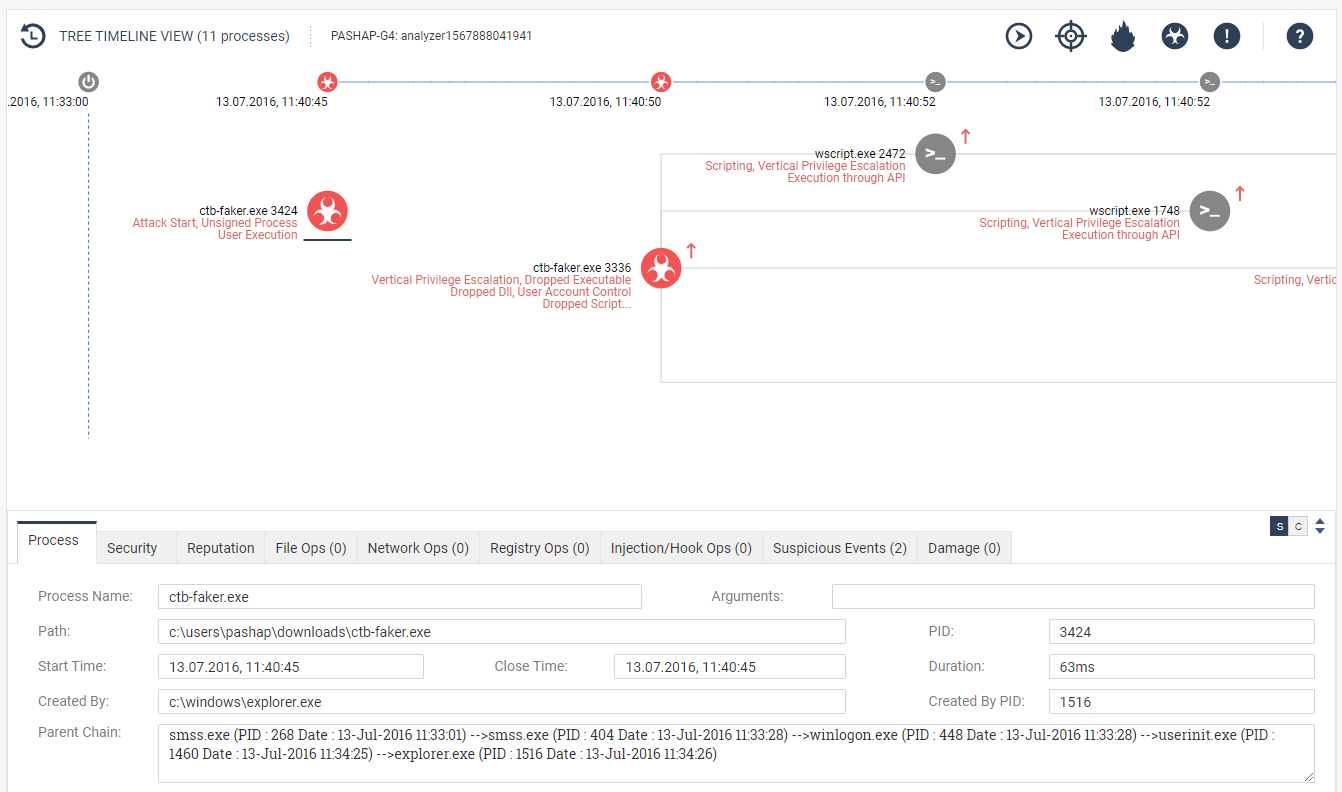
7. Incident Details
One of the most interesting dashboards. Allows you to see the development of events on the timeline with detailed information for each step. What process was created, at what stage, what exactly did he do, etc .:

Conclusion
Check Point, unlike many vendors, in this case focuses not only on prevent, but also on the most detailed explanation of the nature of the caught malware. Forensics shows such interesting and useful results that we (and the vendor himself) use the SandBlast agent to study various virus instances that customers can send us for analysis. You run the file in a virtual machine (preferably on a physical one) with the SandBlast agent and see what it does. Check Point itself often publishes reports specifically from the SandBlast agent when describing new types of detected viruses.
Moreover, it is possible to force manually launch forensics on a file, even if it is not virus and see all its activity with the registry, file system, network connections, processes, etc. Another interesting feature, which appeared recently, is the ability to transfer all the collected virus data to a third-party SIEM system in RAW format. But this is most likely true for owners of SOCs.
In the following articles, we will similarly look at SnadBlast Mobile reports, as well as CloudGiard SaaS. So stay tuned ( Telegram , Facebook , VK , TS Solution Blog )!