This is the first post in a three-part series that will give an idea of the mechanics and semantics that underlie Go's scheduler. This post is about the operating system planner. Let's get started!
Go's internal scheduler architecture allows your multi-threaded programs to be more efficient and productive. It is important to have a common understanding of how OS and Go schedulers work for the proper design of multithreaded software. I will describe enough details so that you can visualize how everything works in order to make better decisions in practice.
OS Scheduler
Operating system schedulers are sophisticated software. They must consider the location and configuration of the equipment on which they operate. This includes, but is not limited to, having multiple processors and cores, CPU caches, and NUMA . Without this knowledge, the planner cannot be as effective as possible.
Your program is simply a set of machine instructions that must be executed sequentially one after another. For this to happen, the operating system uses the concept of flow. The task of the stream is to record and sequentially execute the set of instructions assigned to it. Execution continues until there are no more instructions for execution by the thread. That is why I call the flow, the "path of fulfillment."
Each program that you run creates a process, and each process an initial thread. Threads have the ability to create more threads. All of these different threads work independently of each other, and scheduling decisions are made at the thread level, not the process level. Streams can work simultaneously (each in turn on a separate core) or in parallel (each works simultaneously on different cores). Streams also maintain their own state to ensure that their instructions are executed safely, locally and independently.
The OS scheduler is responsible for ensuring that the kernels are not idle if there are threads that can run. This should also create the illusion that all threads that can be executed are running simultaneously. In the process of creating this illusion, the scheduler must start threads with a higher priority than threads with a lower priority. However, threads with lower priority cannot be deprived of runtime. The planner also needs to minimize planning delays by making quick and smart decisions.
To better understand all this, it is useful to describe and define several important concepts.
Follow the instructions
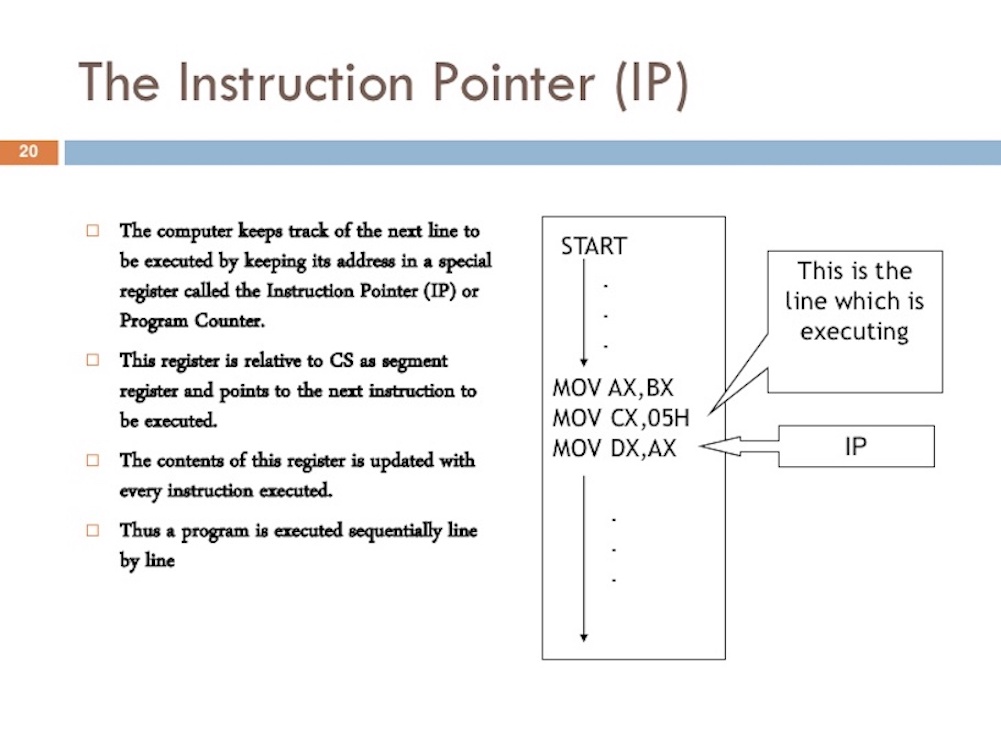
The instruction counter , also (instruction pointer) (IP), allows the thread to track the next command to execute. On most processors, IP points to the next instruction, not the current one.

If you've ever seen a stack trace from a Go program, you might notice these little hexadecimal numbers at the end of each line. See + 0x39 and + 0x72 in listing 1.
Listing 1
goroutine 1 [running]: main.example(0xc000042748, 0x2, 0x4, 0x106abae, 0x5, 0xa) stack_trace/example1/example1.go:13 +0x39 <- main.main() stack_trace/example1/example1.go:8 +0x72 <-
These numbers represent the offset of the IP value from the top of the corresponding function. The offset value + 0x39 for IP represents the following instruction that the thread would execute inside the example function if the program did not panic. The IP offset value 0 + x72 is the next instruction inside the main function if control returns to this function. More importantly, the instruction in front of the pointer tells you which instruction was executed.
Look at the program below in Listing 2, which caused the stack trace from Listing 1.
Listing 2
// https://github.com/ardanlabs/gotraining/blob/master/topics/go/profiling/stack_trace/example1/example1.go 07 func main() { 08 example(make([]string, 2, 4), "hello", 10) 09 } 12 func example(slice []string, str string, i int) { 13 panic("Want stack trace") 14 }
The hexadecimal number + 0x39 represents the IP offset for the instruction inside the example function, which is 57 (base 10) bytes below the initial instruction for the function. In Listing 3 below, you can see the objdump example of a function from a binary file. Find the 12th instruction that is listed below. Pay attention to the line of code above this instruction - a panic call.
Listing 3
func example(slice []string, str string, i int) { 0x104dfa 065488b0c2530000000 MOVQ GS:0x30, CX 0x104dfa9 483b6110 CMPQ 0x10(CX), SP 0x104dfad 762c JBE 0x104dfdb 0x104dfaf 4883ec18 SUBQ $0x18, SP 0x104dfb3 48896c2410 MOVQ BP, 0x10(SP) 0x104dfb8 488d6c2410 LEAQ 0x10(SP), BP panic("Want stack trace") 0x104dfbd 488d059ca20000 LEAQ runtime.types+41504(SB), AX 0x104dfc4 48890424 MOVQ AX, 0(SP) 0x104dfc8 488d05a1870200 LEAQ main.statictmp_0(SB), AX 0x104dfcf 4889442408 MOVQ AX, 0x8(SP) 0x104dfd4 e8c735fdff CALL runtime.gopanic(SB) 0x104dfd9 0f0b UD2 <--- IP(+0x39)
Remember: IP indicates the next instruction, not the current one. Listing 3 shows a good example of the amd64-based instructions that the thread for this Go program executes sequentially.
Stream states
Another important concept is the state of the flow. A thread can be in one of three states: Waiting, Ready, or Running.
Pending : This means that the thread has stopped and is waiting for something to continue. This can happen for reasons such as waiting for hardware (disk, network), operating system (system calls), or synchronization calls (atomic, mutexes). These types of delays are the main cause of poor performance.
Availability : This means that the thread takes time on the kernel so that it can execute the machine instructions assigned to it. If you have many threads that need time, the threads must wait longer to get the time. In addition, the individual amount of time that each thread receives is reduced because more threads compete for time. This type of scheduling delay can also cause poor performance.
Execution : This means that the thread is located on the kernel and executes its machine instructions.
Types of work
A thread can perform two types of work. The first is called CPU-Bound, and the second is IO-Bound.
CPU-Bound: this is a job that never creates a situation where a thread can be put into a standby state. This is a job that constantly makes calculations. A thread calculating the number Pi to the Nth digit will be tied to the CPU.
IO-Bound: This is a job that causes threads to transition to the idle state. This is a job that involves requesting access to a resource over a network or making system calls in the operating system. A thread that needs access to the database will be IO-Bound. I would include synchronization events (mutex, atomic) that make the thread wait as part of this category.
Context switch
If you work on Linux, Mac, or Windows, you work on the operating system with a preemptive scheduler.
Non-preemptive algorithms are based on the fact that an active thread is allowed to execute until it, on its own initiative, takes control of the operating system so that it selects another thread ready for execution from the queue.This means a few important things.
Preemptive algorithms are methods for scheduling threads in which the decision to switch the processor from executing one thread to executing another thread is made by the operating system rather than the active task.
Firstly, this means that the scheduler is unpredictable when it comes to which threads will be selected to run at any given time. Stream priorities along with events (for example, receiving data on the network) make it impossible to determine what the scheduler will choose and when.
Secondly, this means that you should never write code based on some supposed behavior that you are lucky to experience, but is not guaranteed to happen every time. It’s easy to afford to think, because I saw how it happened 1000 times, this is guaranteed behavior. You must control the timing and orchestration of threads if you need determinism in your application.
The process of terminating the execution of one task by the processor with saving all the necessary information and the state necessary for subsequent continuation from the interrupted place, and restoring and loading the state of the task to which the processor proceeds, is called context switching (PC). A PC occurs when the scheduler takes a thread of execution from the kernel and replaces it with a thread from the ready state. The thread selected from the execution queue goes into the "Run" state. A thread that has been retrieved can return to a ready state (if it still has the ability to start) or to a wait state (if it was replaced due to the IO-Bound request type).
PC is considered an expensive operation. The amount of delay that occurs during a PC depends on various factors, but it is reasonable that it takes from ~ 1000 to ~ 1500 nanoseconds. Given that the hardware should be able to intelligently execute (on average) 12 instructions per nanosecond per core, context switching can cost from ~ 12k to ~ 18k delay instructions. Essentially, your program loses its ability to execute a large number of instructions during context switching.
If you have a program focused on work related to IO, then context switching will be an advantage. As soon as a thread goes into a wait state, another thread in a ready state takes its place. This allows the kernel to always do the work. This is one of the most important aspects of planning. Do not let the kernel stay idle if there is work (threads are in the Ready state).
If your program is CPU-oriented, context switching will become a performance nightmare. Since a thread always has work, context switching stops this work. This situation contrasts sharply with what is happening with the IO-Bound load.
Less - more
Previously, when processors had only one core, scheduling was not too complicated. Since you had one processor with one core, only one thread could execute at any given time. The idea was to determine the period of the scheduler and try to execute all threads in a ready state during this period of time. No problem: take a planning period and divide it by the number of threads that need to be completed.
For example, if you define your scheduler period to be 10 ms (milliseconds), and you have 2 threads, then each thread receives 5 ms each. If you have 5 threads, each thread gets 2 ms. However, what happens when you have 100 threads? Providing each thread with a time span of 10 μs (microseconds) does not work, because you will spend a significant amount of time on the PC.
What you need is to limit how short time slices can be. In the last scenario, if the minimum time interval was 2 ms, and you have 100 threads, the scheduler period must be increased to 2000 ms or 2 seconds. What if there were 1000 threads, now you are looking at the scheduler period of 20 seconds. In this simple example, all threads start once for 20 seconds if each thread uses its own time interval.
Keep in mind that this is a very simple look at these problems. The planner must take into account more problems. You control the number of threads that you use in your application. When you need to consider more threads and work related to IO occurs, even more chaos and non-deterministic behavior occurs. Problem solving takes longer to plan and execute.
That’s why the “Less is more” rule. Fewer threads in the Ready state means less scheduling costs and more time that each thread receives over time. The more threads in the Ready state, the less time each thread receives. This means that less of your work will be done over time.
Looking for balance
You need to find a balance between the number of cores that you have and the number of threads that you need to achieve maximum throughput for your application. When it comes to managing this balance, thread pools were a great answer. I will show you in the second part that Go is no longer necessary. I think this is one of the nice things Go has done to facilitate the development of multi-threaded applications.
Before writing code in Go, I wrote code in C ++ and C # for NT. On this operating system, using IOCP Completion Ports (IOCPs) was critical for writing multi-threaded software. As an engineer, you had to figure out how many thread pools you needed, and the maximum number of threads for any given pool, in order to maximize throughput for the number of cores you have.
When writing web services interacting with a database, the magic number of 3 threads per core always provided the best throughput in NT. In other words, 3 threads per core minimized the time spent switching contexts, maximizing runtime on the cores. When I created the IOCP thread pool, I knew that I needed to start with a minimum of 1 thread and a maximum of 3 threads for each core identified on the host computer.
If I used 2 threads per core, it would take more time to do all the work, because I had a simple one when I could do the work. If I used 4 threads per core, it also took longer because I had more delays on the PC. The balance of 3 threads per core for any reason always seemed like a magic number in NT.
What if your service performs many different types of tasks? This can create different and conflicting delays. Perhaps it also creates many different system events that need to be handled. It may not be possible to find a magic number that works all the time for all the different workloads. When it comes to using thread pools to tune service performance, it is very difficult to find the right consistent configuration.
Processor cache
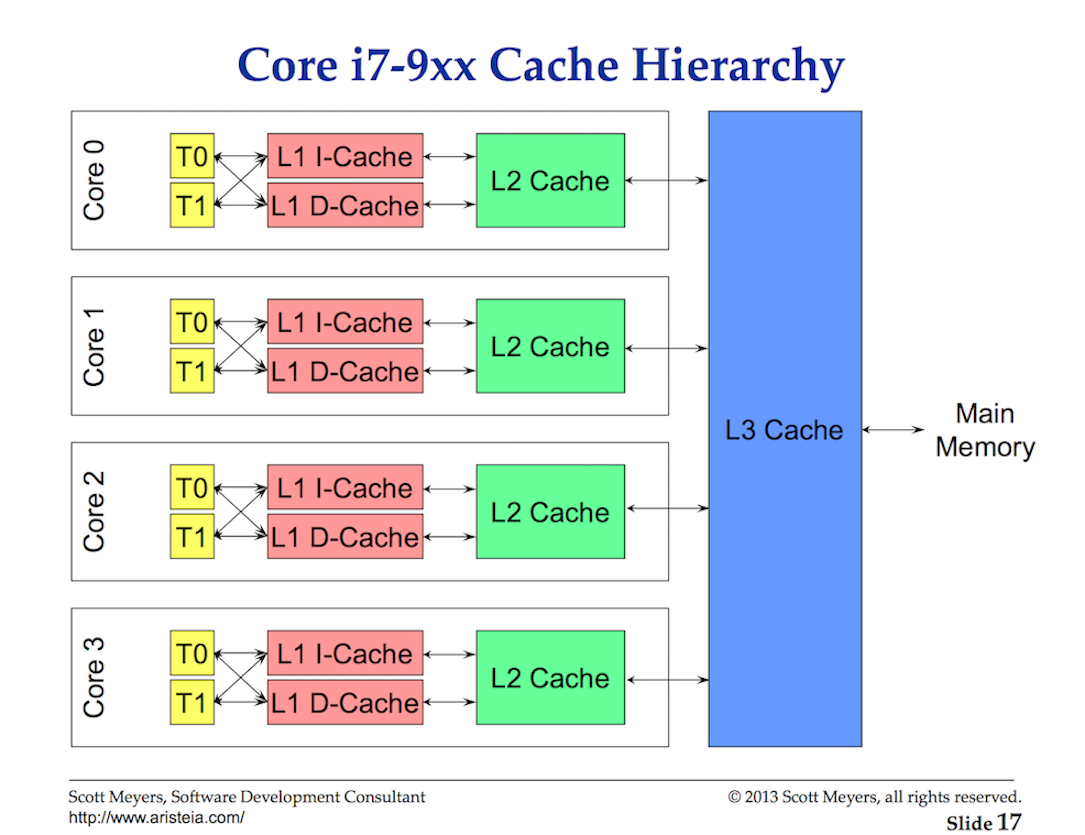
Access to data from the main memory has such a high delay cost (from ~ 100 to ~ 300 clock cycles) that processors and cores have local caches for storing data close to the hardware flows that need them. Accessing data from the cache is much cheaper (from 3 to 40 cycles) depending on access to the cache. Today, one aspect of performance is how efficiently you can transfer data to the processor to reduce these data access delays. When writing multi-threaded applications that change state, you need to consider the mechanics of the cache system.

Data is exchanged between the processor and main memory using cache lines. A cache line is a 64-byte piece of memory that is exchanged between the main memory and the caching system. Each core gets its own copy of any cache line that it needs, which means that the hardware uses value semantics. This is why mutations in memory in multi-threaded applications can create performance nightmares.
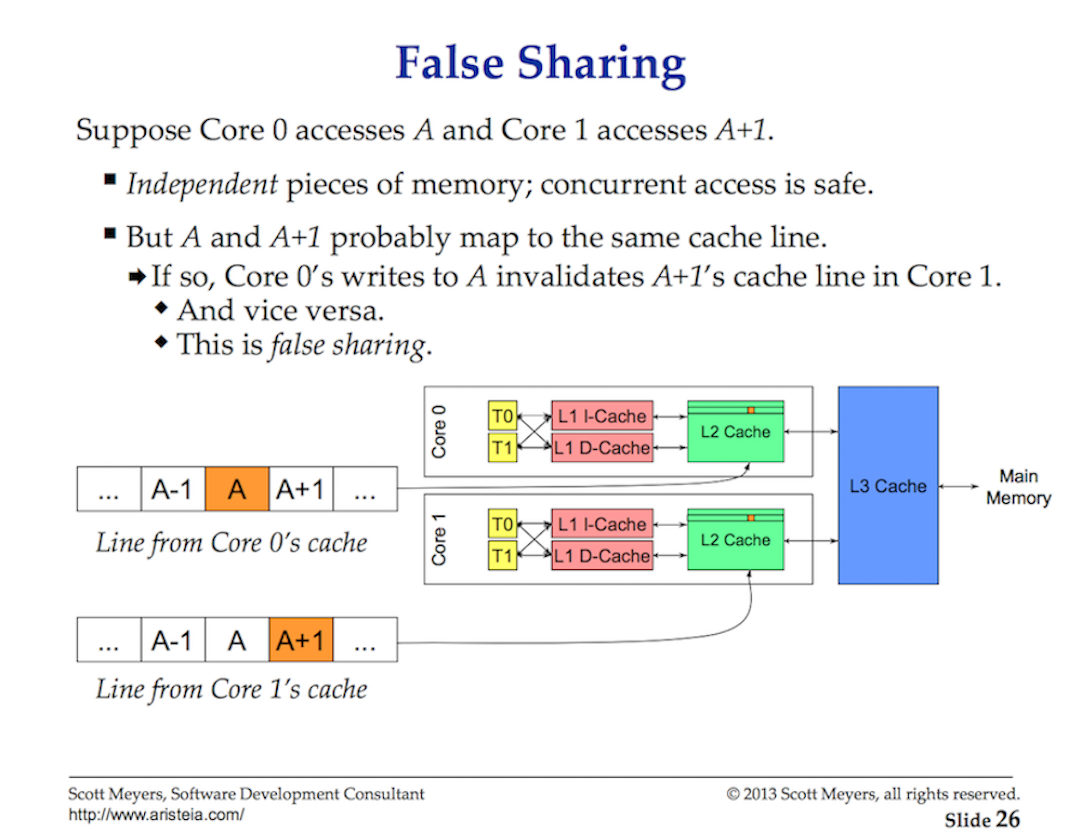
When multiple threads running in parallel access the same data value or even data values next to each other, they will access the data in the same cache line. Any thread running on any core will receive a copy of the same cache line.

If one thread in a given kernel makes changes to its copy of the cache line, then with the help of hardware, all other copies of the same cache line should be marked as dirty. When a Thread tries to read or write access to a dirty cache line, access to main memory (from ~ 100 to ~ 300 clock cycles) is necessary to obtain a new copy of the cache line.
Maybe on a 2-core processor this does not matter much, but what about a 32-core processor, on which 32 threads work in parallel, all receive and change data in one cache line? What about a system with two physical processors with 16 cores in each? This will be worse due to the additional delay for communication between processors. The application will iterate over memory, and the performance will be terrible, and most likely you will not understand why.
This is called a cache coherence issue, and also leads to issues such as false sharing. When writing multi-threaded applications that will change the general state, caching systems should be taken into account.
Total
This first part of the post gives you an idea of what you should consider regarding threads and the OS scheduler when writing multi-threaded applications. These things are taken into account by the Go scheduler. In the next post, I will describe the semantics of the Go scheduler and how they relate to this information. Then, finally, you will see all this in action, running a couple of programs.