I am from Luxoft. This article will discuss the nginx-clickhouse project , which will read nginx logs and send them to clickhouse. To view analytics by logs, there is a dashboard for Grafana.
Install nginx, clickhouse, grafana in the standard way.
All packages are installed on the same server.
Nginx-clickhouse page on github
Install rpm package nginx-clickhouse
yum -y install yum-plugin-copr yum copr enable antonpatsev/nginx-clickhouse-rpm yum -y install nginx-clickhouse systemctl start nginx-clickhouse
As an emulator of the HTTP service we use mockify.
Install the rpm mockify package
yum -y install yum-plugin-copr yum copr enable antonpatsev/mockify-rpm yum -y install mockify systemctl start mockify
The nginx-clickhouse log_format has the following form.
log_format main '$remote_addr - $remote_user [$time_local] "$request" $status $bytes_sent "$http_referer" "$http_user_agent"';
General nginx config:
user nginx; worker_processes auto; worker_rlimit_nofile 40960; error_log /var/log/nginx/error.log warn; pid /var/run/nginx.pid; events { use epoll; worker_connections 1024; multi_accept on; } http { include /etc/nginx/mime.types; default_type application/octet-stream; log_format main '$remote_addr - $remote_user [$time_local] "$request" $status $bytes_sent "$http_referer" "$http_user_agent"'; access_log /var/log/nginx/access.log main; sendfile on; tcp_nodelay on; tcp_nopush on; keepalive_timeout 65; include /etc/nginx/conf.d/*.conf; open_file_cache max=200000 inactive=20s; open_file_cache_valid 30s; open_file_cache_min_uses 2; open_file_cache_errors on; }
Virtual host configs:
vhost1.conf:
server { listen 80; server_name vhost1; location / { proxy_pass http://127.0.0.1:8001/200; } }
vhost2.conf:
server { listen 80; server_name vhost2; location / { proxy_pass http://127.0.0.1:8001/200; } }
vhost3.conf:
server { listen 80; server_name vhost3; location / { proxy_pass http://localhost:8001/304; } }
vhost4.conf:
server { listen 80; server_name vhost4; location / { proxy_pass http://localhost:8001/401; } }
vhost5.conf:
server { listen 80; server_name vhost5; location / { proxy_pass http://localhost:8001/500; } }
Add virtual hosts to the hosts file:
cat /etc/hosts 127.0.0.1 vhost1 127.0.0.1 vhost2 127.0.0.1 vhost3 127.0.0.1 vhost4 127.0.0.1 vhost5
The nginx-clickhouse config defaults to
/etc/nginx-clickhouse/config/config.yml
The path to the log can be changed in the config in the parameter: log_path:
In clickhouse you need to create a metrics database:
create database metrics
And you need to create a nginx table:
CREATE TABLE metrics.nginx ( RemoteAddr String, RemoteUser String, TimeLocal DateTime, Date Date DEFAULT toDate(TimeLocal), Request String, RequestMethod String, Status Int32, BytesSent Int64, HttpReferer String, HttpUserAgent String, RequestTime Float32, UpstreamConnectTime Float32, UpstreamHeaderTime Float32, UpstreamResponseTime Float32, Https FixedString(2), ConnectionsWaiting Int64, ConnectionsActive Int64 ) ENGINE = MergeTree(Date, (Status, Date), 8192)
In Grafana, when creating a datasource for Clickhouse, name it ClickHouse Main Server
, because in the original dashboard for Grafana, that's what he is called.
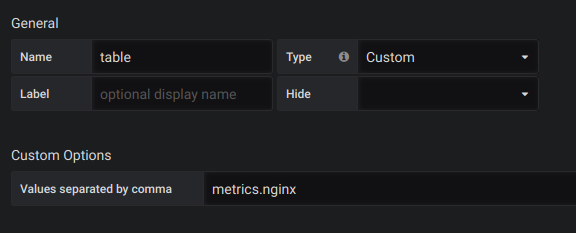
You also need to create a table variable with the contents of metrics.nginx
.
On the official Grafana website you will not find a dashboard. It is in this closed issue :
Here is my slightly corrected dashboard:
{ "editable": true, "gnetId": null, "graphTooltip": 0, "hideControls": false, "id": 1, "links": [], "refresh": false, "rows": [ { "collapse": false, "height": "250px", "panels": [ { "aliasColors": {}, "bars": false, "dashLength": 10, "dashes": false, "datasource": "ClickHouse Main Server", "fill": 1, "id": 1, "legend": { "avg": true, "current": true, "max": true, "min": true, "show": true, "total": false, "values": true }, "lines": true, "linewidth": 1, "links": [], "nullPointMode": "null", "percentage": false, "pointradius": 5, "points": false, "renderer": "flot", "seriesOverrides": [], "spaceLength": 10, "span": 12, "stack": false, "steppedLine": false, "targets": [ { "database": "metrics", "dateColDataType": "Date", "dateLoading": false, "dateTimeColDataType": "TimeLocal", "datetimeLoading": false, "formattedQuery": "<font color=\"darkcyan\">$columns</font>(Status, <font color=\"navajowhite\">count</font>(<font color=\"yellow\">*</font>) <font color=\"darkorange\">as</font> c) <font color=\"darkorange\">from</font> metrics<font color=\"yellow\">.</font>nginx_streaming", "hide": false, "interval": "15s", "intervalFactor": 1, "query": "$columns(Status, count(*) as c) from metrics.nginx", "rawQuery": "SELECT t, groupArray((Status, c)) as groupArr FROM ( SELECT (intDiv(toUInt32(TimeLocal), 15) * 15) * 1000 as t, Status, count(*) as c from metrics.nginx WHERE Date >= toDate(1539358595) AND TimeLocal >= toDateTime(1539358595) GROUP BY t, Status ORDER BY t) GROUP BY t ORDER BY t", "refId": "A", "resultFormat": "time_series", "table": "nginx_streaming", "tableLoading": false } ], "thresholds": [], "timeFrom": null, "timeShift": null, "title": "Streaming API Requests & Response", "tooltip": { "shared": true, "sort": 0, "value_type": "individual" }, "type": "graph", "xaxis": { "buckets": null, "mode": "time", "name": null, "show": true, "values": [] }, "yaxes": [ { "decimals": null, "format": "short", "label": "Requests", "logBase": 1, "max": null, "min": null, "show": true }, { "format": "short", "label": "", "logBase": 1, "max": null, "min": null, "show": true } ] } ], "repeat": null, "repeatIteration": null, "repeatRowId": null, "showTitle": false, "title": "Dashboard Row", "titleSize": "h6" }, { "collapse": false, "height": 399, "panels": [ { "columns": [], "datasource": "ClickHouse Main Server", "fontSize": "100%", "id": 2, "links": [], "pageSize": null, "scroll": true, "showHeader": true, "sort": { "col": 0, "desc": true }, "span": 6, "styles": [ { "alias": "Time", "dateFormat": "YYYY-MM-DD HH:mm:ss", "pattern": "Time", "type": "date" }, { "alias": "", "colorMode": null, "colors": [ "rgba(245, 54, 54, 0.9)", "rgba(237, 129, 40, 0.89)", "rgba(50, 172, 45, 0.97)" ], "decimals": 2, "pattern": "/.*/", "thresholds": [], "type": "number", "unit": "short" } ], "targets": [ { "database": "metrics", "dateColDataType": "Date", "dateLoading": false, "dateTimeColDataType": "TimeLocal", "datetimeLoading": false, "formattedQuery": "<font color=\"darkcyan\">$columns</font>(Status, <font color=\"navajowhite\">count</font>(<font color=\"yellow\">*</font>) <font color=\"darkorange\">as</font> c) <font color=\"darkorange\">from</font> metrics<font color=\"yellow\">.</font>nginx_streaming", "hide": false, "interval": "3600s", "intervalFactor": 1, "query": "$columns(Status, count(*) as c) from metrics.nginx", "rawQuery": "SELECT t, groupArray((Status, c)) as groupArr FROM ( SELECT (intDiv(toUInt32(TimeLocal), 3600) * 3600) * 1000 as t, Status, count(*) as c from metrics.nginx WHERE Date >= toDate(1539358595) AND TimeLocal >= toDateTime(1539358595) GROUP BY t, Status ORDER BY t) GROUP BY t ORDER BY t", "refId": "A", "resultFormat": "time_series", "table": "nginx_streaming", "tableLoading": false } ], "title": "Requests Stats Table", "transform": "timeseries_to_columns", "type": "table" }, { "aliasColors": {}, "bars": false, "dashLength": 10, "dashes": false, "datasource": "ClickHouse Main Server", "fill": 1, "id": 3, "legend": { "avg": false, "current": false, "max": false, "min": false, "show": true, "total": false, "values": false }, "lines": true, "linewidth": 1, "links": [], "nullPointMode": "null", "percentage": false, "pointradius": 5, "points": false, "renderer": "flot", "seriesOverrides": [], "spaceLength": 10, "span": 6, "stack": false, "steppedLine": false, "targets": [ { "database": "metrics", "dateColDataType": "Date", "dateLoading": false, "dateTimeColDataType": "TimeLocal", "datetimeLoading": false, "formattedQuery": "<font color=\"darkcyan\">$rate</font>(<font color=\"navajowhite\">avg</font>(RequestTime) <font color=\"darkorange\">as</font> RequestTime) <font color=\"darkorange\">FROM</font> metrics<font color=\"yellow\">.</font>nginx_streaming", "hide": false, "intervalFactor": 1, "query": "$rate(avg(RequestTime) as RequestTime) FROM metrics.nginx", "rawQuery": "SELECT t, RequestTime/runningDifference(t/1000) RequestTimeRate FROM ( SELECT (intDiv(toUInt32(TimeLocal), 120) * 120) * 1000 as t, avg(RequestTime) as RequestTime FROM metrics.nginx WHERE Date >= toDate(1539358595) AND TimeLocal >= toDateTime(1539358595) GROUP BY t ORDER BY t)", "refId": "A", "resultFormat": "time_series", "table": "nginx_streaming", "tableLoading": false }, { "database": "metrics", "dateColDataType": "Date", "dateLoading": false, "dateTimeColDataType": "TimeLocal", "datetimeLoading": false, "formattedQuery": "<font color=\"darkcyan\">$rate</font>(<font color=\"navajowhite\">avg</font>(UpstreamResponseTime) <font color=\"darkorange\">as</font> UpstreamResponseTime) <font color=\"darkorange\">FROM</font> metrics<font color=\"yellow\">.</font>nginx_streaming", "hide": false, "intervalFactor": 1, "query": "$rate(avg(UpstreamResponseTime) as UpstreamResponseTime) FROM metrics.nginx", "rawQuery": "SELECT t, UpstreamResponseTime/runningDifference(t/1000) UpstreamResponseTimeRate FROM ( SELECT (intDiv(toUInt32(TimeLocal), 120) * 120) * 1000 as t, avg(UpstreamResponseTime) as UpstreamResponseTime FROM metrics.nginx WHERE Date >= toDate(1539358595) AND TimeLocal >= toDateTime(1539358595) GROUP BY t ORDER BY t)", "refId": "B", "resultFormat": "time_series", "table": "nginx_streaming", "tableLoading": false }, { "database": "metrics", "dateColDataType": "Date", "dateLoading": false, "dateTimeColDataType": "TimeLocal", "datetimeLoading": false, "formattedQuery": "<font color=\"darkcyan\">$rate</font>(<font color=\"navajowhite\">avg</font>(UpstreamConnectTime) <font color=\"darkorange\">as</font> UpstreamConnectTime) <font color=\"darkorange\">FROM</font> metrics<font color=\"yellow\">.</font>nginx_streaming", "hide": false, "intervalFactor": 1, "query": "$rate(avg(UpstreamConnectTime) as UpstreamConnectTime) FROM metrics.nginx", "rawQuery": "SELECT t, UpstreamConnectTime/runningDifference(t/1000) UpstreamConnectTimeRate FROM ( SELECT (intDiv(toUInt32(TimeLocal), 120) * 120) * 1000 as t, avg(UpstreamConnectTime) as UpstreamConnectTime FROM metrics.nginx WHERE Date >= toDate(1539358595) AND TimeLocal >= toDateTime(1539358595) GROUP BY t ORDER BY t)", "refId": "C", "resultFormat": "time_series", "table": "nginx_streaming", "tableLoading": false } ], "thresholds": [], "timeFrom": null, "timeShift": null, "title": "Response Timing", "tooltip": { "shared": true, "sort": 0, "value_type": "individual" }, "type": "graph", "xaxis": { "buckets": null, "mode": "time", "name": null, "show": true, "values": [] }, "yaxes": [ { "format": "short", "label": null, "logBase": 1, "max": null, "min": null, "show": true }, { "format": "short", "label": null, "logBase": 1, "max": null, "min": null, "show": true } ] } ], "repeat": null, "repeatIteration": null, "repeatRowId": null, "showTitle": false, "title": "Dashboard Row", "titleSize": "h6" }, { "collapse": false, "height": 250, "panels": [ { "cacheTimeout": null, "colorBackground": false, "colorValue": false, "colors": [ "rgba(245, 54, 54, 0.9)", "rgba(237, 129, 40, 0.89)", "rgba(50, 172, 45, 0.97)" ], "datasource": "ClickHouse Main Server", "format": "none", "gauge": { "maxValue": 100, "minValue": 0, "show": false, "thresholdLabels": false, "thresholdMarkers": true }, "id": 4, "interval": null, "links": [], "mappingType": 1, "mappingTypes": [ { "name": "value to text", "value": 1 }, { "name": "range to text", "value": 2 } ], "maxDataPoints": 100, "nullPointMode": "connected", "nullText": null, "postfix": "", "postfixFontSize": "50%", "prefix": "", "prefixFontSize": "50%", "rangeMaps": [ { "from": "null", "text": "N/A", "to": "null" } ], "span": 2, "sparkline": { "fillColor": "rgba(31, 118, 189, 0.18)", "full": false, "lineColor": "rgb(31, 120, 193)", "show": false }, "tableColumn": "", "targets": [ { "database": "metrics", "dateColDataType": "Date", "dateLoading": false, "dateTimeColDataType": "TimeLocal", "datetimeLoading": false, "formattedQuery": "<font color=\"darkorange\">SELECT</font><br /> <font color=\"cornflowerblue\">1</font> <font color=\"darkorange\">as</font> t,<br /> <font color=\"navajowhite\">count</font>(<font color=\"yellow\">*</font>) <font color=\"darkorange\">as</font> c<br /> <font color=\"darkorange\">FROM</font> <font color=\"darkcyan\">$table</font><br /> <font color=\"darkorange\">WHERE</font> <font color=\"darkcyan\">$timeFilter</font> <font color=\"darkorange\">GROUP BY</font> t", "intervalFactor": 1, "query": "SELECT\n 1 as t,\n count(*) as c\n FROM $table\n WHERE $timeFilter GROUP BY t", "rawQuery": "SELECT 1 as t, count(*) as c FROM metrics.nginx WHERE Date >= toDate(1539358595) AND TimeLocal >= toDateTime(1539358595) GROUP BY t", "refId": "A", "resultFormat": "time_series", "table": "nginx_streaming", "tableLoading": false } ], "thresholds": "", "title": "Total Requests", "type": "singlestat", "valueFontSize": "80%", "valueMaps": [ { "op": "=", "text": "N/A", "value": "null" } ], "valueName": "avg" }, { "cacheTimeout": null, "colorBackground": false, "colorValue": false, "colors": [ "rgba(245, 54, 54, 0.9)", "rgba(237, 129, 40, 0.89)", "rgba(50, 172, 45, 0.97)" ], "datasource": "ClickHouse Main Server", "format": "ops", "gauge": { "maxValue": 100, "minValue": 0, "show": false, "thresholdLabels": false, "thresholdMarkers": true }, "id": 5, "interval": null, "links": [], "mappingType": 1, "mappingTypes": [ { "name": "value to text", "value": 1 }, { "name": "range to text", "value": 2 } ], "maxDataPoints": 100, "nullPointMode": "connected", "nullText": null, "postfix": "", "postfixFontSize": "50%", "prefix": "", "prefixFontSize": "50%", "rangeMaps": [ { "from": "null", "text": "N/A", "to": "null" } ], "span": 2, "sparkline": { "fillColor": "rgba(31, 118, 189, 0.18)", "full": false, "lineColor": "rgb(31, 120, 193)", "show": false }, "tableColumn": "", "targets": [ { "database": "metrics", "dateColDataType": "Date", "dateLoading": false, "dateTimeColDataType": "TimeLocal", "datetimeLoading": false, "formattedQuery": "<font color=\"darkorange\">SELECT</font><br /> <font color=\"cornflowerblue\">1</font> <font color=\"darkorange\">as</font> t,<br /> <font color=\"navajowhite\">count</font>(<font color=\"yellow\">*</font>) <font color=\"yellow\">/</font> <font color=\"cornflowerblue\">3600</font><font color=\"yellow\">*</font><font color=\"cornflowerblue\">24</font> <font color=\"darkorange\">as</font> c<br /> <font color=\"darkorange\">FROM</font> <font color=\"darkcyan\">$table</font><br /> <font color=\"darkorange\">WHERE</font> <font color=\"darkcyan\">$timeFilter</font> <font color=\"darkorange\">GROUP BY</font> t", "intervalFactor": 1, "query": "SELECT\n 1 as t,\n count(*) / 3600*24 as c\n FROM $table\n WHERE $timeFilter GROUP BY t", "rawQuery": "SELECT 1 as t, count(*) / 3600*24 as c FROM metrics.nginx WHERE Date >= toDate(1539358595) AND TimeLocal >= toDateTime(1539358595) GROUP BY t", "refId": "A", "resultFormat": "time_series", "table": "nginx_streaming", "tableLoading": false } ], "thresholds": "", "title": "RPS", "type": "singlestat", "valueFontSize": "80%", "valueMaps": [ { "op": "=", "text": "N/A", "value": "null" } ], "valueName": "avg" }, { "cacheTimeout": null, "colorBackground": true, "colorValue": false, "colors": [ "rgba(50, 172, 45, 0.97)", "rgba(237, 129, 40, 0.89)", "rgba(245, 54, 54, 0.9)" ], "datasource": "ClickHouse Main Server", "format": "none", "gauge": { "maxValue": 100, "minValue": 0, "show": false, "thresholdLabels": false, "thresholdMarkers": true }, "id": 6, "interval": null, "links": [], "mappingType": 1, "mappingTypes": [ { "name": "value to text", "value": 1 }, { "name": "range to text", "value": 2 } ], "maxDataPoints": 100, "nullPointMode": "connected", "nullText": null, "postfix": "", "postfixFontSize": "50%", "prefix": "", "prefixFontSize": "50%", "rangeMaps": [ { "from": "null", "text": "N/A", "to": "null" } ], "span": 2, "sparkline": { "fillColor": "rgba(31, 118, 189, 0.18)", "full": false, "lineColor": "rgb(31, 120, 193)", "show": false }, "tableColumn": "", "targets": [ { "database": "metrics", "dateColDataType": "Date", "dateLoading": false, "dateTimeColDataType": "TimeLocal", "datetimeLoading": false, "formattedQuery": "<font color=\"darkorange\">SELECT</font><br /> <font color=\"cornflowerblue\">1</font> <font color=\"darkorange\">as</font> t,<br /> <font color=\"navajowhite\">count</font>(<font color=\"yellow\">*</font>) <font color=\"darkorange\">as</font> c<br /> <font color=\"darkorange\">FROM</font> <font color=\"darkcyan\">$table</font><br /> <font color=\"darkorange\">WHERE</font> <font color=\"darkcyan\">$timeFilter</font> <font color=\"yellow\">AND</font> Status <font color=\"darkorange\">NOT</font> <font color=\"darkorange\">IN</font> (<font color=\"cornflowerblue\">200</font>, <font color=\"cornflowerblue\">201</font>, <font color=\"cornflowerblue\">401</font>) <font color=\"darkorange\">GROUP BY</font> t", "intervalFactor": 1, "query": "SELECT\n 1 as t,\n count(*) as c\n FROM $table\n WHERE $timeFilter AND Status NOT IN (200, 201, 401) GROUP BY t", "rawQuery": "SELECT 1 as t, count(*) as c FROM metrics.nginx WHERE Date >= toDate(1539358595) AND TimeLocal >= toDateTime(1539358595) AND Status NOT IN (200, 201, 401) GROUP BY t", "refId": "A", "resultFormat": "time_series", "table": "nginx_streaming", "tableLoading": false } ], "thresholds": "10,20,50", "title": "Failed Requests", "type": "singlestat", "valueFontSize": "80%", "valueMaps": [ { "op": "=", "text": "N/A", "value": "null" } ], "valueName": "avg" }, { "cacheTimeout": null, "colorBackground": true, "colorValue": false, "colors": [ "rgba(50, 172, 45, 0.97)", "rgba(237, 129, 40, 0.89)", "rgba(245, 54, 54, 0.9)" ], "datasource": "ClickHouse Main Server", "decimals": null, "format": "none", "gauge": { "maxValue": 100, "minValue": 0, "show": false, "thresholdLabels": false, "thresholdMarkers": true }, "id": 9, "interval": null, "links": [], "mappingType": 1, "mappingTypes": [ { "name": "value to text", "value": 1 }, { "name": "range to text", "value": 2 } ], "maxDataPoints": 100, "nullPointMode": "connected", "nullText": null, "postfix": "%", "postfixFontSize": "80%", "prefix": "", "prefixFontSize": "50%", "rangeMaps": [ { "from": "null", "text": "N/A", "to": "null" } ], "span": 2, "sparkline": { "fillColor": "rgba(31, 118, 189, 0.18)", "full": false, "lineColor": "rgb(31, 120, 193)", "show": false }, "tableColumn": "", "targets": [ { "database": "metrics", "dateColDataType": "Date", "dateLoading": false, "dateTimeColDataType": "TimeLocal", "datetimeLoading": false, "formattedQuery": "<font color=\"darkorange\">SELECT</font><br /> <font color=\"cornflowerblue\">1</font> <font color=\"darkorange\">as</font> t, (<font color=\"navajowhite\">sum</font>(Status <font color=\"yellow\">=</font> <font color=\"cornflowerblue\">500</font> <font color=\"yellow\">or</font> Status <font color=\"yellow\">=</font> <font color=\"cornflowerblue\">499</font>)<font color=\"yellow\">/</font><font color=\"navajowhite\">sum</font>(Status <font color=\"yellow\">=</font> <font color=\"cornflowerblue\">200</font> <font color=\"yellow\">or</font> Status <font color=\"yellow\">=</font> <font color=\"cornflowerblue\">201</font> <font color=\"yellow\">or</font> Status <font color=\"yellow\">=</font> <font color=\"cornflowerblue\">401</font>))<font color=\"yellow\">*</font><font color=\"cornflowerblue\">100</font> <font color=\"darkorange\">FROM</font> <font color=\"darkcyan\">$table</font><br /> <font color=\"darkorange\">WHERE</font> <font color=\"darkcyan\">$timeFilter</font> <font color=\"darkorange\">GROUP BY</font> t", "intervalFactor": 1, "query": "SELECT\n 1 as t, (sum(Status = 500 or Status = 499)/sum(Status = 200 or Status = 201 or Status = 401))*100 FROM $table\n WHERE $timeFilter GROUP BY t", "rawQuery": "SELECT 1 as t, (sum(Status = 500 or Status = 499)/sum(Status = 200 or Status = 201 or Status = 401))*100 FROM metrics.nginx WHERE Date >= toDate(1539358595) AND TimeLocal >= toDateTime(1539358595) GROUP BY t", "refId": "A", "resultFormat": "time_series", "table": "nginx_streaming", "tableLoading": false } ], "thresholds": "1,5", "title": "Failing Prcent", "type": "singlestat", "valueFontSize": "80%", "valueMaps": [ { "op": "=", "text": "N/A", "value": "null" } ], "valueName": "current" }, { "cacheTimeout": null, "colorBackground": true, "colorValue": false, "colors": [ "rgba(245, 54, 54, 0.9)", "rgba(237, 129, 40, 0.89)", "rgba(50, 172, 45, 0.97)" ], "datasource": "ClickHouse Main Server", "format": "s", "gauge": { "maxValue": 100, "minValue": 0, "show": false, "thresholdLabels": false, "thresholdMarkers": true }, "id": 7, "interval": null, "links": [], "mappingType": 1, "mappingTypes": [ { "name": "value to text", "value": 1 }, { "name": "range to text", "value": 2 } ], "maxDataPoints": 100, "nullPointMode": "connected", "nullText": null, "postfix": "", "postfixFontSize": "50%", "prefix": "", "prefixFontSize": "50%", "rangeMaps": [ { "from": "null", "text": "N/A", "to": "null" } ], "span": 2, "sparkline": { "fillColor": "rgba(31, 118, 189, 0.18)", "full": false, "lineColor": "rgb(31, 120, 193)", "show": false }, "tableColumn": "", "targets": [ { "database": "metrics", "dateColDataType": "Date", "dateLoading": false, "dateTimeColDataType": "TimeLocal", "datetimeLoading": false, "formattedQuery": "<font color=\"darkorange\">SELECT</font><br /> <font color=\"cornflowerblue\">1</font>, <font color=\"navajowhite\">avg</font>(RequestTime) <font color=\"darkorange\">FROM</font> <font color=\"darkcyan\">$table</font><br /> <font color=\"darkorange\">WHERE</font> <font color=\"darkcyan\">$timeFilter</font> <font color=\"darkorange\">GROUP BY</font> <font color=\"cornflowerblue\">1</font>", "intervalFactor": 1, "query": "SELECT\n 1, avg(RequestTime) FROM $table\n WHERE $timeFilter GROUP BY 1", "rawQuery": "SELECT 1, avg(RequestTime) FROM metrics.nginx WHERE Date >= toDate(1539358595) AND TimeLocal >= toDateTime(1539358595) GROUP BY 1", "refId": "A", "resultFormat": "time_series", "table": "nginx_streaming", "tableLoading": false } ], "thresholds": "0.02,0.05,0.1", "title": "Avg Response Time", "type": "singlestat", "valueFontSize": "80%", "valueMaps": [ { "op": "=", "text": "N/A", "value": "null" } ], "valueName": "avg" }, { "cacheTimeout": null, "colorBackground": true, "colorValue": false, "colors": [ "rgba(50, 172, 45, 0.97)", "rgba(237, 129, 40, 0.89)", "rgba(245, 54, 54, 0.9)" ], "datasource": "ClickHouse Main Server", "decimals": null, "format": "s", "gauge": { "maxValue": 100, "minValue": 0, "show": false, "thresholdLabels": false, "thresholdMarkers": true }, "id": 8, "interval": null, "links": [], "mappingType": 1, "mappingTypes": [ { "name": "value to text", "value": 1 }, { "name": "range to text", "value": 2 } ], "maxDataPoints": 100, "nullPointMode": "connected", "nullText": null, "postfix": "", "postfixFontSize": "70%", "prefix": "", "prefixFontSize": "50%", "rangeMaps": [ { "from": "null", "text": "N/A", "to": "null" } ], "span": 2, "sparkline": { "fillColor": "rgba(31, 118, 189, 0.18)", "full": false, "lineColor": "rgb(31, 120, 193)", "show": false }, "tableColumn": "", "targets": [ { "database": "metrics", "dateColDataType": "Date", "dateLoading": false, "dateTimeColDataType": "TimeLocal", "datetimeLoading": false, "formattedQuery": "<font color=\"darkorange\">SELECT</font><br /> <font color=\"cornflowerblue\">1</font> <font color=\"darkorange\">as</font> t, <font color=\"navajowhite\">max</font>(RequestTime) <font color=\"darkorange\">as</font> c<br /> <font color=\"darkorange\">FROM</font> <font color=\"darkcyan\">$table</font><br /> <font color=\"darkorange\">WHERE</font> <font color=\"darkcyan\">$timeFilter</font> <font color=\"darkorange\">GROUP BY</font> t", "intervalFactor": 1, "query": "SELECT\n 1 as t, max(RequestTime) as c\n FROM $table\n WHERE $timeFilter GROUP BY t", "rawQuery": "SELECT 1 as t, max(RequestTime) as c FROM metrics.nginx WHERE Date >= toDate(1539358595) AND TimeLocal >= toDateTime(1539358595) GROUP BY t", "refId": "A", "resultFormat": "time_series", "table": "nginx_streaming", "tableLoading": false } ], "thresholds": "0.2,0.5,1", "title": "Max Response Time", "type": "singlestat", "valueFontSize": "80%", "valueMaps": [ { "op": "=", "text": "N/A", "value": "null" } ], "valueName": "current" } ], "repeat": null, "repeatIteration": null, "repeatRowId": null, "showTitle": false, "title": "Dashboard Row", "titleSize": "h6" }, { "collapse": false, "height": "450", "panels": [ { "columns": [], "datasource": "ClickHouse Main Server", "fontSize": "100%", "id": 11, "links": [], "pageSize": null, "scroll": true, "showHeader": true, "sort": { "col": 0, "desc": true }, "span": 8, "styles": [ { "alias": "Time", "dateFormat": "HH:mm:ss", "pattern": "Time", "type": "date" }, { "alias": "", "colorMode": null, "colors": [ "rgba(245, 54, 54, 0.9)", "rgba(237, 129, 40, 0.89)", "rgba(50, 172, 45, 0.97)" ], "dateFormat": "YYYY-MM-DD HH:mm:ss", "decimals": 0, "pattern": "Status", "thresholds": [], "type": "number", "unit": "none" }, { "alias": "Response Time", "colorMode": null, "colors": [ "rgba(50, 172, 45, 0.97)", "rgba(237, 129, 40, 0.89)", "rgba(245, 54, 54, 0.9)" ], "dateFormat": "YYYY-MM-DD HH:mm:ss", "decimals": 2, "pattern": "RequestTime", "thresholds": [ "50", "70", "100" ], "type": "number", "unit": "dtdurations" }, { "alias": "", "colorMode": null, "colors": [ "rgba(245, 54, 54, 0.9)", "rgba(237, 129, 40, 0.89)", "rgba(50, 172, 45, 0.97)" ], "decimals": 2, "pattern": "/.*/", "thresholds": [], "type": "number", "unit": "short" } ], "targets": [ { "database": "metrics", "dateColDataType": "Date", "dateLoading": false, "dateTimeColDataType": "TimeLocal", "datetimeLoading": false, "formattedQuery": "SELECT TimeLocal as t, Status, RequestMethod, splitByChar(' ', Request)[2] as Request, RequestTime FROM $table WHERE $timeFilter AND Status NOT IN (200, 201) AND RequestMethod != 'OPTIONS' ORDER BY t", "intervalFactor": 1, "query": "SELECT TimeLocal as t, Status, RequestMethod, splitByChar(' ', Request)[2] as Request, RequestTime FROM $table WHERE $timeFilter AND Status NOT IN (200, 201) AND RequestMethod != 'OPTIONS' ORDER BY t", "rawQuery": "SELECT TimeLocal as t, Status, RequestMethod, splitByChar(' ', Request)[2] as Request, RequestTime FROM metrics.nginx WHERE Date >= toDate(1539358595) AND TimeLocal >= toDateTime(1539358595) AND Status NOT IN (200, 201) AND RequestMethod != 'OPTIONS' ORDER BY t", "refId": "A", "resultFormat": "time_series", "table": "nginx_streaming", "tableLoading": false } ], "title": "Error Requests", "transform": "timeseries_to_columns", "type": "table" } ], "repeat": null, "repeatIteration": null, "repeatRowId": null, "showTitle": false, "title": "Dashboard Row", "titleSize": "h6" } ], "schemaVersion": 14, "style": "dark", "tags": [], "templating": { "list": [] }, "time": { "from": "now-24h", "to": "now" }, "timepicker": { "refresh_intervals": [ "5s", "10s", "30s", "1m", "5m", "15m", "30m", "1h", "2h", "1d" ], "time_options": [ "5m", "15m", "1h", "6h", "12h", "24h", "2d", "7d", "30d" ] }, "timezone": "", "title": "Streaming API", "version": 17 }
Testing done using Apache benchmark.
Install it:
yum install -y httpd-tools
We start testing with Apache benchmark in different consoles:
while true; do ab -c 1 -n 1 -t 1 http://vhost1/; sleep 2; done while true; do ab -c 1 -n 1 -t 1 http://vhost2/; sleep 2; done while true; do ab -c 1 -n 1 -t 1 http://vhost3/; sleep 2; done while true; do ab -c 1 -n 1 -t 1 http://vhost4/; sleep 2; done while true; do ab -c 1 -n 1 -t 1 http://vhost5/; sleep 2; done
Screenshots:

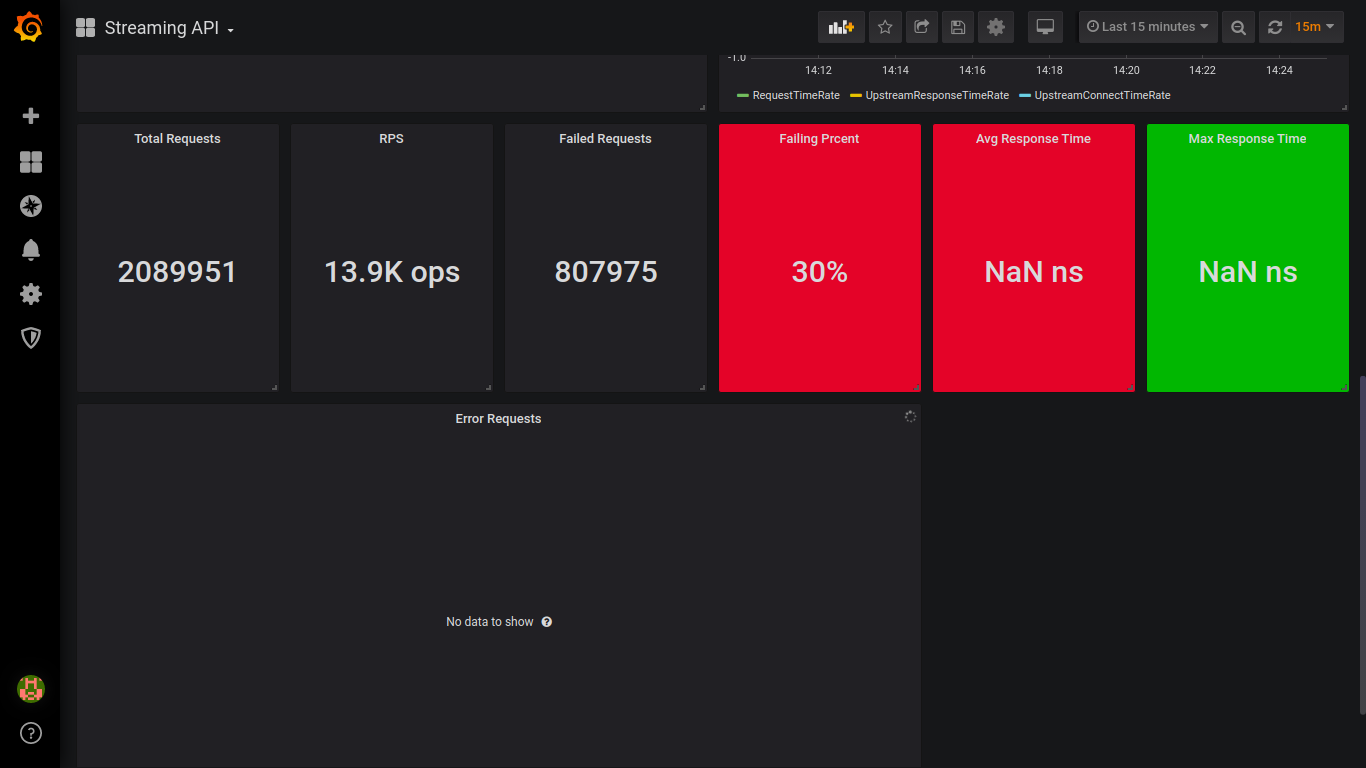
Screenshot from github developer:

Output:
I hope for the further development of the project. While the project is inactive.
If you will assemble the project by hand, then pay attention to this issue .
Telegram channels:
Clickhouse
Nginx
Church metrics
Question to readers: If you store metrics in clickhouse, then what self-hosted utilities / projects do you get metrics by status codes and virtual hosts with Nginx?