VK has a group with the following description:
The same photo is manually saved every day on a computer and is again uploaded, gradually losing quality.
On the left is the original image uploaded on June 7, 2012, on the right is what it is now.
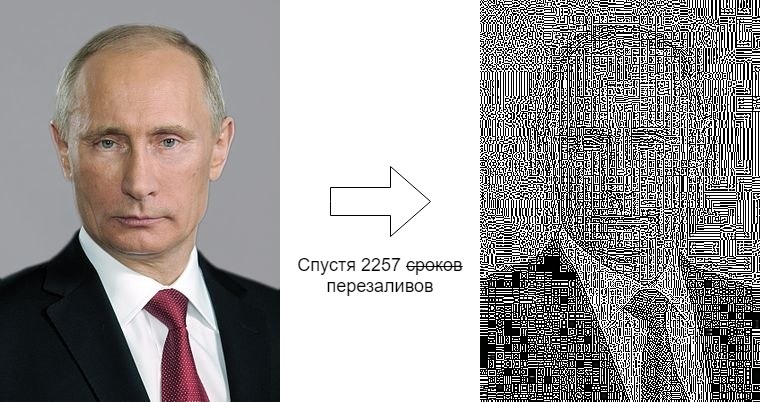
This difference is very suspicious. Let's try to figure out what happened during these 7 years. For acquaintance there is an article on Medusa about this group, but only the technical side will interest us.
Why and at what stage JPEG compresses with losses
Consider a highly simplified JPEG encoding and decoding scheme. Only those operations are shown that illustrate the basic principles of the JPEG algorithm.

So, 4 operations:
- DCT is a discrete cosine transform.
- Quantization - rounding each value to the nearest multiple of the quantization step: y = [x / h] * h, where h is the step.
- IDCT is the inverse discrete cosine transform.
- Rounding is normal rounding. This stage could not be shown in the diagram, since it is obvious. But then its importance will be demonstrated.
The green color indicates operations that store all information (without taking into account losses when working with floating point numbers), the pink ones - lose. That is, losses and artifacts appear not because of the cosine transform, but because of simple quantization. The article will not consider an important stage - Huffman coding, since it is performed without loss.
Consider these steps in more detail.
DCT
Since there are several variations of DCT, just in case, I’ll clarify that JPEG uses a second type of DCT with normalization. When encoding, each image is divided into 8x8 squares (for each channel). Each such square can be represented as a 64-dimensional vector. The cosine transformation is to find the coordinates of this vector in another orthonormal basis. It is difficult to visualize 64-dimensional space, so 2-dimensional analogies will be given below. You can imagine that the picture is divided into 2x1 blocks. In the graphs that will be shown below, the x-axis corresponds to the values of the first pixel of the block, the y-axis to the second.
Continuing the analogy with a specific example, suppose that the values of two pixels from the original image are 3 and 4. Draw the vector (3, 4) in the original basis, as shown in the figure below. The original basis is marked in blue. The coordinates of the vector in some new basis are (4.8, 1.4).
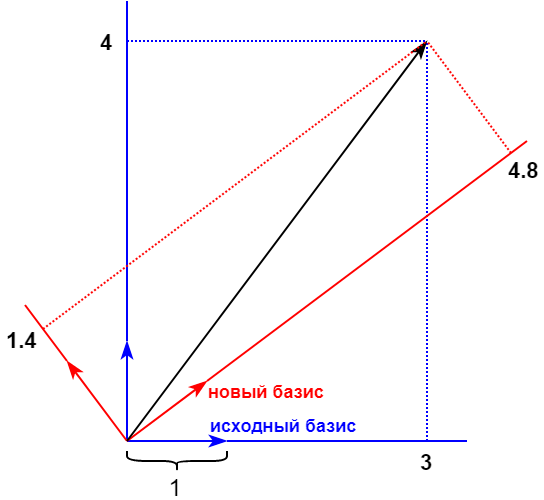
In the considered example, a new basis was chosen randomly. DCT offers a very specific 64-dimensional fixed basis. The justification of why it is used in JPEG is very interesting, and was described by me in another article . We will only touch on the gist. In general, the values of all pixels are equivalent. But if we transform them using DCT, then from the resulting 64 coordinates in a new basis (called the DCT transform coefficients), we can safely zero out or roughly round some of them, with minimal losses. This is possible thanks to the features of compressible images.
Quantization
Fractional values cannot be saved in a file. Therefore, depending on the quantization step, the values 4.8, 1.4 will be saved as follows:
- at step 1 (the most gentle option): 5 and 1,
- at step 2: 4 and 2,
- at step 3: 6 and 0.
Usually the step is chosen different for each value. A JPEG file has at least one array, called a quantization table, that stores 64 quantization steps. This table depends on the compression quality specified in any graphics editor.
IDCT
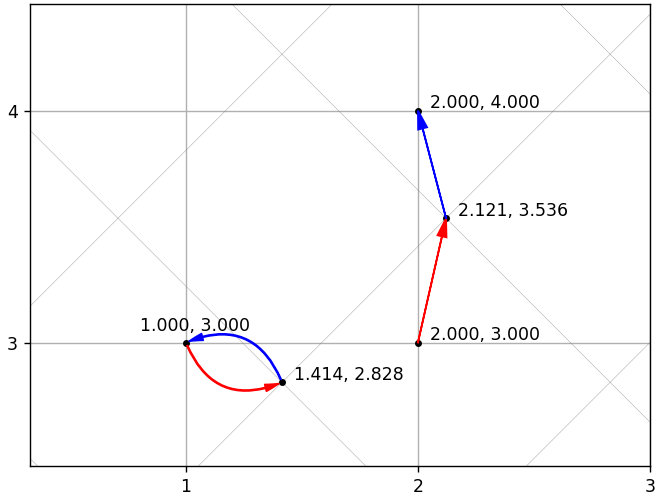
Same as DCT, but with a transposed basis. Mathematically, x = IDCT (DCT (x)), so if there were no quantization, then it would be possible to recover without loss. But there would be no compression. Due to the use of quantization, the original vector cannot always be calculated accurately. The following figure shows 2 examples with accurate and inaccurate recovery. The slanted grid corresponds to a new basis, the straight line to the original one.
The obvious question arises: can a sequence of transcoding lead to a vector that is very different from the original? Can.

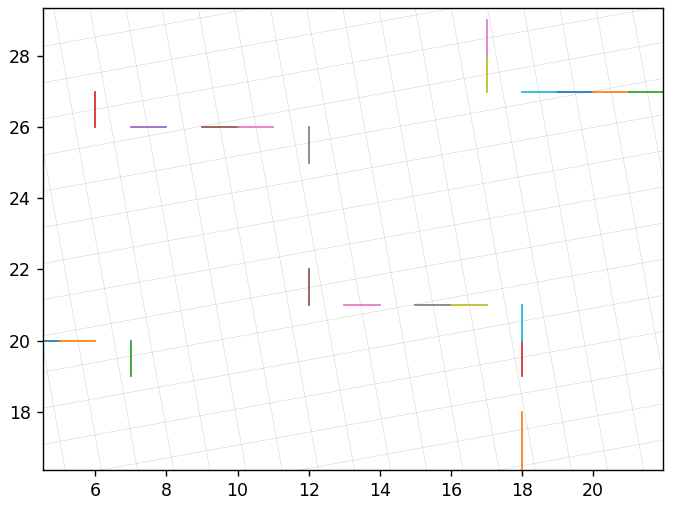
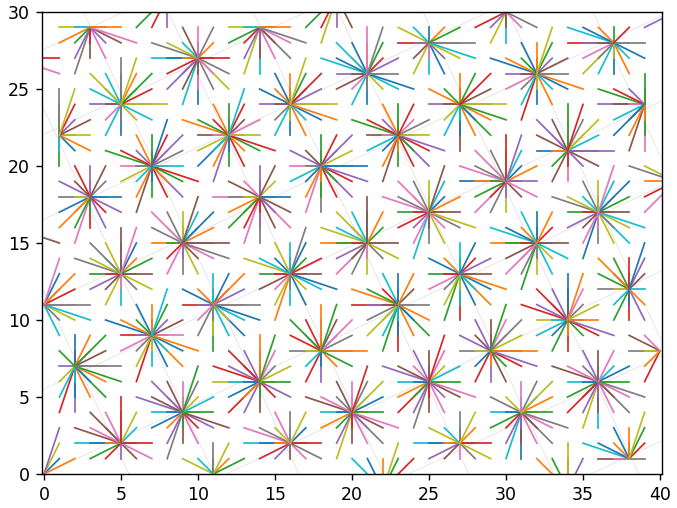
It would be interesting to sort through all integer vectors and see what their transcoding will lead to. To reduce information noise, we remove the grid of the initial basis and we will directly connect the original and reconstructed vectors (without an intermediate step) by segments. First, consider a quantization step equal to 1 for all coordinates. The new basis in the following figure is rotated by 45 degrees and for it we have 17.1% of inaccurate recoveries. The colors of the segments do not mean anything, but they will be useful to prevent their visual merging.

This basis is 10.3 degrees with 7.4% inaccurate recoveries:

Near:
And this one is at 10.4 with 6.4%:

19 degrees from 12.5%:

But if you set the quantization step greater than 1, then the reconstructed vectors begin to clearly concentrate close to the grid nodes. This is step 5:
This is 2:

If you recode the image several times, but with the same pitch, then almost nothing will happen compared to a single recoding. The values seem to be "stuck" in the nodes of the grid and can no longer "jump" from there to other nodes. If the step is different, then the vector will “jump” from one grid node to another. This can take him anywhere. The following figure shows the result of 4 transcodes with steps 1, 2, 3, 4. You can see a large grid with step 12. This value is the smallest common multiple of 1, 2, 3, 4.

And on this - with steps from 1 to 7. Visualization is shown only for part of the original vectors in order to improve visualization.
Rounding
Why round off values after IDCT? After all, if you get rid of this stage, then the restored image will be represented by fractional values, and we will not lose anything when re-encoding. From a mathematical point of view, we will simply move from one basis to another without loss. It is necessary to mention here the conversion of color spaces. Although JPEG does not regulate the color space and allows you to save directly in the source RGB, but in the vast majority of cases, preliminary conversion to YCbCr is used. Eye features and all that. And such a conversion also leads to losses.
Suppose we get a JPEG file compressed with maximum quality, that is, with a quantization step of 1 for all coefficients. We don’t know which codec was used, but usually codecs round off after the RGB -> YCbCr conversion. Since the quality is maximum, after IDCT we get fractional, but rather close values to the original ones in the YCbCr space. If we round, then most of them will be restored exactly.
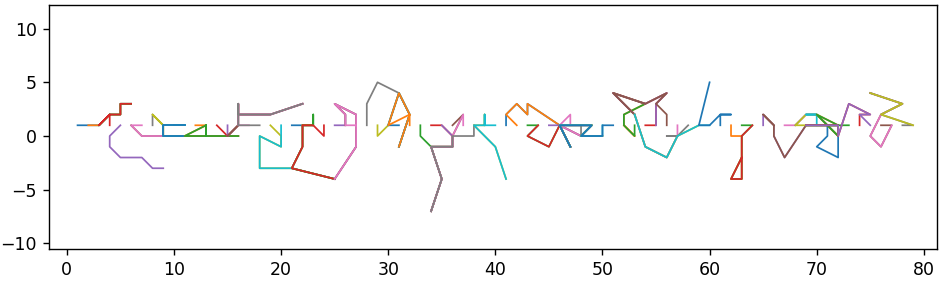
But if not round, then due to such small differences, the YCbCr -> RGB conversion can even further distance them from the original values. With subsequent transcoding, the gap will increase more and more. To somehow visualize this process, we use the principal component method to project 64-dimensional vectors onto a plane. Then for 1000 transcodes we get approximately the following sequence of changes:

The absolute values of the axes here do not make much sense, but the relative significance of the distortions can be used.
Multiple Transcoding Examples
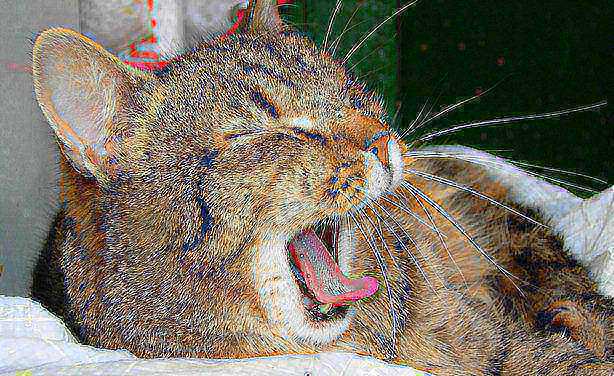
Source cat:

After one re-preservation with quality 50:

After any subsequent number of transcodes with the same quality, the picture does not change. Now we will gradually reduce the quality from 90 to 50 in 1:
About the same thing happened on the chart below:
After one re-preservation with quality 20:

Seamlessly from 90 to 20:
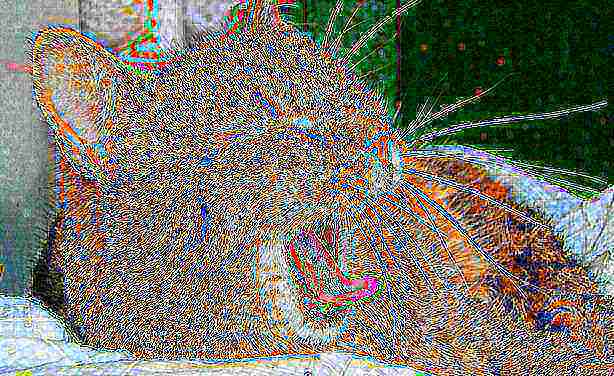
Now 1000 times with random quality from 80 to 90:

10,000 times:

VK Group Pictures Analysis
Let's analyze more than 2000 pictures from the VK group. First, check the average absolute deviation from the very first. The x-axis is the picture number (or day), the y-axis is the deviation.
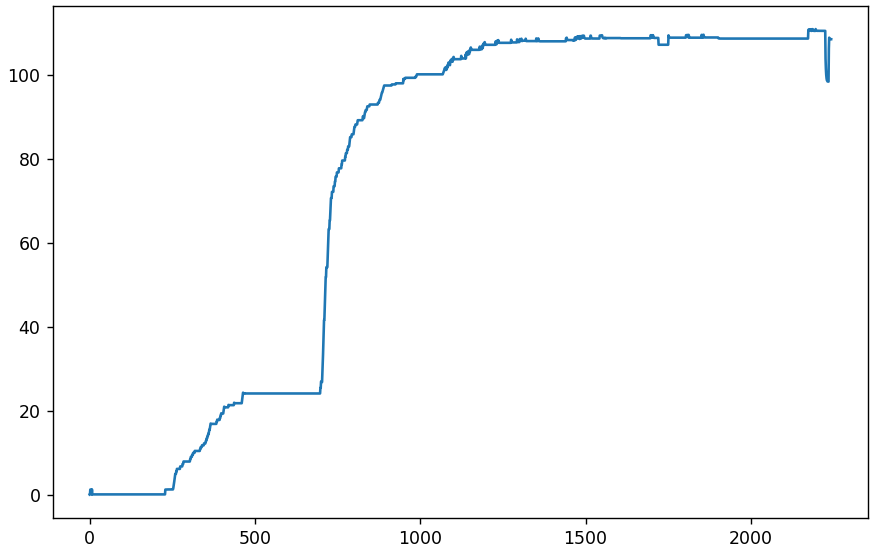
Let's move on to the differential graph showing the average absolute deviation of the neighboring pictures.

Small fluctuations in the beginning are normal. Until the 232nd, everything is going well, the pictures are completely identical. And the 233rd suddenly differs by an average of 1.23 for each pixel (on a scale from 0 to 255). It's a lot. Maybe the quantization tables just changed. Check it out. And at the same time, it’s comparable with the size of the received files.
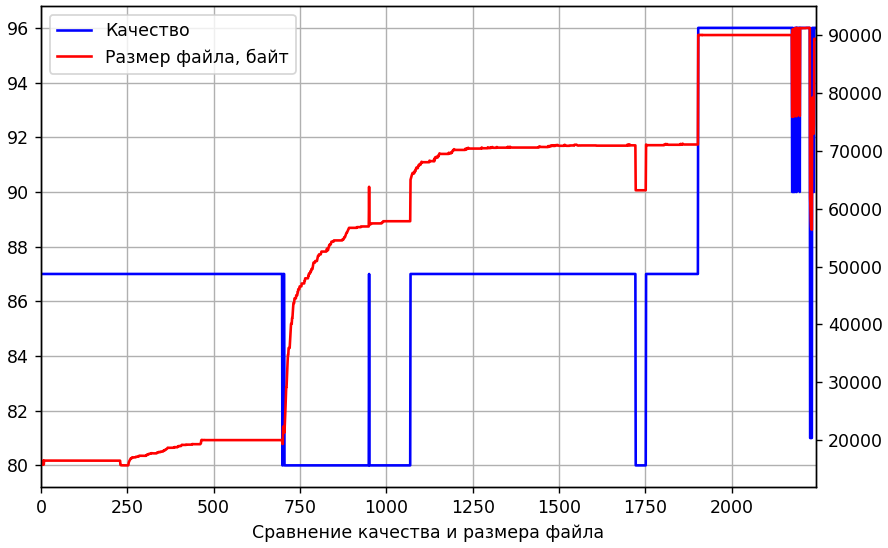
Yes, the tables have changed. But not earlier than the 700s. Then, perhaps, an intermediate hidden transcoding with low quality occurred. Let's try to recode the 232nd twice. For the first time, we will go through different quality levels, and for the second we use the same quantization table as for all from the 1st to the 700s. Our goal is to get the picture as similar as possible to the 233rd. In the following figure, along the x axis is the quality of intermediate transcoding, along y is the average absolute deviation from the 233rd.
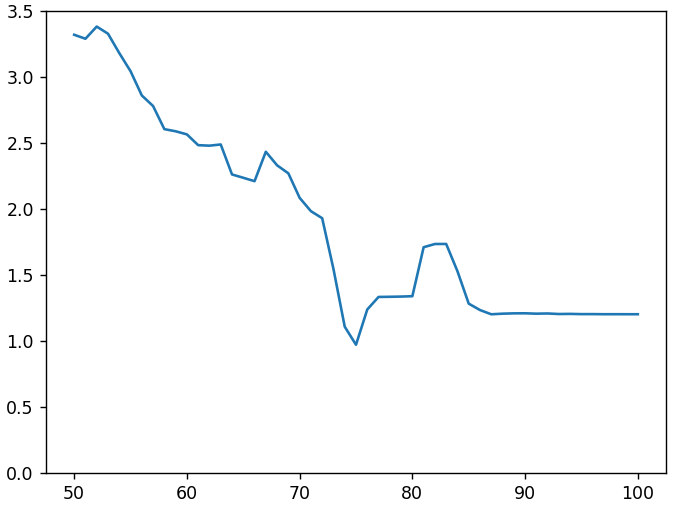
Although there is a failure on the chart with a quality of 75%, approximately equal to 1, but still far from the desired zero. Adding a 2nd intermediate stage and changing the parameters of subsampling did not improve the situation.
With the rest of the pictures, everything is about the same, plus the change in the quantization tables is also superimposed. That is, at some point the picture changes dramatically, then it stabilizes in a few days, but only until a new surge occurs. Perhaps there is a change in the image itself on the servers. I can not completely exclude the involvement of the group administrator.
Unfortunately, I did not find out what really happened with the image. At least now I’m sure that it was not just a re-preservation. But, most importantly, it became better to represent the ongoing processes during encoding and decoding. Hope you do too.
Archive with pictures , for independent research.