
In 2015, I wrote about the tools that Ruby provides for detecting managed memory leaks . Mostly the article talked about easily manageable leaks. This time I will talk about tools and tricks that you can use to eliminate leaks that are not so easy to analyze in Ruby. In particular, I will talk about mwrap, heaptrack, iseq_collector and chap.
Unmanaged memory leaks
This small program triggers a leak with a direct call to malloc. It starts with a consumption of 16 MB of RSS, and ends with 118 MB. The code places in memory 100 thousand blocks of 1024 bytes and deletes 50 thousand of them.
require 'fiddle' require 'objspace' def usage rss = `ps -p #{Process.pid} -o rss -h`.strip.to_i * 1024 puts "RSS: #{rss / 1024} ObjectSpace size #{ObjectSpace.memsize_of_all / 1024}" end def leak_memory pointers = [] 100_000.times do i = Fiddle.malloc(1024) pointers << i end 50_000.times do Fiddle.free(pointers.pop) end end usage # RSS: 16044 ObjectSpace size 2817 leak_memory usage # RSS: 118296 ObjectSpace size 3374
Although RSS is 118 MB, our Ruby object is only aware of three megabytes. In the analysis, we see only a very small part of this very large memory leak.
A real example of such a leak is described by Oleg Dashevsky , I recommend reading this wonderful article.
Apply Mwrap
Mwrap is a memory profiler for Ruby that monitors all placement of data in memory, intercepting malloc and other functions of this family. It intercepts calls that place and free memory using LD_PRELOAD . It uses liburcu for counting and can track allocation and deletion counters for each call point, in C and Ruby code. Mwrap is small in size, about twice as large as RSS for a profiled program, and about twice as slow.
It differs from many other libraries in its very small size and Ruby support. It tracks locations in Ruby files and is not limited to valgrind + masif C-level backtracks and similar profilers. This greatly simplifies isolating the sources of problems.
To use the profiler, you need to run the application through the Mwrap shell, it will implement the LD_PRELOAD environment and run the Ruby binary.
Let's add Mwrap to our script:
require 'mwrap' def report_leaks results = [] Mwrap.each do |location, total, allocations, frees, age_total, max_lifespan| results << [location, ((total / allocations.to_f) * (allocations - frees)), allocations, frees] end results.sort! do |(_, growth_a), (_, growth_b)| growth_b <=> growth_a end results[0..20].each do |location, growth, allocations, frees| next if growth == 0 puts "#{location} growth: #{growth.to_i} allocs/frees (#{allocations}/#{frees})" end end GC.start Mwrap.clear leak_memory GC.start # Don't track allocations for this block Mwrap.quiet do report_leaks end
Now run the script with the Mwrap wrapper:
% gem install mwrap % mwrap ruby leak.rb leak.rb:12 growth: 51200000 allocs/frees (100000/50000) leak.rb:51 growth: 4008 allocs/frees (1/0)
Mwrap correctly detected a leak in the script (50,000 * 1024). And not only determined, but also isolated a specific line (
i = Fiddle.malloc(1024)
), which led to a leak. The profiler correctly bound it to calls to
Fiddle.free
.
It is important to note that we are dealing with an assessment. Mwrap monitors the shared memory allocated by the dial peer, and then monitors the freeing of memory. But if you have one call point that allocates memory blocks of different sizes, the result will be inaccurate. We have access to the evaluation:
((total / allocations) * (allocations - frees))
In addition, to simplify leak tracking, Mwrap tracks
age_total
, which is the sum of the lifespan of each freed object, and also tracks
max_lifespan
, the lifespan of the oldest object at the call point. If
age_total / frees
large, then memory consumption is increasing despite numerous garbage collections.
Mwrap has several helpers to reduce noise.
Mwrap.clear
will clear all internal storage.
Mwrap.quiet {}
will force Mwrap to track the block of code.
Another distinguishing feature of Mwrap is the tracking of the total number of bytes allocated and freed. Remove
clear
from the script and run it:
usage puts "Tracked size: #{(Mwrap.total_bytes_allocated - Mwrap.total_bytes_freed) / 1024}" # RSS: 130804 ObjectSpace size 3032 # Tracked size: 91691
The result is very interesting, because despite the RSS size of 130 MB, Mwrap sees only 91 MB. This suggests that we have inflated our process. Execution without Mwrap shows that in a normal situation the process takes 118 MB, and in this simple case the difference was 12 MB. The allocation / freeing pattern has led to fragmentation. This knowledge can be very useful, in some cases, the unconfigured glibc malloc processes fragment so much that the very large amount of memory used in RSS is actually free.
Can Mwrap isolate an old redcarpet leak?
In his article, Oleg discusses a very thorough way of isolating a very thin leak in redcarpet. There are many details. It is very important to take measurements. If you are not building a timeline for the RSS process, then you are unlikely to be able to get rid of any leaks.
Let's get in a time machine and demonstrate how much easier it is to use Mwrap for such leaks.
def red_carpet_leak 100_000.times do markdown = Redcarpet::Markdown.new(Redcarpet::Render::HTML, extensions = {}) markdown.render("hi") end end GC.start Mwrap.clear red_carpet_leak GC.start # Don't track allocations for this block Mwrap.quiet do report_leaks end
Redcarpet 3.3.2:
redcarpet.rb:51 growth: 22724224 allocs/frees (500048/400028) redcarpet.rb:62 growth: 4008 allocs/frees (1/0) redcarpet.rb:52 growth: 634 allocs/frees (600007/600000)
Redcarpet 3.5.0:
redcarpet.rb:51 growth: 4433 allocs/frees (600045/600022) redcarpet.rb:52 growth: 453 allocs/frees (600005/600000)
If you can afford to run the process at half the speed, just restarting it in the Mwrap prod with logging the result to a file, then you can identify a wide range of memory leaks.
Mysterious leak
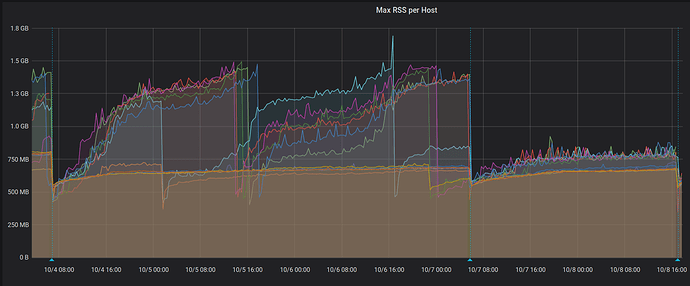
Recently, Rails was updated to version 6. In general, the experience was very positive, the performance remained approximately the same. Rails 6 has some very good features that we will use (e.g. Zeitwerk ). Rails changed the way the templates were rendered, which required a few changes for compatibility. A few days after the update, we noticed an increase in RSS for Sidekiq task performer.
Mwrap reported a sharp increase in memory consumption due to its allocation ( link ):
source.encode! # Now, validate that the source we got back from the template # handler is valid in the default_internal. This is for handlers # that handle encoding but screw up unless source.valid_encoding? raise WrongEncodingError.new(source, Encoding.default_internal) end begin mod.module_eval(source, identifier, 0) rescue SyntaxError # Account for when code in the template is not syntactically valid; eg if we're using # ERB and the user writes <%= foo( %>, attempting to call a helper `foo` and interpolate # the result into the template, but missing an end parenthesis. raise SyntaxErrorInTemplate.new(self, original_source) end end def handle_render_error(view, e) if e.is_a?(Template::Error)
At first it puzzled us a lot. We were trying to understand why dissatisfied with Mwrap? Maybe he broke? As memory consumption grew, heaps in Ruby remained unchanged.
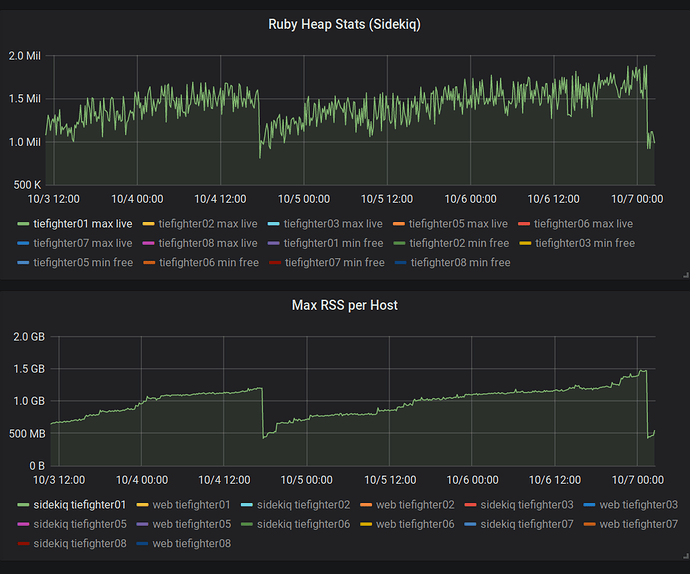
Two million slots on the heap consumed only 78 MB (40 bytes per slot). Lines and arrays can take up more space, but it still did not explain the abnormal memory consumption that we observed. This was confirmed when I
rbtrace -p SIDEKIQ_PID -e ObjectSpace.memsize_of_all
.
Where did the memory go?
Heaptrack
Heaptrack is a heap memory profiler for Linux.
Milian Wolff perfectly explained how the profiler works and talked about him in several speeches ( 1 , 2 , 3 ). In fact, it is a very efficient native heap profiler that, with the help of libunwind, collects backtraces from profiled applications. It works noticeably faster than Valgrind / Massif and has the ability to make it much more convenient for temporary profiling in the prod. It can be attached to an already running process!
As with most heap profilers, when calling each function from the malloc family, Heaptrack must count. This procedure definitely slows down the process.
In my opinion, the architecture here is the best of all possible. Interception is performed using
LD_PRELOAD
or GDB to load the profiler. Using a special FIFO file, it transfers data from the profiled process as quickly as possible. The heaptrack wrapper is a simple shell script that makes finding a problem easier. The second process reads information from the FIFO and compresses tracking data on the fly. Since Heaptrack operates with “chunks,” you can analyze the profile just a few seconds after the start of profiling, right in the middle of the session. Just copy the profile file to another location and launch the Heaptrack GUI.
This GitLab ticket told me the very possibility of launching Heaptrack. If they could launch it, then I can.
Our application runs in a container, and I need to restart it with
--cap-add=SYS_PTRACE
, this allows GDB to use ptrace , which is necessary for Heaptrack to inject itself. I also need a small hack for the shell file to apply
root
to the profile of the non-
root
process (we launched our Discourse application in the container under a limited account).
After everything has been done, it remains only to run
heaptrack -p PID
and wait for the results to appear. Heaptrack turned out to be an excellent tool, it was very easy to track everything that happens with memory leaks.
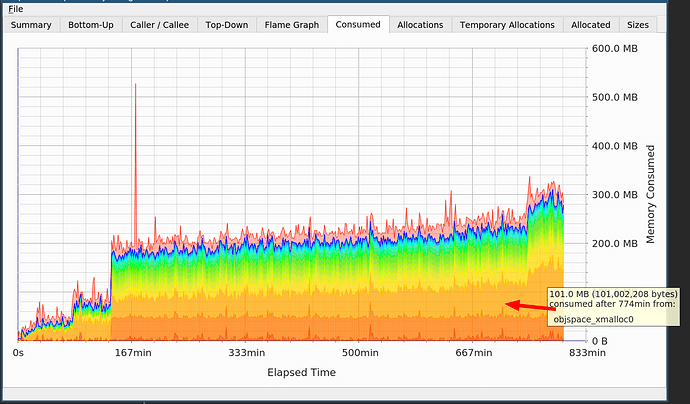
On the graph, you see two leaps, one due to
cppjieba
, the other due to
objspace_xmalloc0
in Ruby.
I knew about cppjieba . Segmenting the Chinese language is expensive, you need large dictionaries, so this is not a leak. But what about allocating memory in Ruby, which still doesn't tell me that?
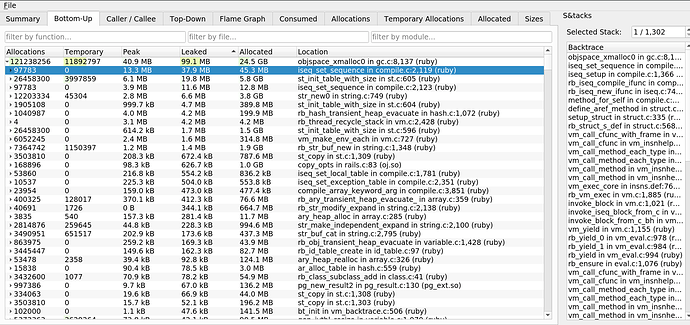
The main gain is related to
iseq_set_sequence
in
compile.c
. It turns out that the leak is due to sequences of instructions. This cleared up the leak discovered by Mwrap. Its cause was
mod.module_eval(source, identifier, 0)
, which created sequences of instructions that were not deleted from memory.
If, in a retrospective analysis, I carefully considered a heap dump from Ruby, then I would have noticed all these IMEMOs, since they are included in this dump. They are simply invisible during in-process diagnostics.
From this point on, debugging was pretty simple. I tracked all calls to the eval module and dumped what it evaluated. I found that we are adding methods to a large class over and over again. Here is a simplified view of the bug we encountered:
require 'securerandom' module BigModule; end def leak_methods 10_000.times do method = "def _#{SecureRandom.hex}; #{"sleep;" * 100}; end" BigModule.module_eval(method) end end usage # RSS: 16164 ObjectSpace size 2869 leak_methods usage # RSS: 123096 ObjectSpace size 5583
Ruby has a class for storing
RubyVM::InstructionSequence
sequences of instructions:
RubyVM::InstructionSequence
. However, Ruby is too lazy to create these wrapper objects, because storing them unnecessarily is inefficient. Koichi Sasada created the iseq_collector dependency. If we add this code, we can find our hidden memory:
require 'iseq_collector' puts "#{ObjectSpace.memsize_of_all_iseq / 1024}" # 98747 ObjectSpace.memsize_of_all_iseq
materializes every sequence of instructions, which can slightly increase the memory consumption of the process and give the garbage collector a little more work.
If, for example, we calculate the number of ISEQs before and after the run of the collector, we will see that after running
ObjectSpace.memsize_of_all_iseq
our counter of the
RubyVM::InstructionSequence
class
RubyVM::InstructionSequence
increase from 0 to 11128 (in this example):
def count_iseqs ObjectSpace.each_object(RubyVM::InstructionSequence).count end
These wrappers will remain throughout the life of the method, they will need to be visited with a full run of the garbage collector. Our problem was solved by reusing the class responsible for rendering email templates ( hotfix 1 , hotfix 2 ).
chap
During debugging, I used a very interesting tool. A few years ago, Tim Boddy pulled out an internal tool used by VMWare to analyze memory leaks and made its code open. Here is the only video about this that I managed to find: https://www.youtube.com/watch?v=EZ2n3kGtVDk . Unlike most similar tools, this one has no effect on the executable process. It can simply be applied to the files of the main dump, while glibc is used as an allocator (there is no support for jemalloc / tcmalloc, etc.).
With chap, it’s very easy to detect the leak that I had. Few distributions have a chap binary, but you can easily compile it from the source code . He is very actively supported.
# 444098 is the `Process.pid` of the leaking process I had sudo gcore -p 444098 chap core.444098 chap> summarize leaked Unsigned allocations have 49974 instances taking 0x312f1b0(51,573,168) bytes. Unsigned allocations of size 0x408 have 49974 instances taking 0x312f1b0(51,573,168) bytes. 49974 allocations use 0x312f1b0 (51,573,168) bytes. chap> list leaked ... Used allocation at 562ca267cdb0 of size 408 Used allocation at 562ca267d1c0 of size 408 Used allocation at 562ca267d5d0 of size 408 ... chap> summarize anchored .... Signature 7fbe5caa0500 has 1 instances taking 0xc8(200) bytes. 23916 allocations use 0x2ad7500 (44,922,112) bytes.
Chap can use signatures to find locations for different memory allocation, and it can complement GDB. When debugging in Ruby, it can be of great help in determining which memory the process is using. It shows the total used memory, sometimes glibc malloc can fragment so much that the used volume can be very different from the actual RSS. You can read the discussion: Feature # 14759: [PATCH] set M_ARENA_MAX for glibc malloc - Ruby master - Ruby Issue Tracking System . Chap is able to correctly count all used memory and provide an in-depth analysis of its allocation.
In addition, chap can be integrated into workflows to automatically detect leaks and flag such assemblies.
Follow up work
This debugging round made me raise a few questions related to our helper toolkits:
- I would like to have support for capturing call stack frames from Ruby in Heaptrack. Milian is also interested in this: 412929 - Can we grab a frame from Ruby land?
- I would like Ruby to support broader diagnostic capabilities: https://bugs.ruby-lang.org/issues/16245
- I would like Mwrap to be a little easier to use in the prod. Read here .
Summary
Our today's toolkit for debugging very complex memory leaks is much better than what it was 4 years ago! Mwrap, Heaptrack, and chap are very powerful tools for solving memory problems that arise during development and operation.
If you are hunting for a simple memory leak in Ruby, I recommend reading my 2015 article , for the most part it is relevant.
I hope you find it easier the next time you start debugging a complex native memory leak.