As I remember now, a weekday morning, you are in a hurry to study. You approach a public transport stop, look at a crowd of people resembling a march of penguins in their movements. You look at the road where the cyclist goes next to his bicycle faster than the cars move. You understand that there is nothing to catch here, you turn around and walk. There are traffic jams everywhere: they train Buddhist patience with drivers on the roads, and in public transport they allow you to conduct a yoga lesson, whether you like it or not. The main cause of traffic delays is the presence of too many vehicles or people for a particular traffic path that cannot cope with such a flow. Large numbers of individuals also occur among wildlife, and each species fights corks with its own unique method. Ants are rightly called one of the best in matters of organization and cooperation. These little workaholics live in many thousands, and even in many millions of colonies, but at the same time do not experience any “delights” of traffic jams. Naturally, the question arises - how do they do it? Scientists from the University of Arizona (USA) and Toulouse (France) were looking for the answer to this question. How exactly do ants fight traffic jams and which of their methods can be applied to us, and which are not? We learn about this from the report of the research group. Go.
Study basis
Ants have always been associated with workaholism, monarchy and the class division of society according to Marx. The family of ants has about 14,000 species that live in all corners of the planet except Antarctica. If you count all the ants on Earth, then they will make up about 10-25% of the biomass of terrestrial animals. The success of ants is based on their ability to adapt to changing environmental conditions and incredible organization.
The Empire of Ants documentary (BBC, David Attenborough, 2018).
Looking at how ants build their incredible colonies, move in organized rows and as if they never stop, it seems that each of them is a particle of a single organism - a collective mind. That is why the interest in these insects by scientists does not fade.

Migration of a herd of wildebeests.
If we talk about the movement, then many types of living organisms in one form or another take part in the collective movement: insect colonies, schools of fish, herds of migratory ungulates, flocks of birds, etc. Most often, most individuals move along one path (vector), but along their unique trajectory, which facilitates the coordination of both this individual and the entire stream as a whole. Problems begin if some move in one direction, while others move towards them. In this case, collisions are extremely difficult to avoid. But such a situation is not as widespread in the animal world as it might seem at first glance. Remember what a herd of wildebeest looks like, running across the field during the migration period. Their flow moves in one direction common to all individuals, a kind of one-way road. Humans are one of the few organisms that can collectively move in both directions simultaneously, i.e. on a two-way road. Ants are also capable of this trick, which for us seems quite commonplace, but for collective organisms it is considered very unique.

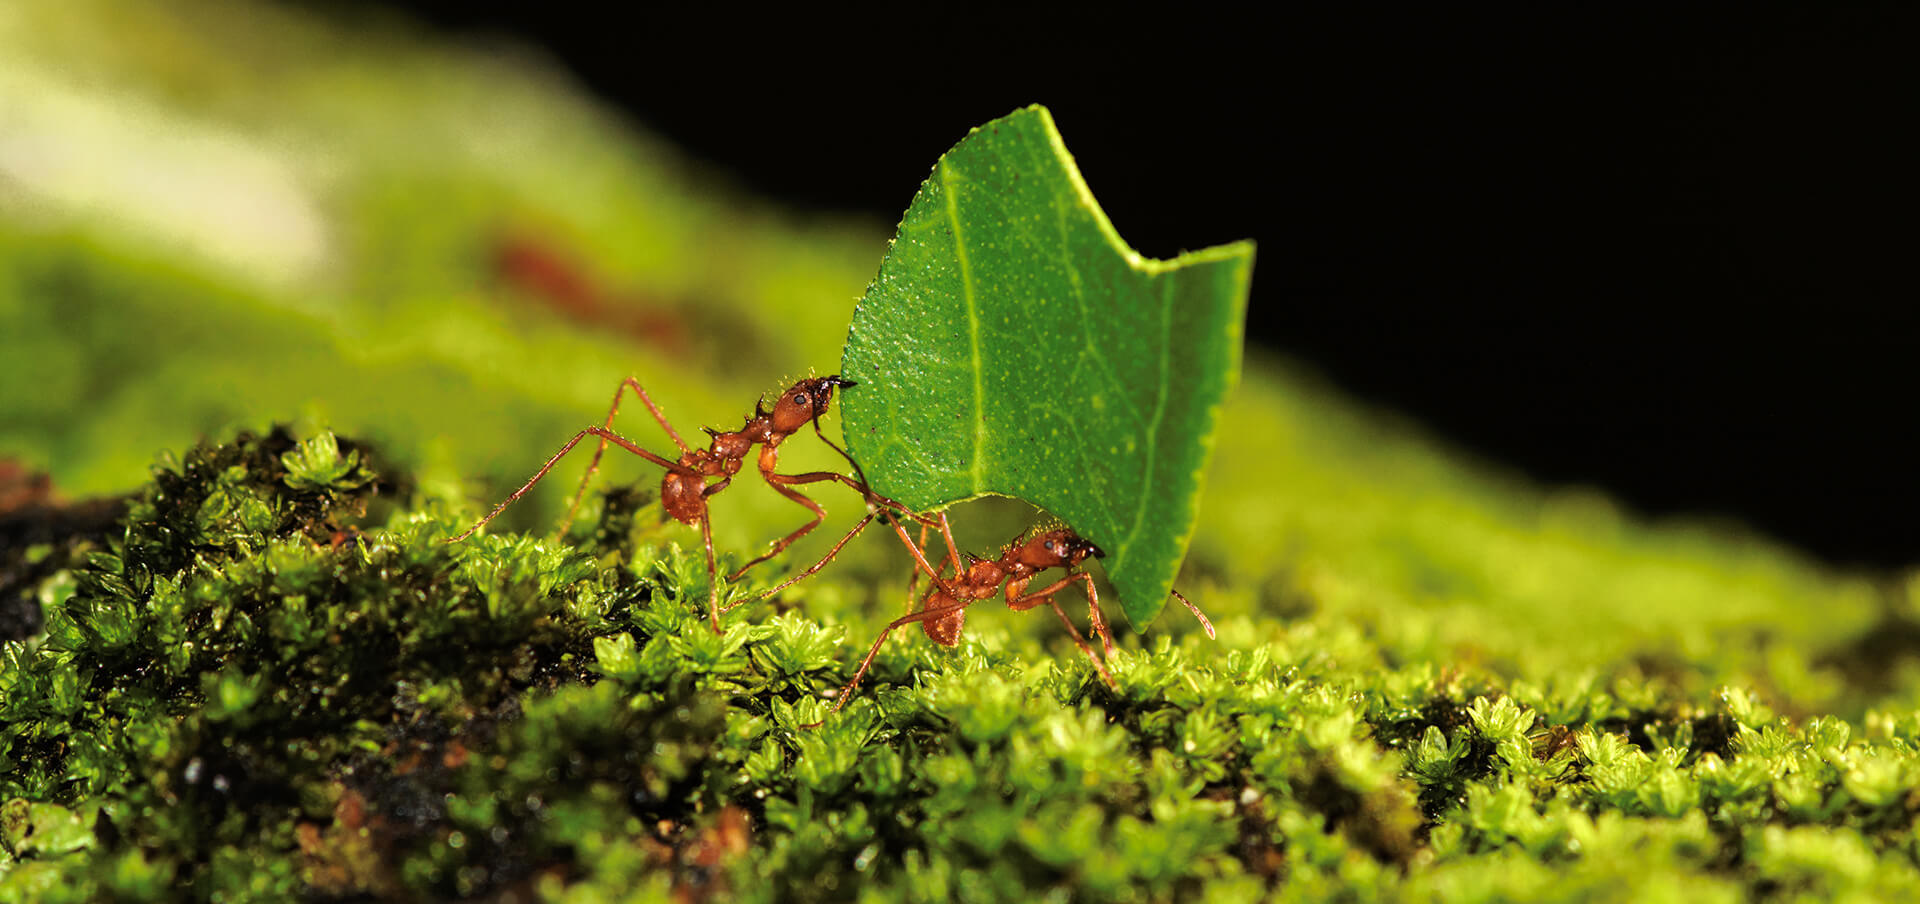
Leaf cutters build farms where they grow mushrooms on a substrate of chewed leaves.
Ants have to travel a lot, since they live at one point (anthill), and they get food where they find it. When the ant finds a large source of food, it paves the chemical route from home to food, which can be followed by its relatives. The flux density strongly depends on the number of individuals in the anthill, and can reach several hundred ants per minute. In this case, no traffic jams, no accidents and call insurers. The stream moves continuously, and the ants continue to carry out their duties efficiently (workers get food, and soldiers guard them).
Researchers remind us that in road construction, the relationship between the density of people ( k ) and flow ( q = vk , i.e. speed times density) is often described using fundamental diagrams ( 1A ).

Image No. 1
There are differences between the velocity-density diagrams and flow-density diagrams depending on the system under consideration, but they have fundamentally common features in the root.
Firstly, the flow q increases with density k from zero to the maximum value, and then damps until it returns to zero at the so-called maximum mash density kj . The flux-density curves, as a rule, have a concave shape with an optimal value of k in the way in which the maximum flux or number is achieved.
Secondly, the individual’s speed will be maximum if he moves alone (free flow velocity vf ) and decreases with increasing density k . When the mash density reaches v ( kj ) = 0, the speed drops to zero, i.e. all participants in the movement stop.
Similar calculation methods have been repeatedly applied to ants. For example, in leaf-cutting ants and fire ants, the speed of movement decreases with increasing density, while in forest and nomad ants, with increasing density, the speed remains constant.
The highest density, as well as the estimated employment (the fraction of the area covered by ants) recorded by leaf-cutting ants, tree and nomad ants were relatively low: 0.8 / cm 2 (employment 0.20), 0.6 / cm 2 (0.13) and 0.3 / cm 2 (0.10). Such indicators are not high enough for a cork to form, since the ants never exceeded the boundary capacity of the movement path, they adhered to the maximum permissible flow value corresponding to the width of the path.
In the study we are considering today, scientists decided to check whether ants can avoid the formation of plugs at different flux densities. The main characters were ants of the species ( Linepithema humile - Argentinean ants). This species is one of the most numerous and widespread in the family.
A colony of ants was connected to the location of food through a bridge ( 1B ), the width of which varied (5, 10 and 20 mm), which in turn made it possible to manipulate the flow density. Several colonies of different numbers took part in the experiments: from 400 to 25,600 ants. A total of 170 experimental observations were carried out, during which per second flow and density were fixed. The ability to change the width of the bridge from the colony to food made it possible to obtain a variety of indicators of flux density (from 0 to 18 ants per cm 2 ) and employment (from 0 to 0.8).
Experiment Results
Before analyzing the data of all 170 experiments, scientists made sure that these data were not distorted. Firstly, it was found that the number of ants entering the food zone did not affect feeding behavior. Most ants ate once, which eliminates the presence of negative feedback, which could be due to the large concentration of individuals at the feeding site. Secondly, scientists controlled that the width of the bridge did not affect the speed of ants. In the absence of interactions, and in cases where the ants traveled alone, their speed was the same regardless of the width of the bridge.

Image No. 2
The first step was to study the movements of ants at a macroscopic level. A flow of q ants moving in both directions was depicted as a function of density in Figure 2A . The flux q increased with a density k to a certain point, and then remained constant.
Graph 2B shows an analysis of the relationship between k and q , performed using three different macroscopic functions of the movement of ants along a given route. All function parameters were selected using the least squares method * .
The least squares method * is a mathematical method based on minimizing the sum of the squared deviations of some functions from the desired variables.Based on the experimental data, a two-phase flow function was created to describe the q - k ratio as a piecewise linear function * with a linearly increasing flow and with a constant value of the flow at the moment the mash density is reached.
A piecewise linear function * is a function defined on a set of real numbers, linear on each of the intervals that make up the domain of definition.The two-phase flow function is as follows:
q (k) = kV if k ≤ kjand
q (k) = kjv if k ﹥ kjNext, a statistical model was selected, which made it possible to assign conditional probabilities for all statistical models. A large amount of data made it possible to obtain an unambiguous result - a two-phase statistical model ( 2C ).
So, the answer to the question why ants do not get stuck in traffic jams can be spatio-temporal flow organization at high density.
A stream is called spatially organized when both lanes of ants do not intersect completely and are separated in space. Temporary organization occurs when oscillatory changes occur in the direction of movement, from which the flow periodically becomes unidirectional, i.e. the direction of movement alternates.
In both cases of the organization of movement, there is a restriction of contacts between ants (collisions), which allows ants to maintain an uninterrupted flow.
However, in the experiments conducted by scientists, these types of organization were not observed. When the density of ants reached a critical threshold, the incoming and outgoing flows mixed both in time and in space ( 3A ).

Image No. 3
In addition, contrary to the laws of pedestrian traffic, the dependence between the density k and the flow q only slightly affected the degree of asymmetry of the flows ( 3B ). That is, the flow did not increase faster with a density k when the movement was mostly unidirectional than when it was completely bidirectional.
Ants move along a bridge 20 mm thick. This video captures the movement of ants 10 minutes after establishing a connection between the habitat zone and the food zone.
Ants move along a bridge 5 mm thick. This video captures the movement of ants 10 minutes after establishing a connection between the habitat zone and the food zone.
Given the ambiguity in the aspects of organizing the flow as a whole, the researchers decided to follow in the footsteps of Hercule Poirot, that is, carefully consider the details, namely the behavior of individual ants in the flow.
From the point of view of individual behavior, most functions of a moving stream suggest that individual speed will decrease non-linearly with density due to “friction” between individuals.
However, the two-phase flow motion function assumes that such friction between ants was not detected when the density was below 8 ants per cm 2 , i.e. the flow increased linearly. When the density was higher than 8, friction arose, but increased linearly with the density, i.e. the flow remained constant over a wide range of densities. Therefore, it is necessary to somehow measure and analyze the friction that arises.
The most important factor affecting the speed of a single ant is the number of contacts (collisions) with its relatives, which make it stop, thereby reducing its overall speed.
To establish whether the number of contacts plays the role of a hidden variable linking density and speed, scientists conducted an experiment in which they measured the number of contacts C , density k and the passage time T of a bridge 2 cm long. The data of all individual ants from a colony of 7900 individuals were taken into account.

Image No. 4
As the density k increased, the number of contacts C increased linearly ( C = 0.61 k , 4A ), i.e. the higher the density, the more contacts were observed. A linear effect of the number of contacts C on the travel time T was also found - each contact really slowed down the ants ( N = T 0 + C · ∆ T , where T 0 = 0.95 s and ∆ T = 0.24 s, 4 V ). The variable T 0 represents the time taken to complete the bridge without contacts, and ∆ T is the time lost due to the contacts.
The intermediate conclusion was that the density had a negative effect on the flow rate: the density increased the number of contacts between individuals, which increased ∆ T and, consequently, the time required to pass the bridge. And this is quite logical, however, during phase No. 1, the situation was a bit more interesting.
In the diagram of two-phase motion, the density k had no effect (or practically no) on the speed v . Therefore, in this phase there should be a positive influence of the density k on the velocity v . Thus, the connection between T , k and C is much more non-standard.
To combine several effects, the expected travel time T was estimated depending on the density k and the number of contacts C. For the number of contacts C established by scientists, the average transit time T ( 5A ) was calculated for different density values k .

Image No. 5
The vertical distance between adjacent curves was determined by the value of ∆ T. As expected, the transit time T increased with an increase in the number of contacts C , but a curious observation was that initially the density k actually led to a decrease in the transit time T (to k ≈ 5).
To further confirm this positive density effect, the free-stream velocity vf was estimated, i.e. without any contacts ( 5V ): vf = L / ( T - C · ∆ T ), where L = 2 cm (the section of the bridge on which the observations were made).
The vf index initially increases with a density of up to 5 ants per cm 2 , and then returns to its original value. The explanation of such fluctuations lies not in mathematics, but in biology. Argentinean ants use pheromones, which mark their path so as not to get lost and show the way to their relatives for food or home.
Combining all the effects together, scientists proposed their own formula for the speed of ants:
v ( k ) = [ L / T 0 + ∆ T · C ( k )] · (⍺ + β · k · e - γ · k )C ( k ) is the average number of contacts equal to 0.61 k ;
⍺, β and γ - simulate the pheromone effect: ⍺ - corresponds to the internal attractiveness of a bridge not marked with pheromones; β - represents a positive effect k ; γ is the range in which the pheromone effect can occur. These three parameters were estimated using the nonlinear regression algorithm: ⍺ = 0.812 ± 0.009, β = 0.160 ± 0.010, γ = 0.156 ± 0.007.

Image No. 6
With an increase in k , a decrease in the velocity v ( 6A ) was observed. For this velocity dynamics, the following formula was allocated for the entire flow:
q ( k ) = kv ( k )On graph 6B, a predicted flux q is constructed, for the estimation of which the data of experimental observations were used ( N = 7900 observations). A clear agreement was found between the model and the experimental data. The function constant was achieved at q ≈ 10 ants per cm 2 per second.
Despite the fact that as the density k increased, more contacts appeared that increased the travel time T , which negatively affected the flux q , at a density of <5 ants per cm 2 individuals moved faster, which positively influenced the flux.
These two effects are balanced, which leads to a linear increase in the flux q with density k (phase 1). When the density was more than 8 ants per cm 2 , despite the overflow of the route (bridge), the ants maintained a constant flow q . The speed v ( k ) continued to decrease due to an increase in contacts, but this negative effect on the flux q ( k ) was compensated by an increase in k .
In other words, the flux in graph 6B will increase at high densities k . However, experimentally, the flow would ultimately have to decrease, since the occupation (occupancy of a certain area) of ants on the bridge cannot increase indefinitely.
Given that the area of the bridge unoccupied by ants decreased with increasing density, it is surprising that the number of contacts increased exclusively linearly with density.
An even more curious observation is the exposure of ants. They restrained themselves from leaving the colony and going to food in order to avoid overflowing the bridge. So, during the entire study, the density did not exceed 18 ants per cm 2 , despite the fact that scientists increased the number of colonies and reduced the width of the bridge. In addition, ants already on the bridge rarely turned 180 ° (the probability was 0.01).
For a more detailed acquaintance with the nuances of the study, I recommend a look at the report of scientists .
Epilogue
Naturally, people and ants, in spite of the social nature of both of them, are much different. Traffic jams in the world of people are formed from people (on foot or by car), who are each in a hurry about their business. While ants from one colony always have one common goal. In addition, external factors, which ants can very effectively avoid, are a very common cause of corking. Not to mention the fact that they always leave a trace of pheromones, which makes it easier to find a way for their relatives. It is also worth noting that ants are not particularly afraid of collisions with each other, unlike us. And they are ready to stay in the colony, so as not to create a traffic jam, thereby putting in the first place not personal goals, but the needs of the colony. This, unfortunately, is also extremely rare for people.
The way ants deal with congestion is a great example of their incredible organization - the biological feature that evolution has endowed them with, making them one of the most successful living organisms on the planet.
Friday off-top:
To build a bridge without building materials at hand for this type of ants is not a problem. Team work in its purest form :)
To build a bridge without building materials at hand for this type of ants is not a problem. Team work in its purest form :)
Off Top 2.0:
An amusing public transport operator in Belgium showing strength in unity and teamwork.
An amusing public transport operator in Belgium showing strength in unity and teamwork.
Off-top 3.0 (yes, there aren’t many off-tops):
True facts about ant symbiosis (the presence of black humor does not cancel the fact of truth of the facts :)).
True facts about ant symbiosis (the presence of black humor does not cancel the fact of truth of the facts :)).
Thank you for your attention, stay curious and have a great weekend everyone, guys! :)
Thank you for staying with us. Do you like our articles? Want to see more interesting materials? Support us by placing an order or recommending it to your friends, a 30% discount for Habr users on a unique analog entry-level server that we invented for you: The whole truth about VPS (KVM) E5-2650 v4 (6 Cores) 10GB DDR4 240GB SSD 1Gbps from $ 20 or how to divide the server? (options are available with RAID1 and RAID10, up to 24 cores and up to 40GB DDR4).
Dell R730xd 2 times cheaper? Only we have 2 x Intel TetraDeca-Core Xeon 2x E5-2697v3 2.6GHz 14C 64GB DDR4 4x960GB SSD 1Gbps 100 TV from $ 199 in the Netherlands! Dell R420 - 2x E5-2430 2.2Ghz 6C 128GB DDR3 2x960GB SSD 1Gbps 100TB - from $ 99! Read about How to Build Infrastructure Bldg. class c using Dell R730xd E5-2650 v4 servers costing 9,000 euros for a penny?