To obtain these characteristics, it is necessary to record the effect of the ESS signal on the tested device and find the mutual correlation function of the recorded signal with the original ESS signal, but modulated in amplitude (for more details, see A. Farin's publications).
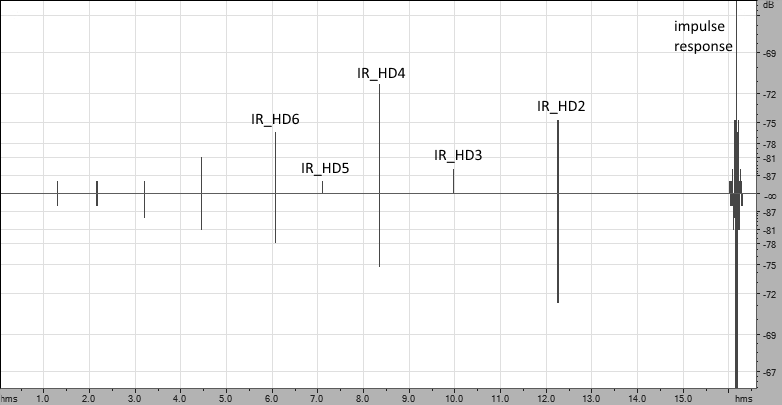
The result is a set of impulse characteristics (IM), the last of which is a linear impulse response of the device. It is preceded by the impulse response of the quadratic nonlinearity of the device, before it is the impulse response of the cubic nonlinearity, etc. In practice, it is possible to fix non-linearities of up to 20 order.
This feature (separation of nonlinearity products from linear impulse response) is a unique advantage of the ESS method compared to other methods. The ESS method has other advantages:
- Increased resistance to random noise. This is because the harmonic signal “scans” a very narrow frequency gap at each time interval, which allows us to reduce the level of random noise in the resulting impulse response. The longer the ESS signal, the more noticeable is the effect of noise reduction.
- Ease of use. The whole decoding procedure is reduced to several calculations using the FFT method.
- Ability to automate the measurement process.
The location of the distortion characteristics relative to the linear impulse response can be found by the following rule: if the frequency of the ESS signal grows at a speed of 1 octave per second, then the second-order nonlinearity characteristic will be located 1 second before the linear impulse response; 4th order nonlinearity characteristic will be located 1 second before 2nd order characteristic, etc.
Despite the obvious advantages, the ESS method has its own limits of application. The author of the method himself lists the following restrictions:
- The resulting impulse response, as well as its frequency response, has noticeable unevenness (“ringing")
- The method is sensitive to instability of the time axis.
To reduce the frequency response unevenness and impulse response A. Farina suggests modulating the beginning of the ESS signal in amplitude (fade-in), as well as applying various filtering techniques.
Another enthusiast, Katja Vetter, in his research, discovered another problem related to the fact that each octave of the signal does not start in the zero phase. This imposes an error on the measurement of harmonics. As a solution, the author proposed a new approach to the formation of an ESS signal: each octave should begin with a zero phase.
Practical examples of the application of the ESS method.
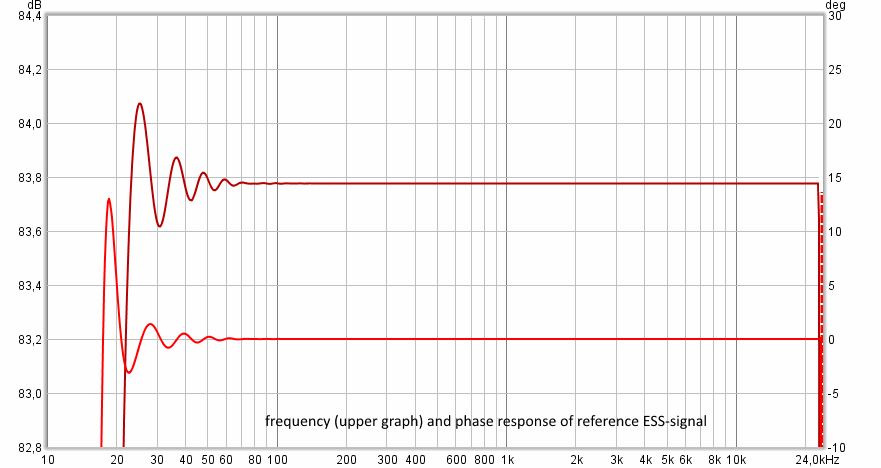
By selecting and modeling in MATLAB, an ESS signal was generated with a duration of 43 seconds, a range of 11 octaves (11.7-24000 Hz), with amplitude modulation of the signal edges. This made it possible to obtain a frequency response unevenness <0.2dB at the edges of the measurement range (22 and 23000 Hz) and a relative error level <-140dB.
Measurement of the characteristics of the equalizer cell (frequency corrector).
The ESS method turned out to be very useful when setting up an equalizer assembled on operational amplifiers. The scheme showed instability, the cause of which was difficult to analyze. ESS-method was able to determine that the device had increased non-linear distortion in the frequency range of the equalizer.

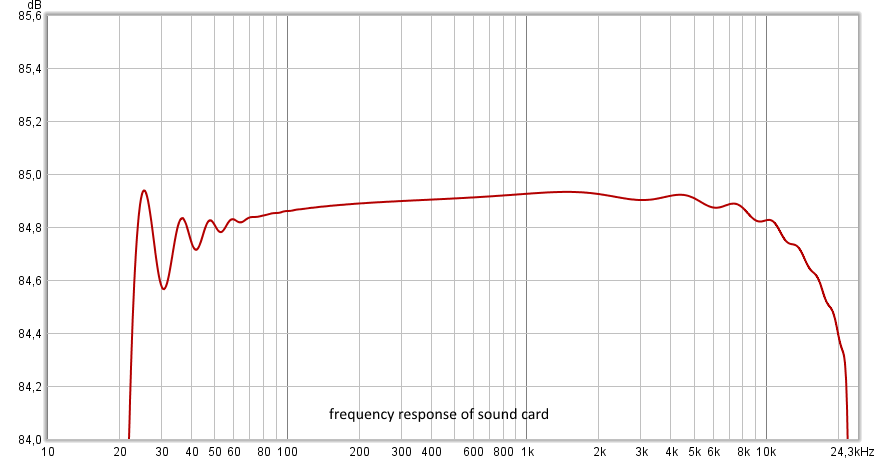
Measurement of the characteristics of a computer audio card.
In this example, the output of the audio card was connected to the input and the through frequency response of the device was measured. As you can see, some unevenness (in the region of 20-60 Hz) is associated with the error of the ESS method itself. The rest of the contribution to the unevenness relates to the audio card.
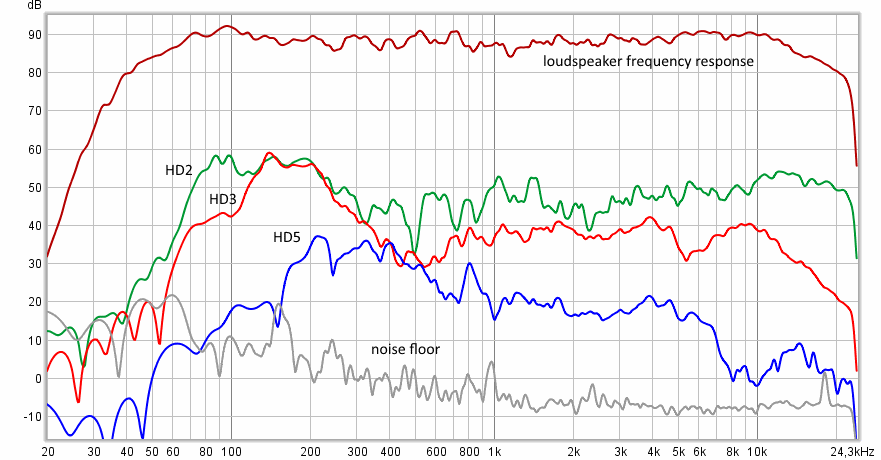
Loudspeaker Acoustic Measurement
This example shows measurements of the frequency response of studio monitors in the near field. In this case, the signal-to-noise ratio was 90 dB, while the measurements were made in a studio room with a moderate sound pressure level (not more than 90 dB SPL).
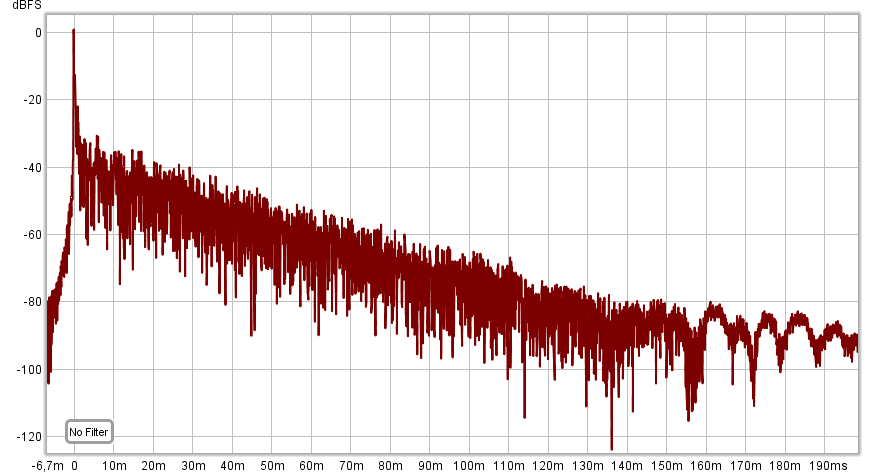
The envelope of the measured impulse response of the studio monitor (it can be seen that the dynamic range of measurement was 90dB).
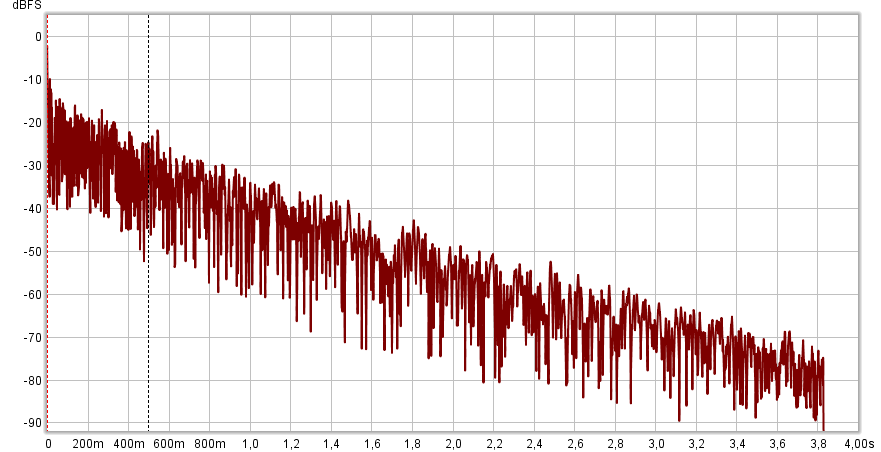
Measurement of acoustic characteristics of the room
This example shows the envelope of the impulse response of a room. The reverberation time was 3.8 seconds. As you can see, the energy decays evenly and without bursts up to the lowest levels.
The method proposed by A. Farin allows high-precision measurements of electronic and electro-acoustic devices, as well as the acoustic properties of the premises. It is known that this method has been successfully applied in acoustic measurement programs such as CLIO and REW .
Useful links:
- Simultaneous measurement of impulse response and distortion with a swept-sine technique
- Advancements in impulse response measurements by sine sweeps
- Impulse response measurement with sine sweeps and amplitude modulation schemes
- Optimizing the exponential sine sweep (ESS) signal for in situ measurements on noise barriers