Playing with complex numbers
Hello!
Another essay. This time let's play with complex numbers, with formulas and their visualization.
A complex number is a certain extension of a real number, in fact a vector for which a whole set of axioms is defined. Any complex (and hence real) number can be written as , where a is the real part, b is the imaginary part, i is the root of the equation . For him, many operations are defined that are defined for a real number, for example, . Interestingly, if you do various operations with them, raise to a power, multiply, etc., and then take (real part) for the axis Ox, and (imaginary part) for the Oy axis, you can get funny pictures.
By the way, I myself came up with all the following formulas.
Routine. The function, which according to this iterative function draws everything on the field:
All our functions depend on two parameters A and B. Moreover, we iterate over B inside vis (), and A is the global parameter of the function.
Her declaration in python:
And run
And the result for A = 121.5:

And for A = 221.5:
Note that these numbers do not follow from the calculation of any definite integral on a smooth manifold and other smart words meaningless in this context. These are really random numbers, and there is still exactly infinity of different A, as a result of which beauty is obtained.
We declare a color function (such a function that returns a tuple of three numbers in coordinates):
Choose random parameter A, let it be 149:

Geese are described as follows:
Python declaration:
Its result for A = 106:


That's all for now.
Another essay. This time let's play with complex numbers, with formulas and their visualization.
Idea
A complex number is a certain extension of a real number, in fact a vector for which a whole set of axioms is defined. Any complex (and hence real) number can be written as , where a is the real part, b is the imaginary part, i is the root of the equation . For him, many operations are defined that are defined for a real number, for example, . Interestingly, if you do various operations with them, raise to a power, multiply, etc., and then take (real part) for the axis Ox, and (imaginary part) for the Oy axis, you can get funny pictures.
By the way, I myself came up with all the following formulas.
Visualization function
Routine. The function, which according to this iterative function draws everything on the field:
import random import numpy as np def vis(A, f, step=1.0, c=None): x = [] y = [] for B in np.arange(0, A, step): v = f(A, B) x.append(v.real) y.append(v.imag) plt.figure(figsize=[8, 8]) mxabs = max([i[0] ** 2 + i[1] ** 2 for i in zip(x, y)]) ** 0.5 x = np.array(x) / mxabs y = np.array(y) / mxabs if c is None: plt.scatter(x, y) else: plt.scatter(x, y, color=[c(x[i], y[i]) for i in range(len(x))]) plt.show()
All our functions depend on two parameters A and B. Moreover, we iterate over B inside vis (), and A is the global parameter of the function.
The Curl Function
Her declaration in python:
def func_1(A, B): return math.sin(B) * B * math.e ** (1j * (B * math.cos(A)))
And run
A = 121.5 vis(A, func_1, step=0.1)
And the result for A = 121.5:
And for A = 221.5:
Note that these numbers do not follow from the calculation of any definite integral on a smooth manifold and other smart words meaningless in this context. These are really random numbers, and there is still exactly infinity of different A, as a result of which beauty is obtained.
Need to paint
We declare a color function (such a function that returns a tuple of three numbers in coordinates):
def sigm(x): # 0 1 return (1 / (1 + 1.2 ** (-x*50)) - 0.5) * 2 color_1 = lambda x, y: (0.2, sigm(x ** 2 + y ** 2) / 1.4, 1 - sigm(x ** 2 + y ** 2)) color_2 = lambda x, y: (sigm(x ** 2 + y ** 2), 0.5, 0.5)
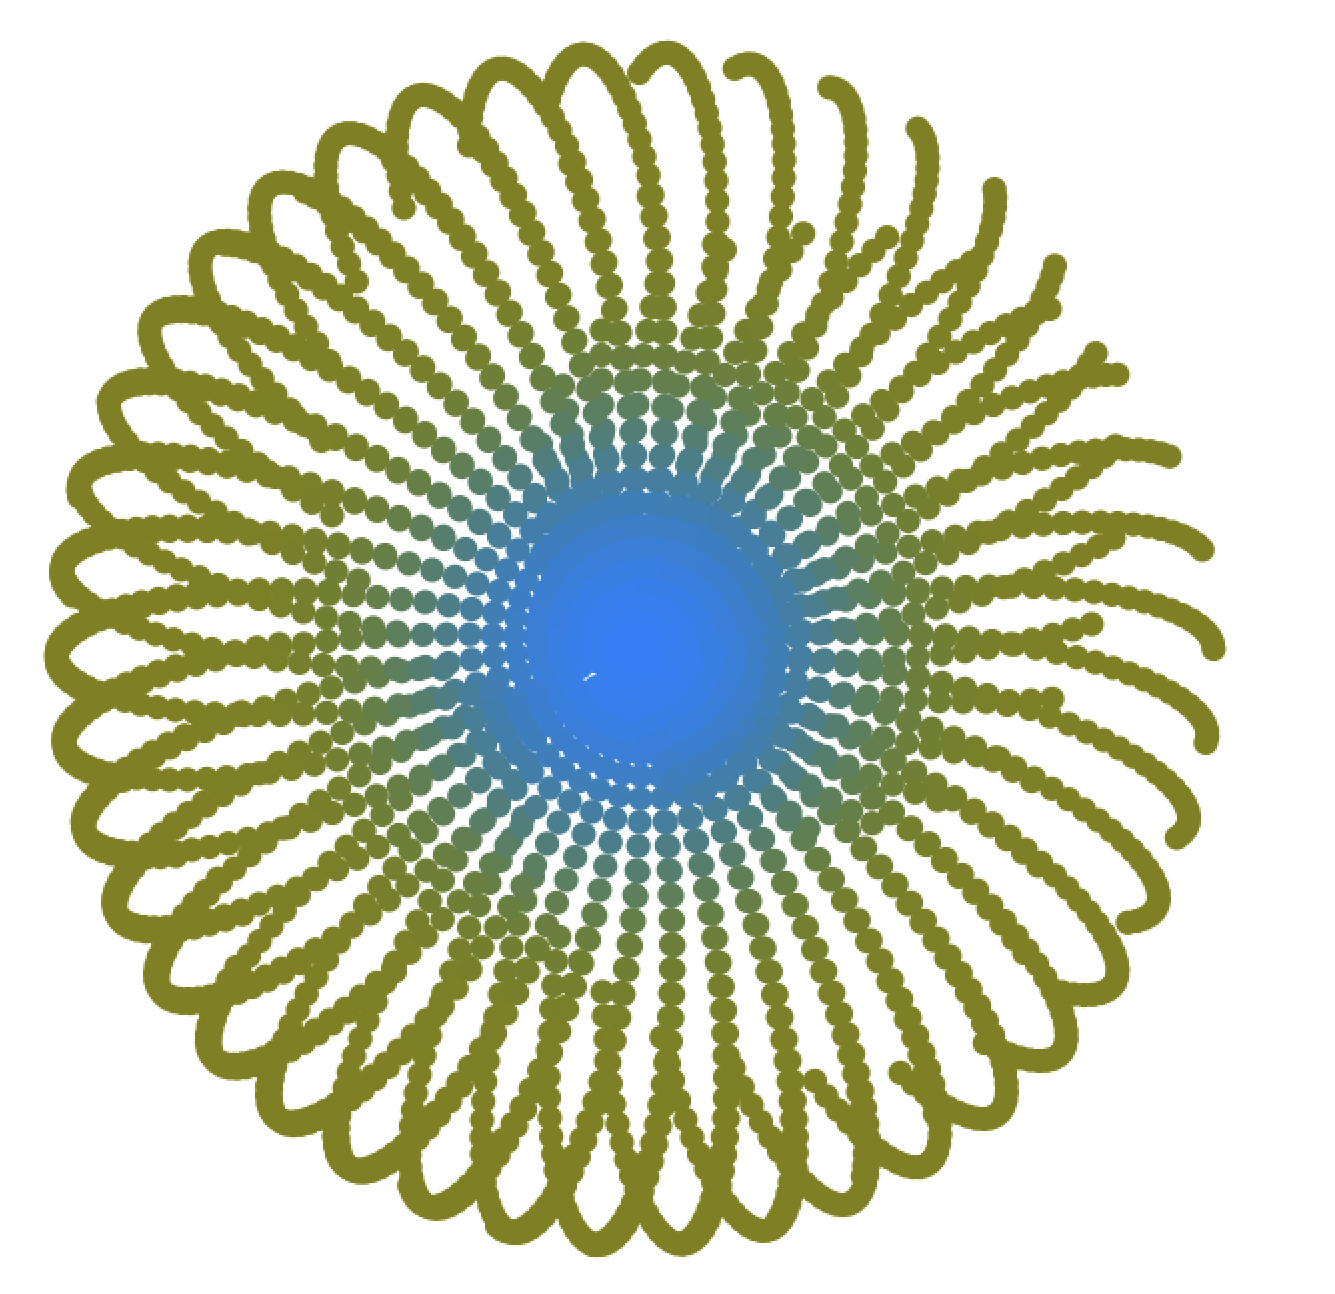
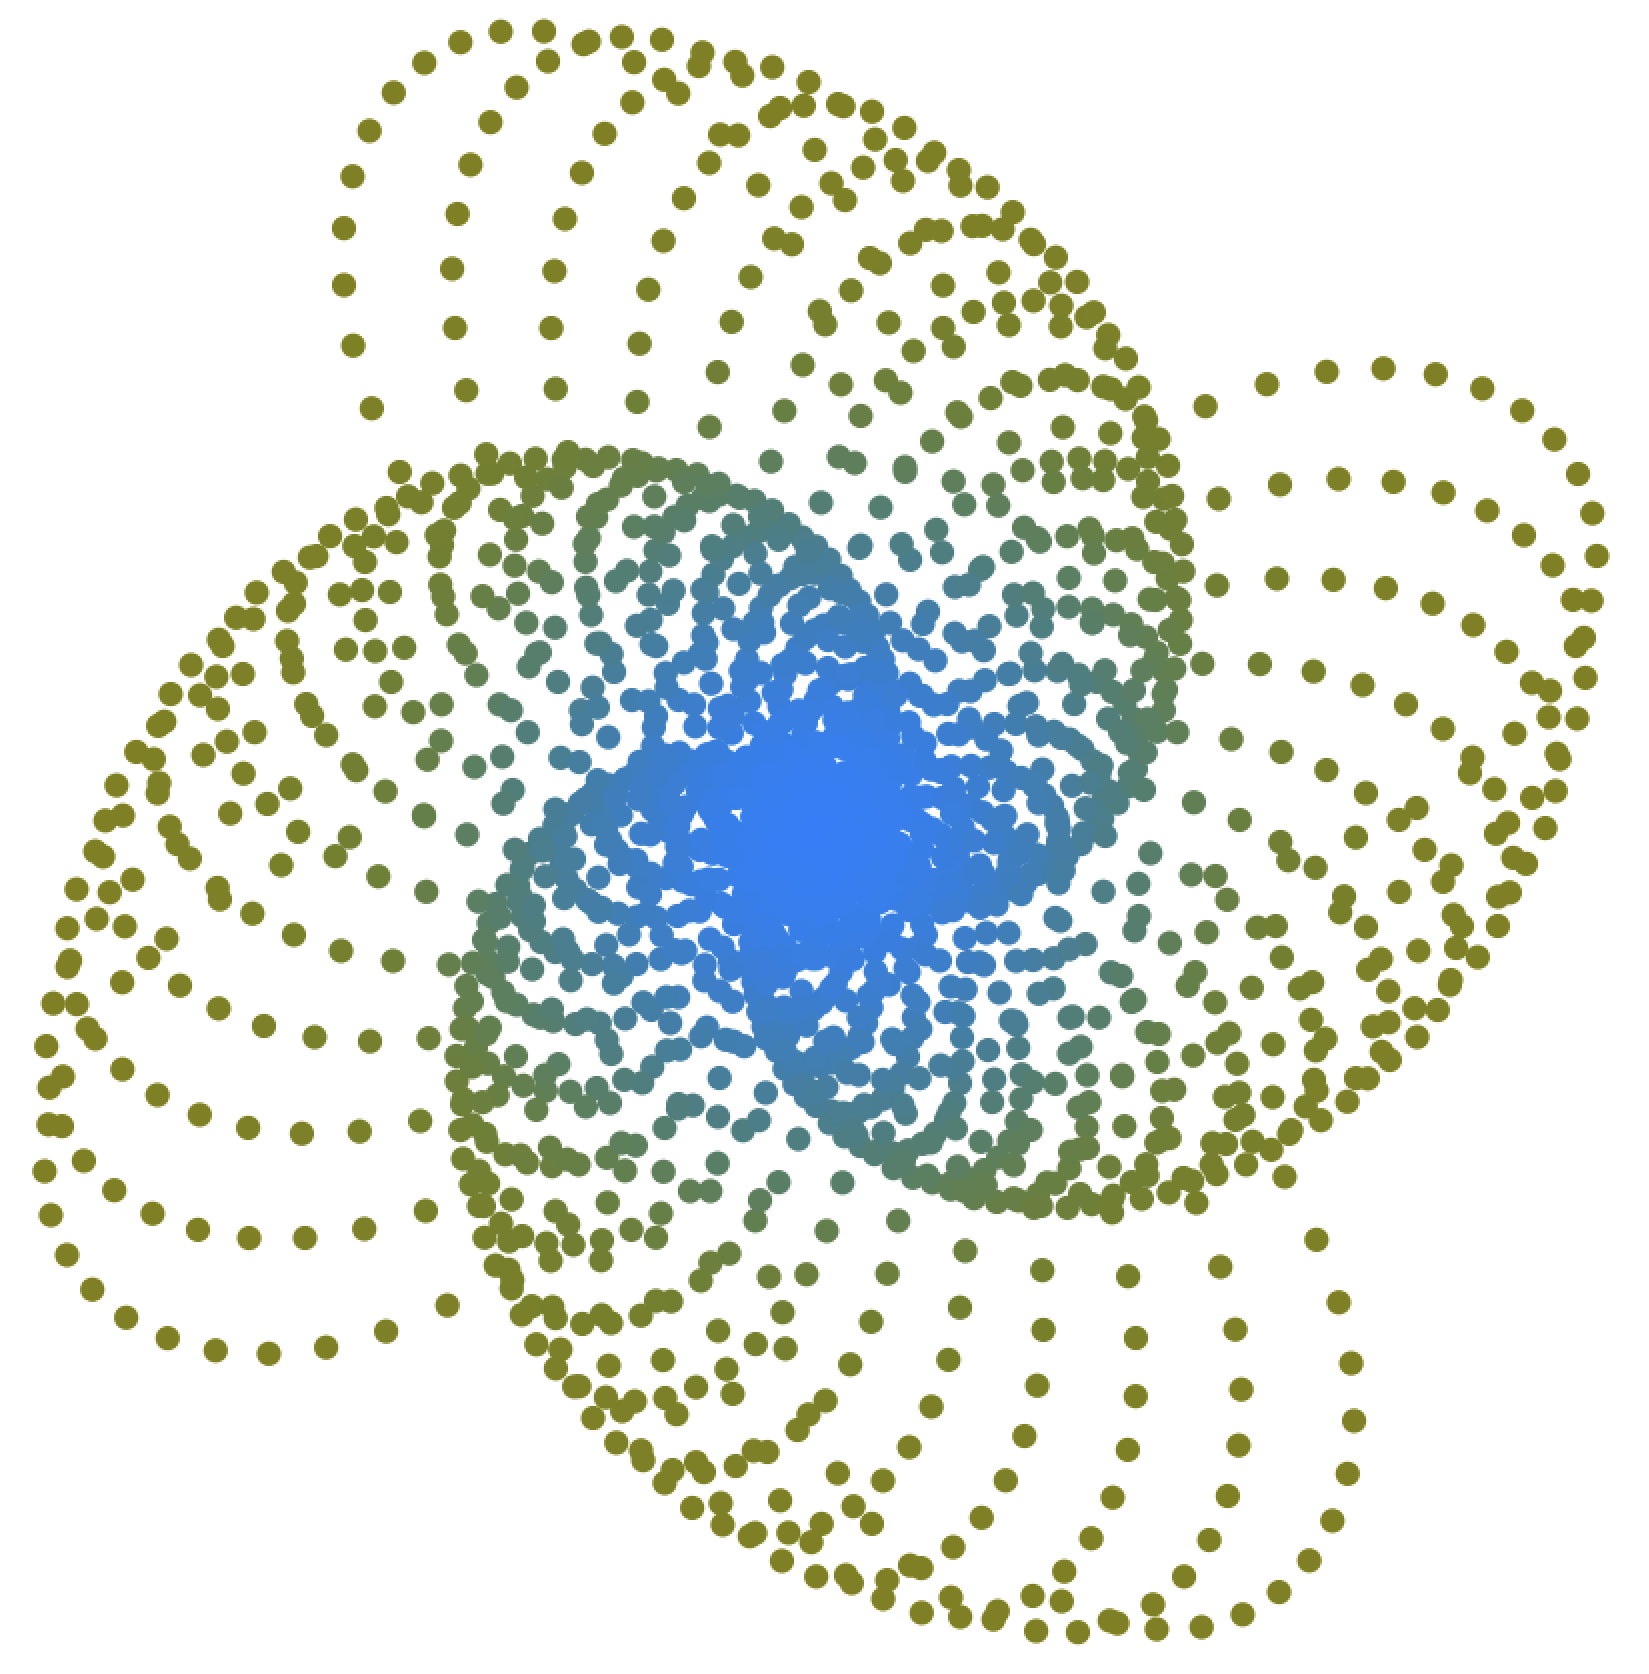
Choose random parameter A, let it be 149:
vis(149, func_1, step=0.1, c=color_1)
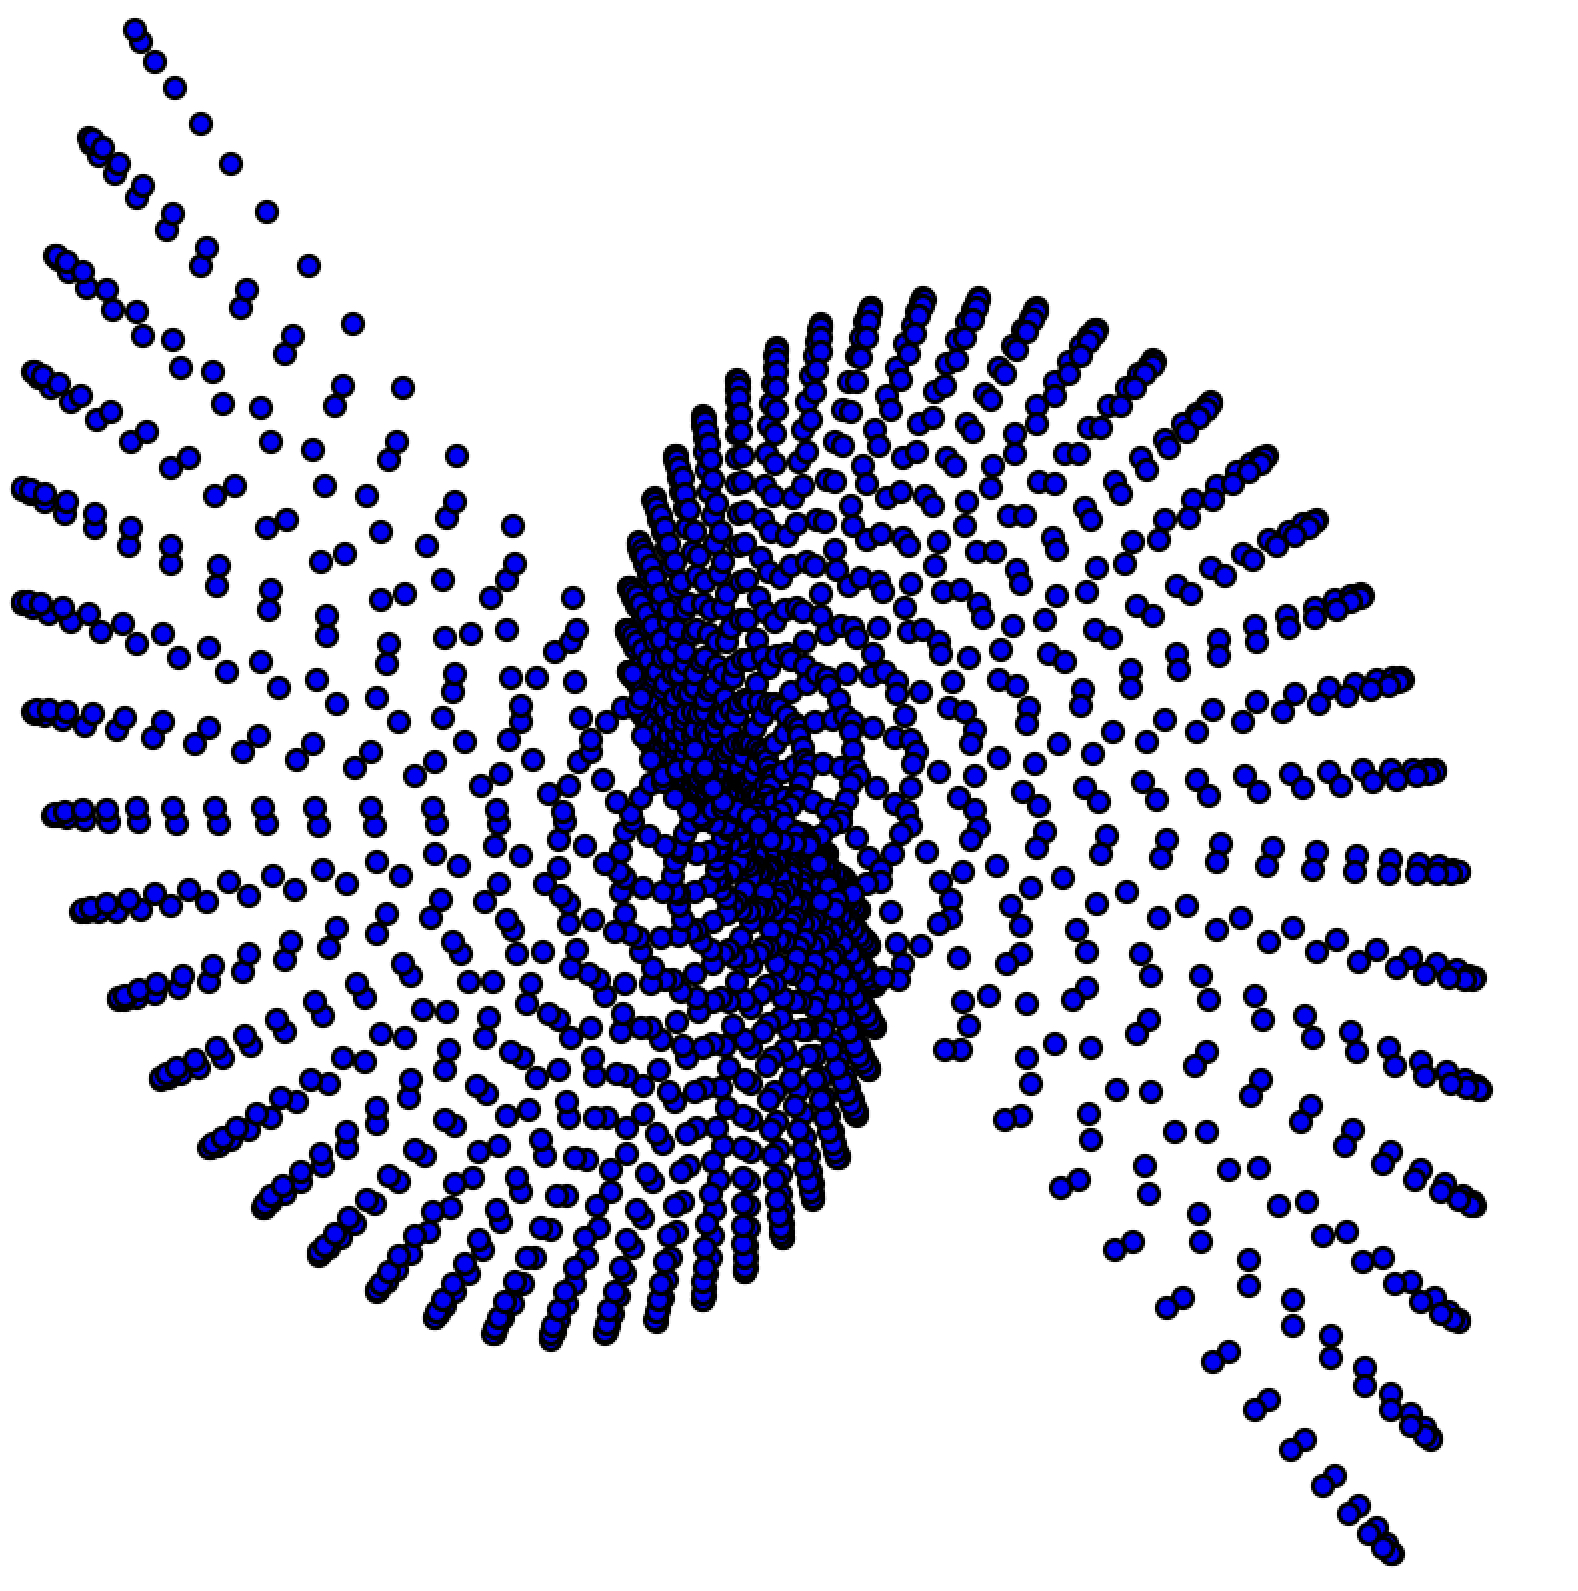
Geese Function
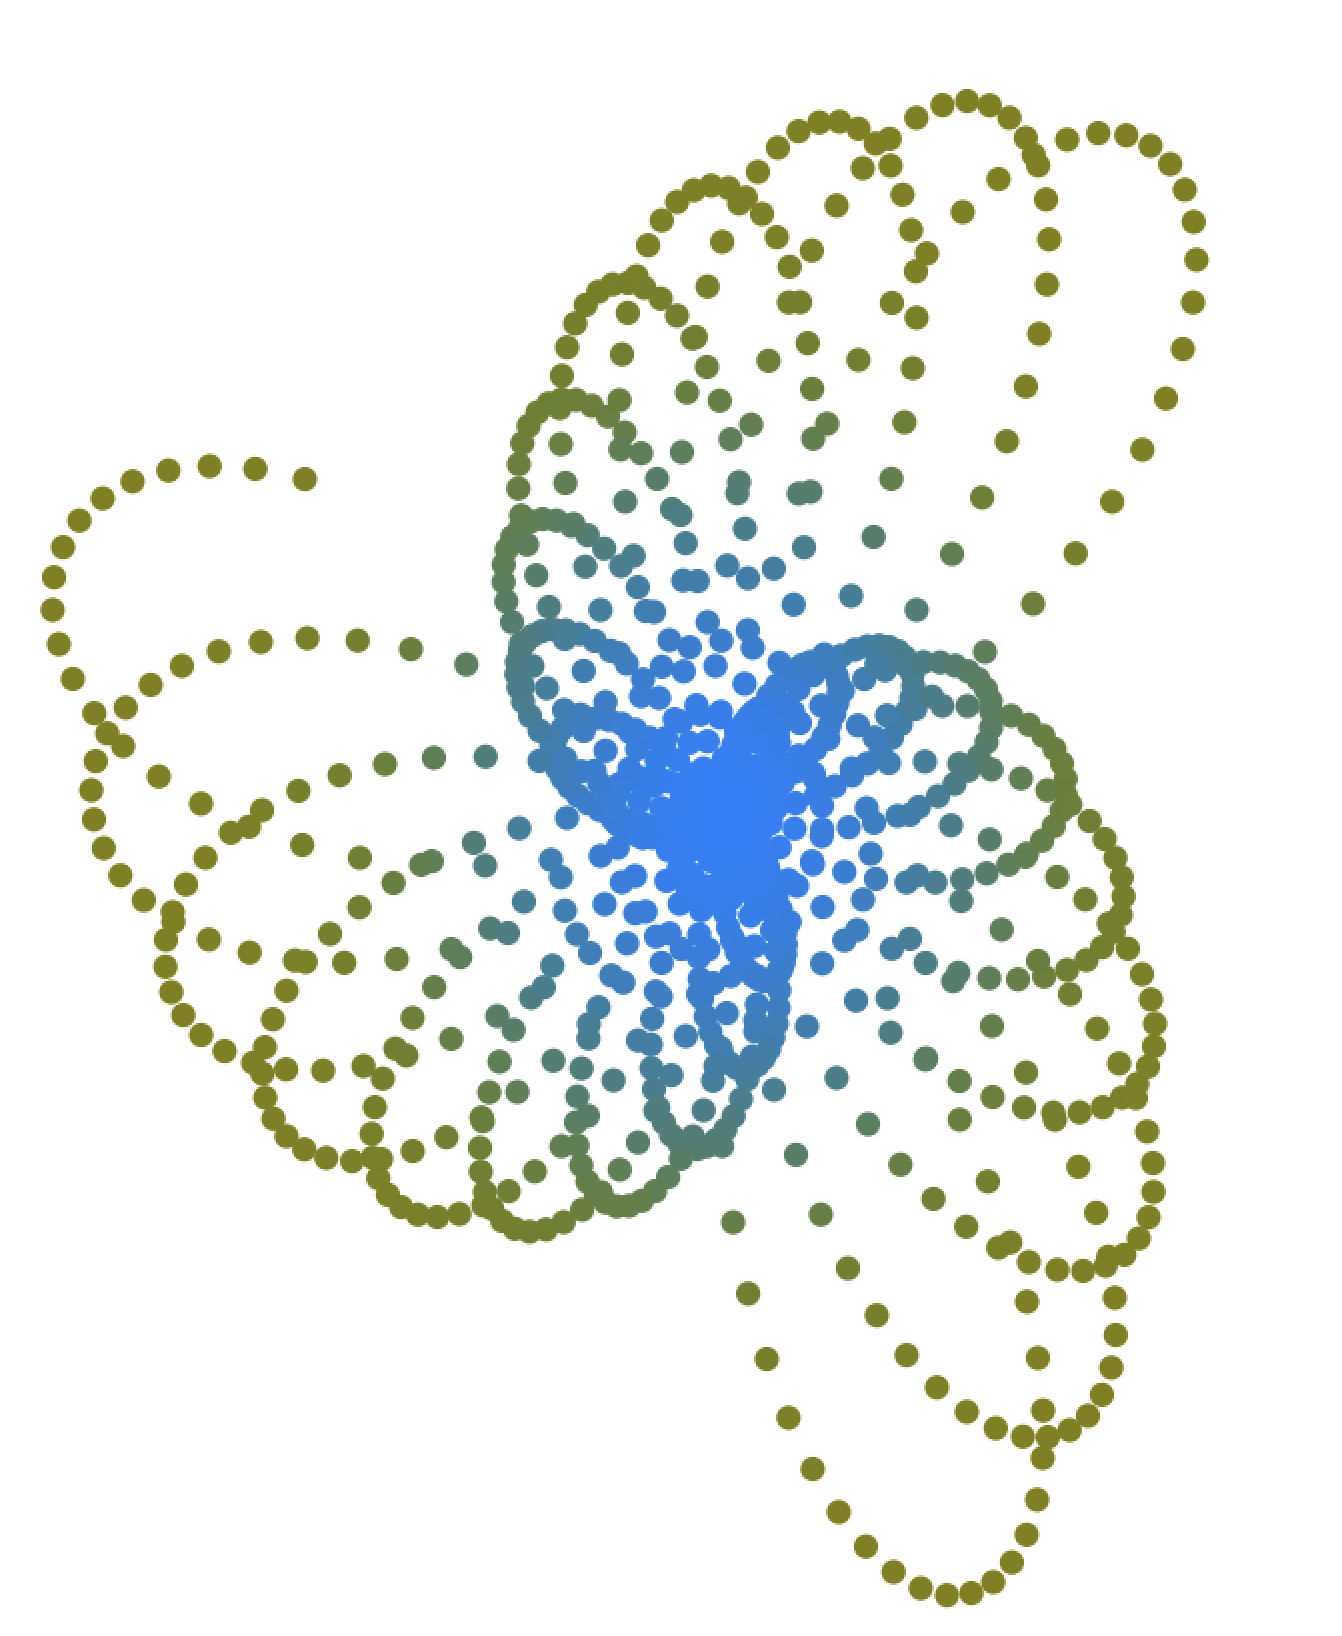
Geese are described as follows:
Python declaration:
def func_2(A, B): return math.cos(B) * math.sin(B) * B * math.e ** (1j * (B * math.cos(A)))
Its result for A = 106:
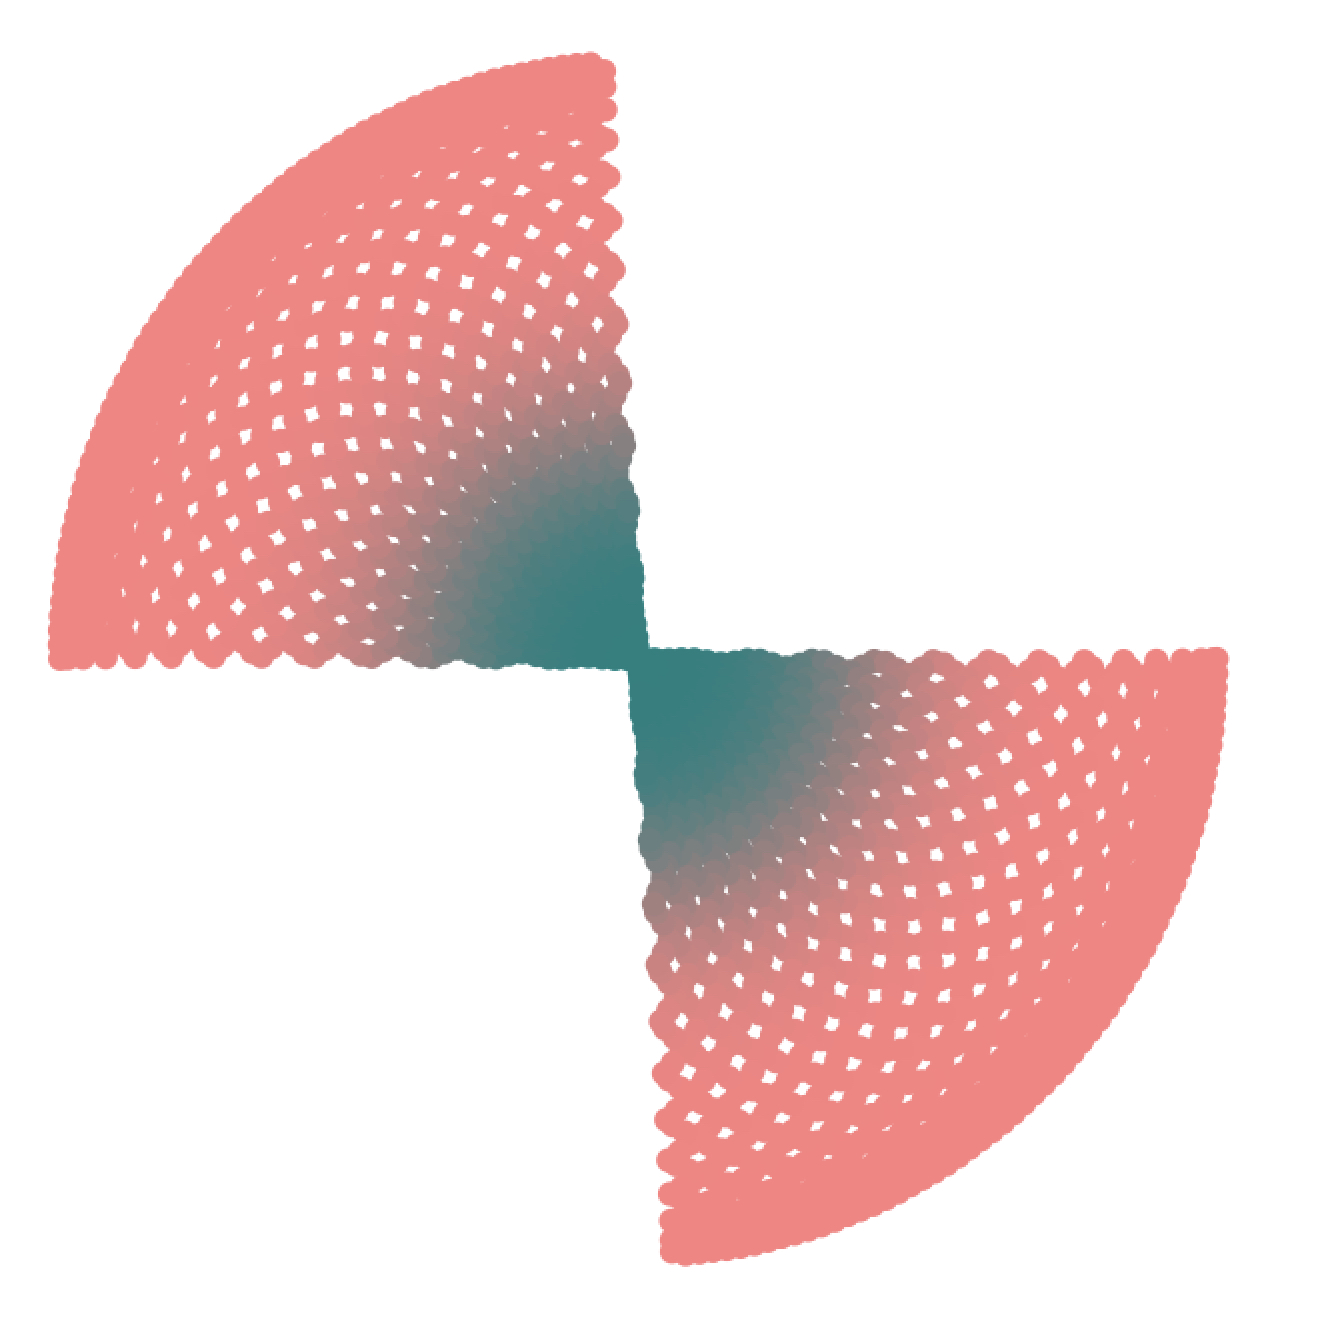
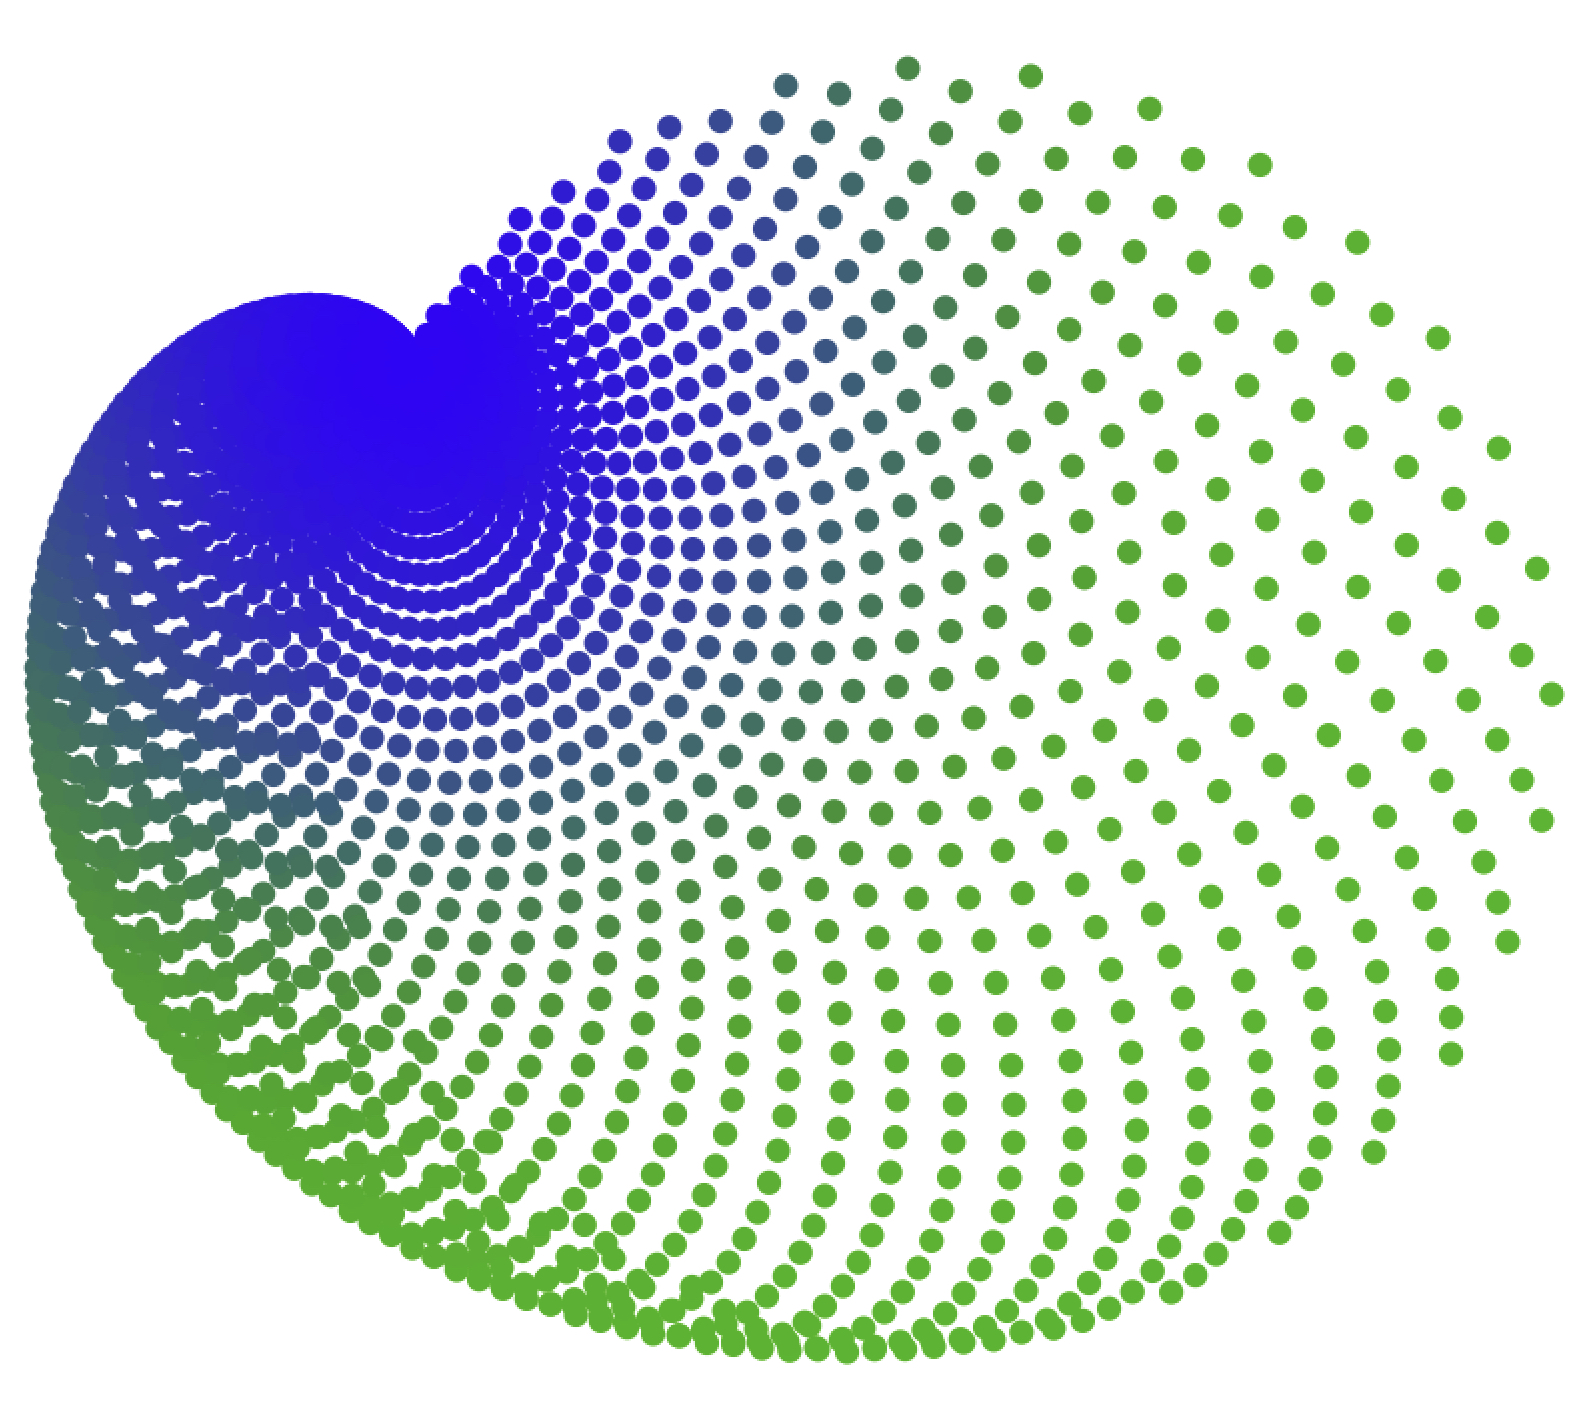
Focaccia function
def func_3(A, B): return math.cos((A + 1) * B) * math.e ** (1j * (B * math.cos(A)))
vis(246, func_3, step=0.1, c=color_2)
vis(246, func_3, step=0.1, c=color_2)
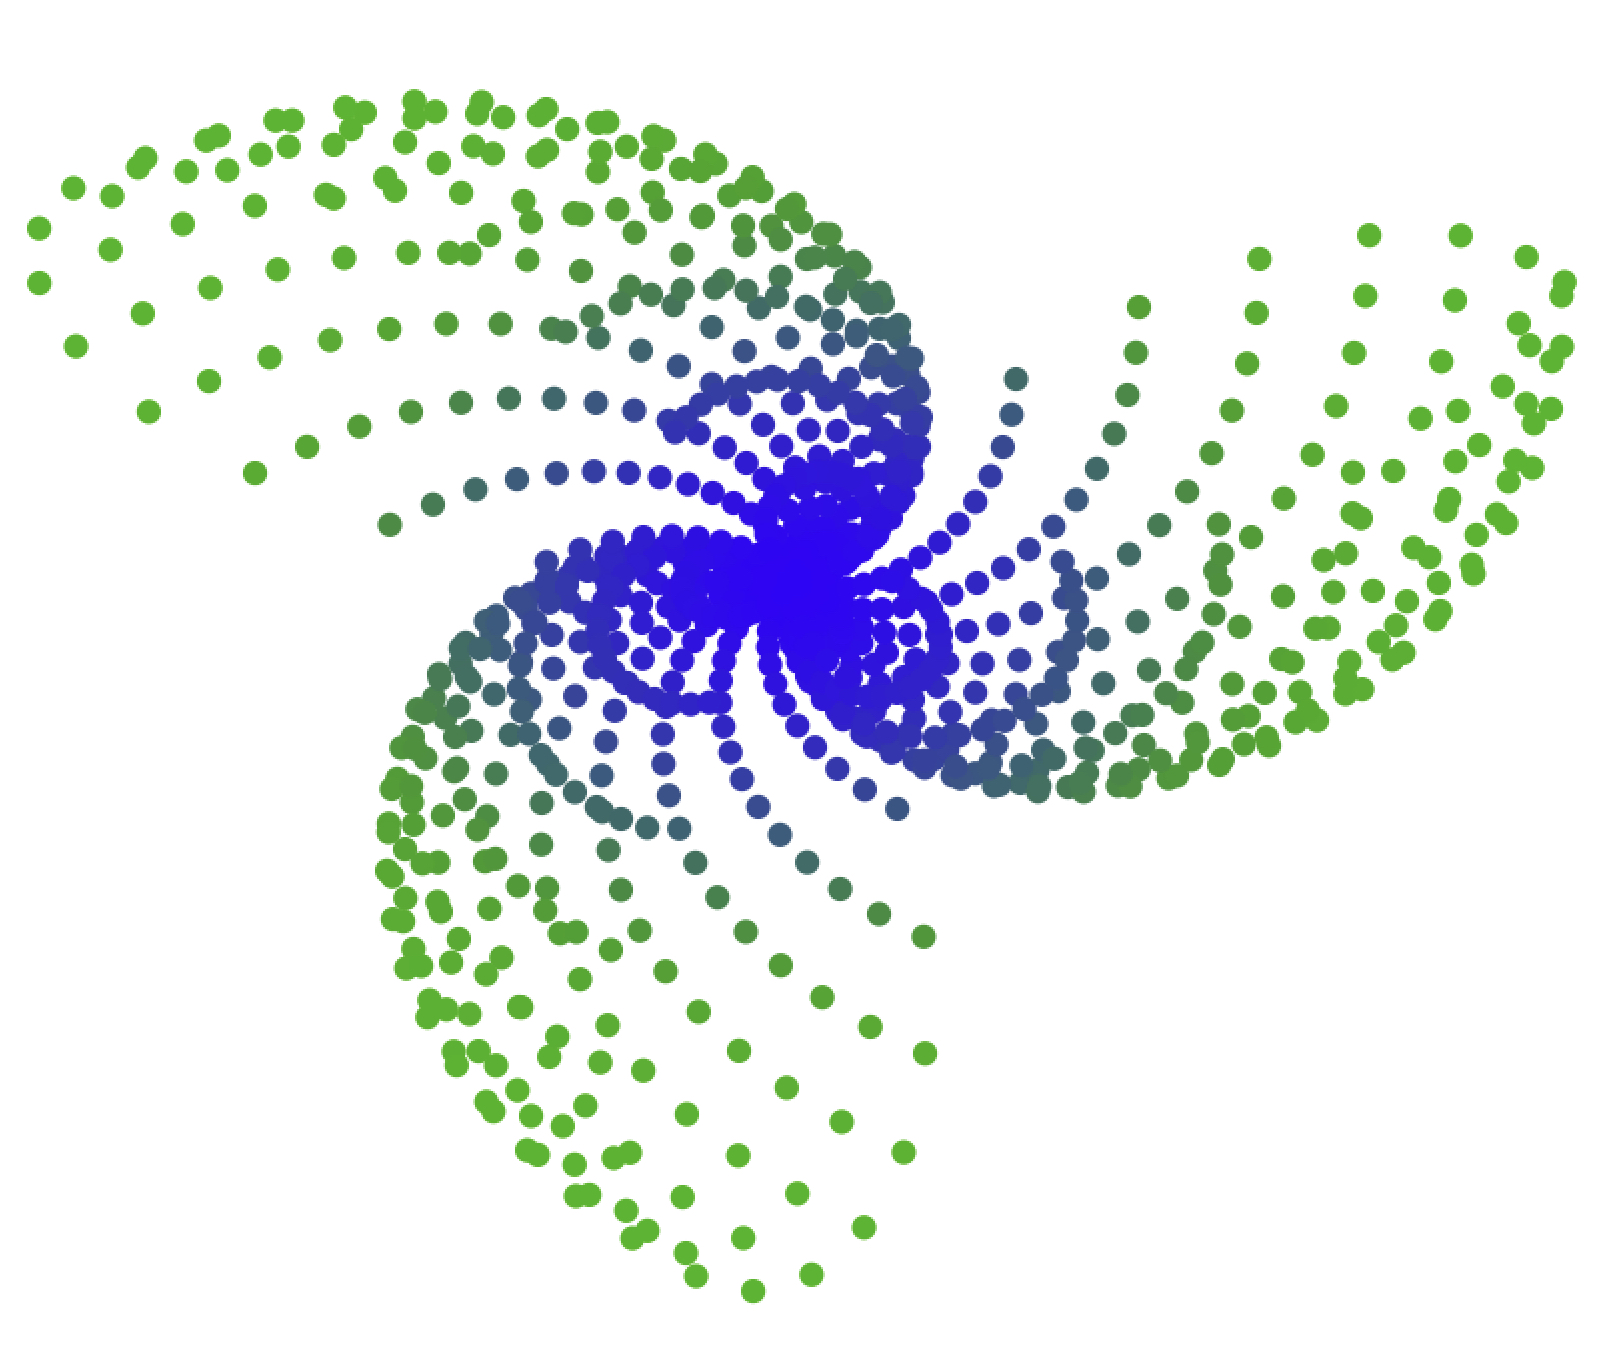
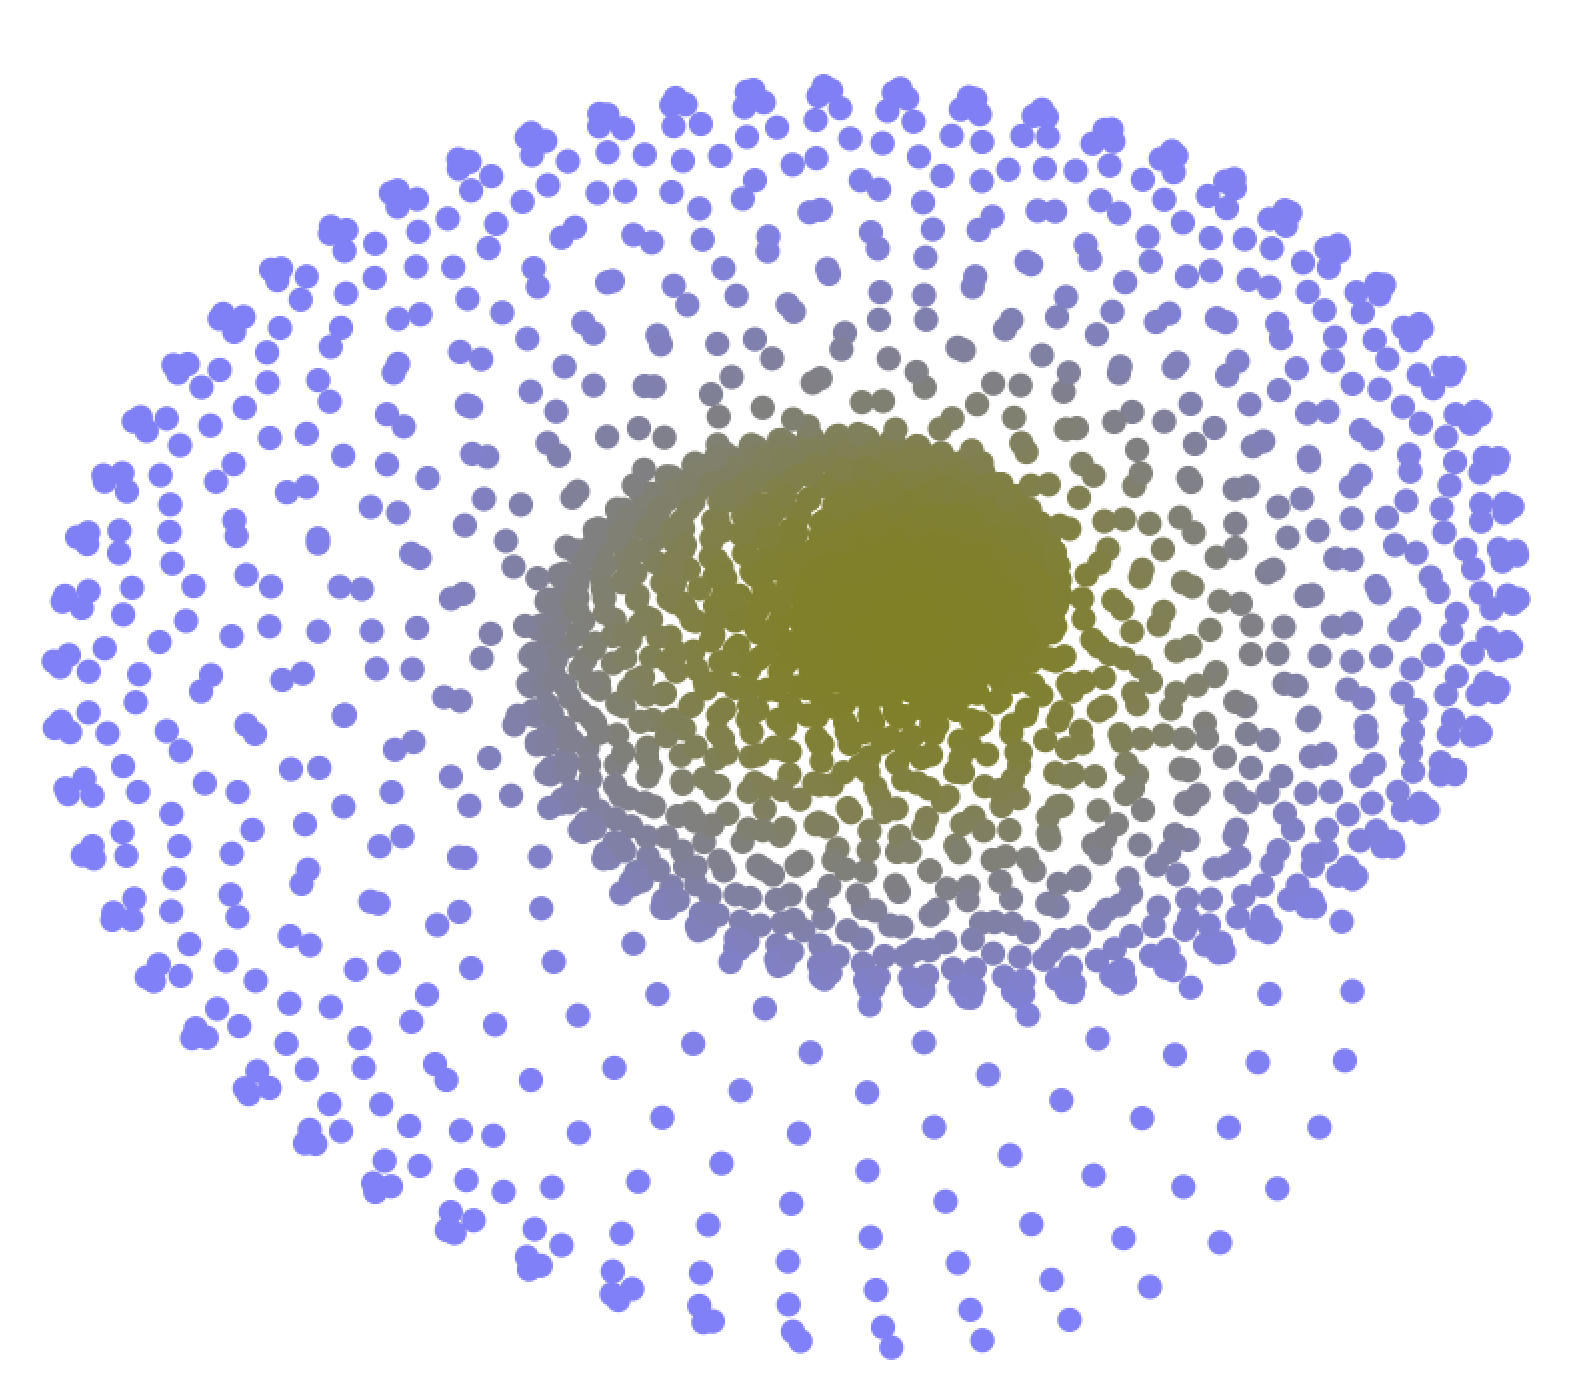
Untitled Function
color_3 = lambda x, y: (0.5, 0.5, sigm(x ** 2 + y ** 2)) vis(162, func_4, step=0.1, c=color_3)
vis(179, func_4, step=0.1, c=color_3)
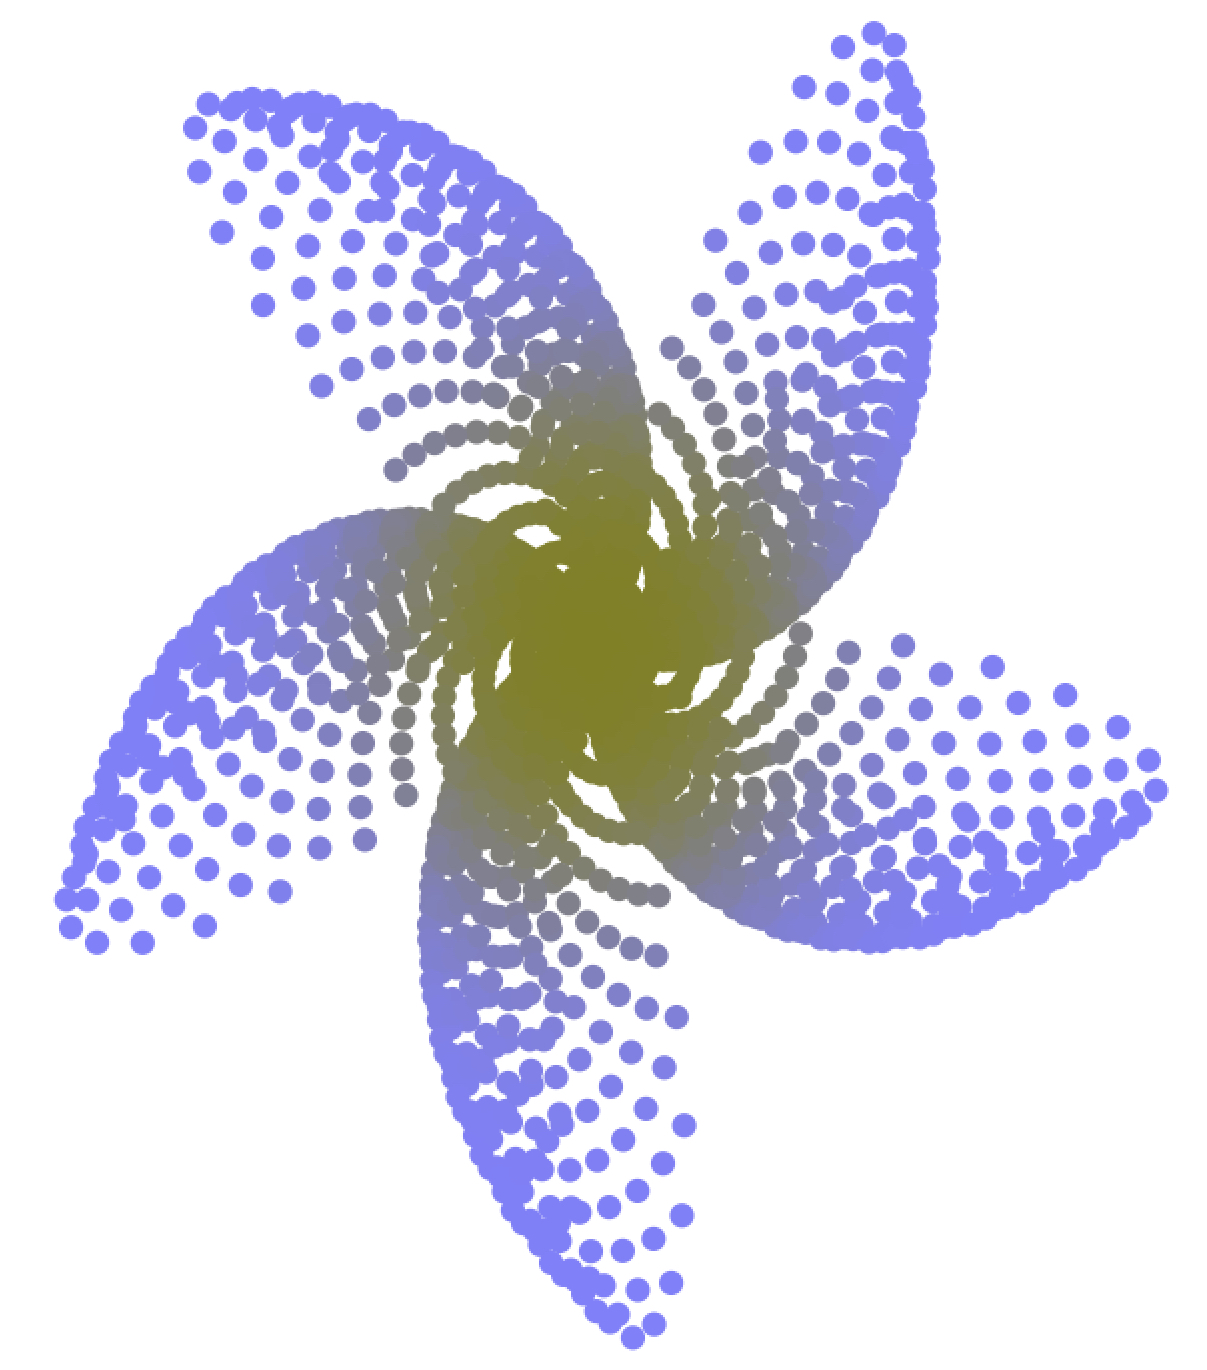
Beauty formula
def func_5(A, B): return math.cos((A + 1) * B) ** 1.5 * math.e ** (1j * (B * math.cos(A)))
color_4 = lambda x, y: (sigm(x ** 2 + y ** 2) / 2, 0.5, 1 - sigm(x ** 2 + y ** 2)) vis(345, func_5, step=0.1, c=color_4)
vis(350, func_5, step=0.1, c=color_4)
That's all for now.
Whole code
import numpy as np import random import matplotlib.pyplot as plt import math def vis(A, f, step=1.0, c=None): x = [] y = [] for B in np.arange(0, A, step): v = f(A, B) x.append(v.real) y.append(v.imag) plt.figure(figsize=[7, 7]) mxabs = max([i[0] ** 2 + i[1] ** 2 for i in zip(x, y)]) ** 0.5 x = np.array(x) / mxabs y = np.array(y) / mxabs if c is None: plt.scatter(x, y) else: plt.scatter(x, y, color=[c(x[i], y[i]) for i in range(len(x))]) plt.show() def func_1(A, B): return math.sin(B) * B * math.e ** (1j * (B * math.cos(A))) def func_2(A, B): return math.cos(B) * math.sin(B) * B * math.e ** (1j * (B * math.cos(A))) def func_3(A, B): return math.cos((A + 1) * B) * math.e ** (1j * (B * math.cos(A))) def func_4(A, B): return math.sin(A + B) * B * math.e ** (1j * B * math.sin(A)) def func_5(A, B): return math.cos((A + 1) * B) ** 1.5 * math.e ** (1j * (B * math.cos(A))) def sigm(x): return (1 / (1 + 1.2 ** (-x*50)) - 0.5) * 2 color_1 = lambda x, y: (0.2, sigm(x ** 2 + y ** 2) / 1.4, 1 - sigm(x ** 2 + y ** 2)) color_2 = lambda x, y: (sigm(x ** 2 + y ** 2), 0.5, 0.5) color_3 = lambda x, y: (0.5, 0.5, sigm(x ** 2 + y ** 2)) color_4 = lambda x, y: (sigm(x ** 2 + y ** 2) / 2, 0.5, 1 - sigm(x ** 2 + y ** 2)) colors = [color_1, color_2, color_3, color_4] funcs = [func_1, func_2, func_3, func_4, func_5] while True: col = random.choice(colors) func = random.choice(funcs) vis(random.random() * 200 + 100, func, step=0.1, c=col) if input() == "exit": break
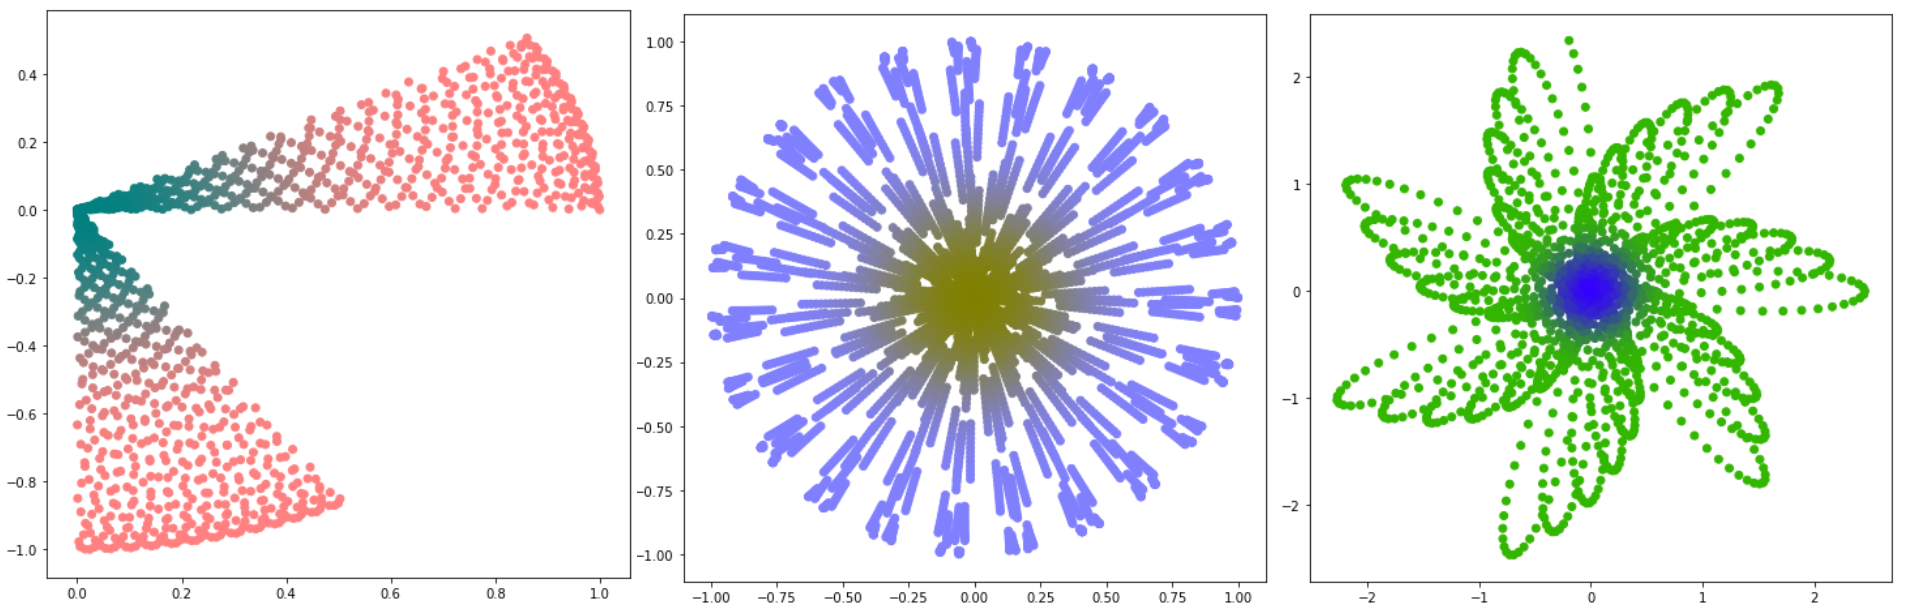
More screenshots 


All Articles