Built-in software application runtime controls
 The publication presents a software implementation of built-in tools for collecting and accumulating metric information on the runtime of applications written in C / C ++ / C #.
The essence of the described approach is based on the inclusion of “control points” in the program code of the application for extracting data on the execution time of structural components: methods, functions, and {} blocks. The extracted metric information is accumulated in an internal database, the contents of which at the end of the application are converted into a text report form stored in a file. The appropriateness of using the means of built-in control of the execution time is due to the need to identify problem areas of the code, to analyze the causes of the temporary degradation of the application: full or partial, or manifesting on certain sets of source data.
The given examples of C ++ / C # source codes demonstrate possible implementations of the described approach.
Introduction
The development of a software application at each iteration (for example, the release of the next release) of its evolutionary development includes the following basic steps:
- development and testing of functionality;
- optimization of consumed resources of RAM;
- stabilization of runtime metrics.
These steps require a significant amount of developers not only creative (such as the development and implementation of effective algorithms, building a flexible software architecture, etc.), but also routine work. The latter category includes activities aimed at stabilizing time metrics for application execution. In many cases, this is a rather painful procedure, when developers are faced with degradation, which is a consequence of expanding the functionality of a software product, rebuilding the software architecture, and the appearance of new threads in the application. At the same time, the sources of degradation require certain efforts to detect them, which is achieved not only by the high industriousness and responsibility of the developers (a necessary condition), but also by the composition of the tools used for these purposes (a sufficient condition).
One of the effective approaches to solving the problem of analyzing application time metrics is the use of specialized software products, for example GNU gprof . The analysis of reports generated by such tools allows you to identify “bottlenecks” (class methods and functions), which account for a significant amount of time spent executing the application as a whole. At the same time, the validity of the time spent on the execution of methods and procedures is certainly qualified by the developers.
It should also be noted that the software products of this class, as a rule, perform a metric analysis of the execution time of the program code at the levels of the methods of classes and functions, ignoring the lower (but nonetheless significant from the point of view of the analysis of the problem) levels: {...}, for, while, do-until, if – else, try-catch blocks, inside of which no less significant expenditures of execution time occur.
Next, the main content of one of the possible solutions for the implementation of built-in control of execution time tools aimed at extracting and accumulating detailed information on time metrics of controlled software blocks with subsequent generation of reports for developers is considered.
Methods for Retrieving Runtime Data
The functionality of any software application can be interpreted as an abstract machine with a finite set of unique states {St} and transitions {Tr} between them.
In the framework of this approach, any flow of execution in the application should be interpreted as an ordered sequence of its states and transitions between them. In this case, the estimation of the execution time costs is carried out by summing the time metrics over the entire set of passed states with ignoring the costs of transitions from one state to another - as negligible values.
The extraction and accumulation of data on the execution time of the application at the specified control points is the main task solved by the built-in control tools described below.
For each breakpoint declared in the source code by placing
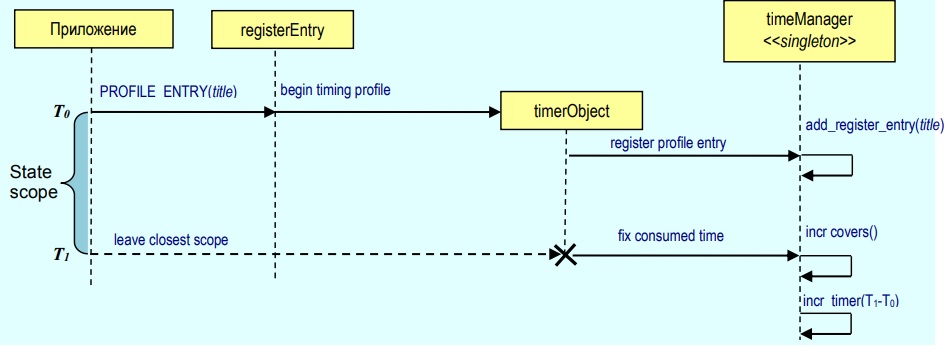
PROFILE_ENTRY C ++ macro, the number of its passes during application execution is recorded, as well as the time metric - the total time the application was in the state from the moment the checkpoint passed to the next level of the program hierarchy (including a block, class method, function, etc.) as illustrated in the diagram below.
Control of control points (initial registration and calculation of their time metrics) is performed by the object 'timeManager' , which is created in a single instance. Each event of passing the checkpoint is fixed by the object 'timeManager', and during the first pass it is registered by it as observables as 'registerEntry' .
At the moment of each passage of the control point, a timerObject object is created , fixing the time of its creation. The execution time is fixed at the checkpoint when the application exits from the current level of the software hierarchy. At this moment, the timerObject of the object is automatically destroyed, which is accompanied by the calculation of its “lifetime” T. As a result, the timeManager increases the number of times the checkpoint passes and the time spent in it by T. For all set control points, timeManager accumulates data with the subsequent release of a report when the application terminates.
Below is the source C ++ code that implements the built-in tools for controlling the execution time of the application.
// #include <vector> #include <map> #include <algorithm> #include <stdio.h> #include <time.h> typedef unsigned long LONGEST_INT; // , // // // ( ) // () // #define PROFILER_ENABLED // CREATE_PROFILER timeManager , // // 'main()' #ifdef PROFILER_ENABLED #define CREATE_PROFILER timeManager tManager; #else #define CREATE_PROFILER // CREATE_PROFILER. #endif //INITIALIZE_PROFILER timeManager // // 'main()' #ifdef PROFILER_ENABLED #define INITIALIZE_PROFILER bool timeManager::object = false;\ std::vector<registerEntry> timeManager::entries; #else #define INITIALIZE_PROFILER // INITIALIZE_PROFILER. #endif //DELAY(_SECONDS) '_SECONDS' . // , // // #ifdef PROFILER_ENABLED #define DELAY(_SECONDS) {clock_t clk_wait=clock()+((double)_ARG)*CLOCKS_PER_SEC;\ while(clock()<clk_wait) {}} #else #define DELAY(_SECONDS) // DELAY. #endif // , // UNIX WINDOWS // #ifdef PROFILER_ENABLED #define MERGE2(x,y) x##y #define MERGE1(_X,_Y) MERGE2(_X,_Y) #if WIN32 #define UNIQUENAME prefix,postfix) MERGE1(prefix,postfix) #else #define UNIQUENAME(prefix,postfix) MERGE2(prefix,postfix) #endif #define GEN_SRC(_ARG1,_ARG2) static int UNIQUENAME(ind,_ARG2)=-1;\ if(UNIQUENAME(ind,_ARG2)<0)\ UNIQUENAME(ind,_ARG2)=timeManager::add_entry(_ARG1);\ timeManager::incr_counter(UNIQUENAME(ind,_ARG2));\ timerObject UNIQUENAME(tm,_ARG2)(UNIQUENAME(ind,_ARG2)); //PROFILE_ENTRY #ifdef PROFILER_ENABLED #if WIN32 #define PROFILE_ENTRY(_TITLE) GEN_SRC(_TITLE,__COUNTER__) #else #define PROFILE_ENTRY(_TITLE) GEN_SRC(_TITLE,__LINE__) #endif #else #define PROFILE_ENTRY(_TITLE) // PROFILE_ENTRY. #endif // // // , timeManager struct registerEntry { // ( ) std::string entry_name; // // LONGEST_INT covers_counter; // // (ticks) LONGEST_INT elapsed_time; // registerEntry(const char * title):entry_name(title), covers_counter(0), elapsed_time(0) {} }; // class timerObject { // , int index; // clock_t start_time; public: // timerObject(int ind):index(ind),start_time(clock()) {} // “ ” // // ~timerObject(void) { timeManager::incr_timer(index,(LONGEST_INT)(clock()-start_time)); } }; // class timeManager { private: // static std::vector<registerEntry> entries; // , // static bool object; public: // // , // static int add_entry(const char * title) { entries.push_back(registerEntry(title)); return (((int)entries.size())-1); } // // static void incr_counter(int profile_entry_id) { entries[profile_entry_id].covers_counter++; } // 'value' // static void incr_timer(int profile_entry_id, LONGEST_INT value) { entries[profile_entry_id].elapsed_time += val; } // // static void report(void); // timeManager(void) { if(!object) object = true; else { printf("\n<<>>: 'timeManager' .\n"); throw; } } // // virtual ~timeManager(void) {report();} }; // bool cmp_entries(registerEntry & first, registerEntry & second) { if(first.entry_name.compare(second.entry_name)>0) return false; return true; } // // void timeManager::report(void) { const std::string bar(72,'*'); // const char * REPORT_FILE = "C:\\tmProfile.txt"; FILE * fp = fopen(REPORT_FILE,"w"); if(!fp) { printf("\n<<>>: (%s)",REPORT_FILE); return; } fprintf(fp,"\n#%s",bar.c_str()); fprintf(fp,"\n#\n# "); fprintf(fp,"\n#\n#%s",bar.c_str()); fprintf(fp,"\n#\n# %-35s %-15s %-20s", " ",""," ()"); fprintf(fp,"\n# %-35s %-15s %-20s", "------------------","-------------","---------------\n#"); // std::sort(entries.begin(),entries.end(),cmp_entries); for(unsigned jj = 0; jj< entries.size(); jj++) { fprintf(fp,"\n# %-35s %-16d", entries[jj].entry_name.c_str(), entries[jj].covers_counter); if(entries[jj].covers_counter == 0) fprintf(fp,"%-20d",0); else fprintf(fp,"%-20.0f", static_cast<double>(entries[jj].elapsed_time)/ static_cast<double>(CLOCKS_PER_SEC)); } if(entries.size() == 0) fprintf(fp,"\n# No covered profile entries found\n"); fprintf(fp,"\n#\n#%s\n",bar.c_str()); fclose(fp); }
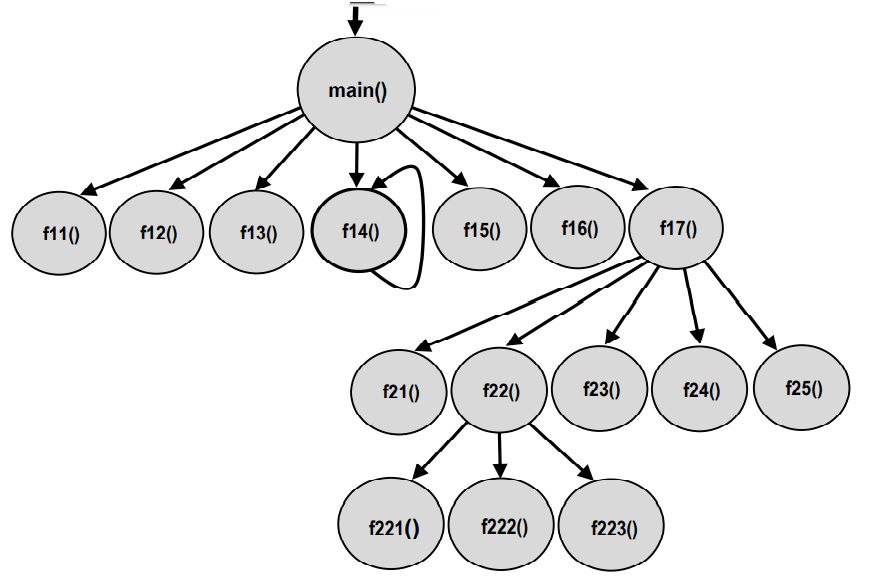
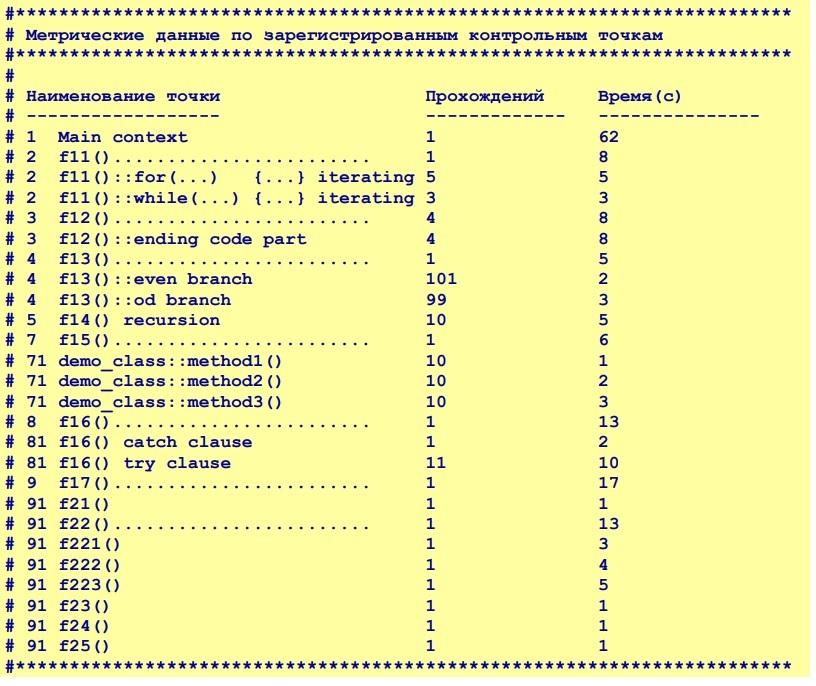
The structure of the demo application is illustrated below, illustrating the use of the built-in runtime control tools as an example, as well as a table of the results obtained (for details, see Appendix 1. Source code for the demo application ).
Section Addendum 2. The source code of the means of the built-in control of the execution time of the C # application presents a similar implementation of the means of the built-in control in C #.
The author uses pairs of TimeWatcher.StartWatch () and TimeWatcher.StopWatch () when profiling the execution time of laborious (from a computational point of view) methods and procedures as part of the software product developed by EREMEX Delta Design - a computer-aided design system for electronic equipment.
Below is an example of a brief report on time metrics of one of the functionality of the mentioned product.

Brief conclusions
The described tools can be used to collect data on application execution time in various parts of its program code, in particular, they allow:
- collect and accumulate data on time metrics of execution threads in the application;
- perform estimates of the execution time of program code accurate to elementary language constructs;
- manage the volume of extracted data by turning on and off the built-in control tools on the corresponding sections of the application execution threads
- develop and apply regression tests that monitor the stability (and detect degradation) of application time metrics.
In conclusion, it should be noted that outside the scope of this publication there were questions of the use of the described built-in controls in the context of multithreading applications and no analysis of the accuracy of the obtained data by time metrics was presented in any form. The latter is due to the fact that in practice, when identifying the causes of temporary degradation of an application, the data on the relative distribution of the execution time costs between the software components of the application are primarily relevant . In this regard, questions of the accuracy of the data obtained are fading into the background.
Appendix 1. Source code for the demo application
INITIALIZE_PROFILER int main(int argc, char * argv[]) { //create profile manager CREATE_PROFILER PROFILE_ENTRY("1 Main context") f11(); for(unsigned jj = 0;jj<4;jj++) f12(); f13 (); f14 (); f15 (); f16 (); f17(); return 0; } void f11(void)///////////////////////////////////////// { PROFILE_ENTRY ("2 f11()........................") for (unsigned jj = 0; jj<5; jj++) { PROFILE_ENTRY ("2 f11()::for(...){...} iterat-ing") DELAY(1) } //profile entry for repeating int nn(3); while(nn > 0) { PROFILE_ENTRY("2 f11()::while(...){...} iterat-ing") DELAY(1) nn--; } } void f12(void)///////////////////////////////////////// { PROFILE_ENTRY("3 f12()........................") goto ending; { PROFILE_ENTRY("3 f12()::ignored code part") DELAY(1) } ending: PROFILE_ENTRY("3 f12()::ending code part") DELAY(2) } void f13(void) ///////////////////////////////////////// { PROFILE_ENTRY("4 f13()........................") srand((unsigned) time(NULL)/2); for(unsigned jj = 0; jj < 200; jj++) { if(rand()%2 == 0) { PROFILE_ENTRY("4 f13()::even branch") DELAY(0.01) } else { PROFILE_ENTRY("4 f13()::od branch") DELAY(0.02) } } } void f14(void)///////////////////////////////////////// { static int depth = 10; { PROFILE_ENTRY("5 f14() recursion") depth--; DELAY(0.5) if(depth == 0) return; } f14(); } void f15(void)///////////////////////////////////////// { PROFILE_ENTRY("7 f15()........................") for(unsigned jj = 0; jj < 10; jj++) { demo_class obj; obj.method1(); obj.method2(); obj.method3(); } } void f16(void)///////////////////////////////////////// { PROFILE_ENTRY("8 f16()........................") try { for(int jj = 10; jj >= 0; jj--) { PROFILE_ENTRY("81 f16() try clause") DELAY(1) int rr = 200/jj; } } catch(...) { PROFILE_ENTRY("81 f16() catch clause") DELAY(2) return; } } void f17(void)///////////////////////////////////////// { PROFILE_ENTRY("9 f17()........................") f21(); f22(); f23(); f24(); f25(); } void f22(void)///////////////////////////////////////// { PROFILE_ENTRY("91 f22()........................") DELAY(1) f221(); f222(); f223(); } void f23(void) {PROFILE_ENTRY("91 f23()") DELAY(1) } void f24(void) {PROFILE_ENTRY("91 f24()") DELAY(1) } void f25(void) {PROFILE_ENTRY("91 f25()") DELAY(1) } void f221(void) {PROFILE_ENTRY("91 f221()") DELAY(3) } void f222(void) {PROFILE_ENTRY("91 f222()") DELAY(4) } void f223(void) {PROFILE_ENTRY("91 f223()") DELAY(5) }
Supplement 2. Source code of built-in runtime control C # applications
/// <summary> /// /// </summary> public class TimeWatcher { /// <summary> /// /// </summary> internal class TimeEntry { // public Stopwatch timeWatch; // public long elapsedTime; // public TimeEntry() { timeWatch = new Stopwatch(); elapsedTime = 0; } } // // private static bool enableTimeWatcher = false; // private static Dictionary<string, TimeEntry> entryDictionary = new Dictionary<string, TimeEntry>(); // public static void StartWatch(string postfix = "") { if (!enableTimeWatcher) return; string entryName = GetCurrentMethod(); if (postfix != "") { entryName += postfix; } // , // if (!entryDictionary.ContainsKey(entryName)) { entryDictionary.Add(entryName, new TimeEntry()); entryDictionary[entryName].timeWatch.Start(); } else { if (entryDictionary[entryName].timeWatch.IsRunning) { throw new System.InvalidOperationException(": '" + entryName + "' ."); } else entryDictionary[entryName].timeWatch.Restart(); } } // public static void StopWatch(string postfix = "") { if (!enableTimeWatcher) return; string entryName = GetCurrentMethod(); if (postfix != "") { entryName += postfix; } // , if (!entryDictionary.ContainsKey(entryName)) { throw new System.InvalidOperationException(": - '" + entryName + "'."); } if (!entryDictionary[entryName].timeWatch.IsRunning) { throw new System.InvalidOperationException ": '" + entryName + "'."); } entryDictionary[entryName].timeWatch.Stop(); entryDictionary[entryName].elapsedTime += entryDictionary[entryName].timeWatch.ElapsedMilliseconds; } // // public static void TimeWatchReport() { const string bar = "============================================="; if (!enableTimeWatcher) return; Console.WriteLine(""); Console.WriteLine(bar); Console.WriteLine(" (): "); Console.WriteLine(""); int maxLen = 0; foreach (var timeEntry in entryDictionary) { if(timeEntry.Key.Length > maxLen) maxLen = timeEntry.Key.Length; } maxLen++; string strFormat = "{0," + maxLen + "} ... {1,-10}"; foreach (var timeEntry in entryDictionary) { Console.WriteLine(strFormat, timeEntry.Key, timeEntry.Value.elapsedTime); } Console.WriteLine(bar); Console.WriteLine(""); entryDictionary.Clear(); enableTimeWatcher = false; } // // /tmw // public static void InitTimeWatch() { if (Environment.GetCommandLineArgs().Any(v => v == "/tmw")) { if (entryDictionary.Count > 0) { TimeWatchReport(); } entryDictionary.Clear(); enableTimeWatcher = true; } } // private static string GetCurrentMethod() { StackTrace st = new StackTrace(); StackFrame sf = st.GetFrame(2); return sf.GetMethod().Name; } }
All Articles