動的なニーモニックオブジェクトの形成
前の記事のトピックを作成して、Pythonで実行される単純なSCADAプログラムの模倣オブジェクトを形成するためのいくつかの機能について説明します。
オブジェクトは、レジスタからのアナログ測定値のステータスを視覚的に表示します
READ_INPUT_REGISTERSまたはREAD_HOLDING_REGISTERS。 Tkinterライブラリが使用されます。
合計で、水平スライダー、垂直スライダー、矢印インジケーターの3つのオブジェクトが実装されました。 動的トレンドの構築については個別に説明します。
水平スライダー

最初に、キャンバスオブジェクトを作成し、それへのリンクを取得する必要があります。
このオブジェクトは、作成済みのルートオブジェクトに配置されます。
from Tkinter import * # root = Tk() canv = Canvas(root,width=1900,height=950,bg="black",bd=0, highlightthickness=0, relief='ridge') canv.place(x=0, y=25) # c = Canvas(root,width=400,height=50,bg="black") # c.place(x=10, y=20)
root-親オブジェクトへのリンク。
幅= 400-幅。
高さ= 50-高さ。
bg = "black"は背景です。
これで、グラフィックプリミティブを使用してスライダー要素を描画しています。
ただし、要素を正しく描画するためには、関数を作成することをお勧めします。
def hMeterC(nowValue,x,y,widgLen,widgHigh,maxValue,outerColor,nameValue)
入力変数は次のとおりです。
nowValueは現在の測定値です。
xはXの座標です。
yはy座標です。
widgLen-スライダーの長さ。
widgHigh-スライダーの高さ。
maxValueは最大許容値です。
outerColor-塗りつぶし色。
nameValue-測定値の名前。
hMeterC
def hMeterC(nowValue,x,y,widgLen,widgHigh,maxValue,outerColor,nameValue): c = Canvas(root,width=widgLen+50,height=widgHigh+40,bg="black",bd=0, highlightthickness=0, relief='ridge') c.place(x=x, y=y) if(nowValue > maxValue): nowValue=maxValue-1 devValue=float(widgLen) / float(maxValue) mesureValue = devValue * nowValue c.create_rectangle(1,1,widgLen,widgHigh,fill='black',outline=outerColor) c.create_rectangle(2,2,int(mesureValue),widgHigh-1,fill='red',outline='red') c.create_line(1,widgHigh,1,widgHigh+5,width=1,fill=outerColor) c.create_line(widgLen,widgHigh,widgLen,widgHigh+5,width=1,fill=outerColor) c.create_line(1+widgLen/4,widgHigh,1+widgLen/4 ,widgHigh+5,width=1,fill=outerColor) c.create_line(1+widgLen/2,widgHigh,1+widgLen/2 ,widgHigh+5,width=1,fill=outerColor) c.create_line(1+widgLen-widgLen/4,widgHigh,1+widgLen-widgLen/4 ,widgHigh+5,width=1,fill=outerColor) c.create_text(0,widgHigh+10,font="Verdana 10",anchor="w",justify=CENTER,fill='white',text='0') c.create_text(widgLen -10,widgHigh+10,font="Verdana 10",anchor="w",justify=CENTER,fill='white',text=str(maxValue)) c.create_text(widgLen/2 -10,widgHigh+10,font="Verdana 10",anchor="w",justify=CENTER,fill='white',text=str(int(maxValue/2))) c.create_text(widgLen/4-10,widgHigh+10,font="Verdana 10",anchor="w",justify=CENTER,fill='white',text=str(int(maxValue/4))) c.create_text(widgLen-widgLen/4-10,widgHigh+10,font="Verdana 10",anchor="w",justify=CENTER,fill='white',text=str(int(maxValue-maxValue/4))) c.create_text(widgLen/2 -10,widgHigh-8,font="Verdana 12",anchor="w",justify=CENTER,fill='white',text=str(int(nowValue))) c.create_text(1,widgHigh+21,font="Verdana 10",anchor="w",justify=CENTER,fill='white',text=nameValue) return (c,'hmeter',x,y,widgLen,widgHigh,maxValue,outerColor,nameValue)
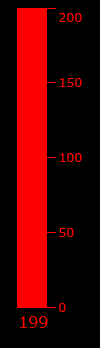
以下のコードを実行すると、ウィンドウ内の画面に水平スライダーが形成され、25%が赤で塗りつぶされ、現在の測定値がスライダーの中央または右側に表示されます。
これが発生した場合、コードはエラーなしで機能します。
プログラムコード。
from Tkinter import * def hMeterC(nowValue,x,y,widgLen,widgHigh,maxValue,outerColor,nameValue): c = Canvas(root,width=widgLen+50,height=widgHigh+40,bg="black",bd=0, highlightthickness=0, relief='ridge') c.place(x=x, y=y) if(nowValue > maxValue): nowValue=maxValue-1 devValue=float(widgLen) / float(maxValue) mesureValue = devValue * nowValue c.create_rectangle(1,1,widgLen,widgHigh,fill='black',outline=outerColor) c.create_rectangle(2,2,int(mesureValue),widgHigh-1,fill='red',outline='red') c.create_line(1,widgHigh,1,widgHigh+5,width=1,fill=outerColor) c.create_line(widgLen,widgHigh,widgLen,widgHigh+5,width=1,fill=outerColor) c.create_line(1+widgLen/4,widgHigh,1+widgLen/4 ,widgHigh+5,width=1,fill=outerColor) c.create_line(1+widgLen/2,widgHigh,1+widgLen/2 ,widgHigh+5,width=1,fill=outerColor) c.create_line(1+widgLen-widgLen/4,widgHigh,1+widgLen-widgLen/4 ,widgHigh+5,width=1,fill=outerColor) c.create_text(0,widgHigh+10,font="Verdana 10",anchor="w",justify=CENTER,fill='white',text='0') c.create_text(widgLen -10,widgHigh+10,font="Verdana 10",anchor="w",justify=CENTER,fill='white',text=str(maxValue)) c.create_text(widgLen/2 -10,widgHigh+10,font="Verdana 10",anchor="w",justify=CENTER,fill='white',text=str(int(maxValue/2))) c.create_text(widgLen/4-10,widgHigh+10,font="Verdana 10",anchor="w",justify=CENTER,fill='white',text=str(int(maxValue/4))) c.create_text(widgLen-widgLen/4-10,widgHigh+10,font="Verdana 10",anchor="w",justify=CENTER,fill='white',text=str(int(maxValue-maxValue/4))) c.create_text(widgLen/2 -10,widgHigh-8,font="Verdana 12",anchor="w",justify=CENTER,fill='white',text=str(int(nowValue))) c.create_text(1,widgHigh+21,font="Verdana 10",anchor="w",justify=CENTER,fill='white',text=nameValue) return (c,'hmeter',x,y,widgLen,widgHigh,maxValue,outerColor,nameValue) root = Tk() canv = Canvas(root,width=1900,height=950,bg="black") canv.place(x=0, y=25) analogFig=hMeterC(250,20,50,300,20,1000,'red','analog Meter') root.mainloop()
しかし、これは「水平スライダー」オブジェクトの静的な表示にすぎません。
スピーカーを追加する必要があります。 これを行うには、 root.afterメソッドを使用して、スライダーの表示機能を少し変更します。
hMeterC関数は次の形式を取ります。
def hMeterC(nowValue,x,y,widgLen,widgHigh,maxValue,outerColor,nameValue): c = Canvas(root,width=widgLen+50,height=widgHigh+40,bg="black",bd=0, highlightthickness=0, relief='ridge') c.place(x=x, y=y) return (c,'hmeter',x,y,widgLen,widgHigh,maxValue,outerColor,nameValue)
つまり、 hMeterC関数は作成されたオブジェクトのパラメーターの配列を返し、別のグラフィック関数を描画すると実行されます
hMeter:
def hMeter(c,nowValue,x,y,widgLen,widgHigh,maxValue,outerColor,nameValue): if(nowValue > maxValue): nowValue=maxValue-1 devValue=float(widgLen) / float(maxValue) mesureValue = devValue * nowValue c.create_rectangle(1,1,widgLen,widgHigh,fill='black',outline=outerColor) c.create_rectangle(2,2,int(mesureValue),widgHigh-1,fill=outerColor,outline=outerColor) c.create_line(1,widgHigh,1,widgHigh+5,width=1,fill=outerColor) c.create_line(widgLen,widgHigh,widgLen,widgHigh+5,width=1,fill=outerColor) c.create_line(1+widgLen/4,widgHigh,1+widgLen/4 ,widgHigh+5,width=1,fill=outerColor) c.create_line(1+widgLen/2,widgHigh,1+widgLen/2 ,widgHigh+5,width=1,fill=outerColor) c.create_line(1+widgLen-widgLen/4,widgHigh,1+widgLen-widgLen/4 ,widgHigh+5,width=1,fill=outerColor) c.create_text(0,widgHigh+10,font="Verdana 10",anchor="w",justify=CENTER,fill='white',text='0') c.create_text(widgLen -10,widgHigh+10,font="Verdana 10",anchor="w",justify=CENTER,fill='white',text=str(maxValue)) c.create_text(widgLen/2 -10,widgHigh+10,font="Verdana 10",anchor="w",justify=CENTER,fill='white',text=str(int(maxValue/2))) c.create_text(widgLen/4-10,widgHigh+10,font="Verdana 10",anchor="w",justify=CENTER,fill='white',text=str(int(maxValue/4))) c.create_text(widgLen-widgLen/4-10,widgHigh+10,font="Verdana 10",anchor="w",justify=CENTER,fill='white',text=str(int(maxValue-maxValue/4))) c.create_text(widgLen +10,widgHigh-8,font="Verdana 12",anchor="w",justify=CENTER,fill=outerColor,text=str(int(nowValue))) c.create_text(1,widgHigh+21,font="Verdana 10",anchor="w",justify=CENTER,fill='white',text=nameValue)
また、 def jobMeter()ループ関数をroot.afterに追加する必要があります。
def jobMeter(): hMeter(c,nowValue,x,y,widgLen,widgHigh,maxValue,outerColor,nameValue) root.after(100, jobMeter)
これで、プログラムコードが少し変更されました。
プログラムコード
import time from Tkinter import * import random def hMeter(c,nowValue,x,y,widgLen,widgHigh,maxValue,outerColor,nameValue): if(nowValue > maxValue): nowValue=maxValue-1 devValue=float(widgLen) / float(maxValue) mesureValue = devValue * nowValue c.create_rectangle(1,1,widgLen,widgHigh,fill='black',outline=outerColor) c.create_rectangle(2,2,int(mesureValue),widgHigh-1,fill=outerColor,outline=outerColor) c.create_line(1,widgHigh,1,widgHigh+5,width=1,fill=outerColor) c.create_line(widgLen,widgHigh,widgLen,widgHigh+5,width=1,fill=outerColor) c.create_line(1+widgLen/4,widgHigh,1+widgLen/4 ,widgHigh+5,width=1,fill=outerColor) c.create_line(1+widgLen/2,widgHigh,1+widgLen/2 ,widgHigh+5,width=1,fill=outerColor) c.create_line(1+widgLen-widgLen/4,widgHigh,1+widgLen-widgLen/4 ,widgHigh+5,width=1,fill=outerColor) c.create_text(0,widgHigh+10,font="Verdana 10",anchor="w",justify=CENTER,fill='white',text='0') c.create_text(widgLen -10,widgHigh+10,font="Verdana 10",anchor="w",justify=CENTER,fill='white',text=str(maxValue)) c.create_text(widgLen/2 -10,widgHigh+10,font="Verdana 10",anchor="w",justify=CENTER,fill='white',text=str(int(maxValue/2))) c.create_text(widgLen/4-10,widgHigh+10,font="Verdana 10",anchor="w",justify=CENTER,fill='white',text=str(int(maxValue/4))) c.create_text(widgLen-widgLen/4-10,widgHigh+10,font="Verdana 10",anchor="w",justify=CENTER,fill='white',text=str(int(maxValue-maxValue/4))) c.create_text(widgLen +10,widgHigh-8,font="Verdana 12",anchor="w",justify=CENTER,fill=outerColor,text=str(int(nowValue))) c.create_text(1,widgHigh+21,font="Verdana 10",anchor="w",justify=CENTER,fill='white',text=nameValue) def hMeterC(nowValue,x,y,widgLen,widgHigh,maxValue,outerColor,nameValue): c = Canvas(root,width=widgLen+50,height=widgHigh+40,bg="black",bd=0, highlightthickness=0, relief='ridge') c.place(x=x, y=y) return (c,'hmeter',x,y,widgLen,widgHigh,maxValue,outerColor,nameValue) def jobMeter(): hMeter(analogFig[0],100,analogFig[2],analogFig[3],analogFig[4],analogFig[5],analogFig[6],analogFig[7],analogFig[8]) root.after(100, jobMeter) root = Tk() canv = Canvas(root,width=1900,height=950,bg="black") canv.place(x=0, y=25) analogFig=hMeterC(250,20,50,300,20,1000,'red','analog Meter') root.after(100, jobMeter) root.mainloop()
0.1秒ごとに、スライダーオブジェクトが更新されますが、私は言わなければなりません、
hMeter関数のnowValue変数の値は常に100であるため、変更は発生しません。
この状況を修正し、オブジェクトの動的プロパティを示すために、ランダムライブラリを使用してコードを変更することをお勧めします。
import random def jobMeter(): hMeter(analogFig[0],random.randint(30, 800),analogFig[2],analogFig[3],analogFig[4],analogFig[5],analogFig[6],analogFig[7],analogFig[8]) root.after(100, jobMeter)
これで、スライダーの位置に明らかな変化があります。
しかし、この場合、2つの不快な事実があります。
- 作成されたスクリプトは大量のメモリを占有しませんが、実行されると、占有メモリの量が増加します。
- 現在の値を表示する右側の数字は区別できません。
これはすべて簡単に説明されています。
新しい測定値がキャンバスに形成されるたびに、
グラフィックプリミティブを再描画しますが、古い要素も保持されます。
前の要素に新しい要素をオーバーレイします。
この効果を取り除くには、古い要素からクリーニングキャンバスを追加する必要があります
jobMeter()関数に。
def jobMeter(): analogFig[0].delete("all") hMeter(analogFig[0],100,analogFig[2],analogFig[3],analogFig[4],analogFig[5],analogFig[6],analogFig[7],analogFig[8]) root.after(100, jobMeter)
これでメモリは増加せず、数値は正しく表示されます。
垂直スライダー
ここのすべては水平に似ていますが、描画プリミティブの構成のみが少し変更されます。
機能
def vMeterC(nowValue,x,y,widgLen,widgHigh,maxValue,outerColor,nameValue): c = Canvas(root,width=widgLen+50,height=widgHigh+40,bg="black",bd=0, highlightthickness=0, relief='ridge') c.place(x=x, y=y) return (c,'vmeter',x,y,widgLen,widgHigh,maxValue,outerColor,nameValue) def vMeter(c,nowValue,x,y,widgLen,widgHigh,maxValue,outerColor,nameValue): if(nowValue > maxValue): nowValue=maxValue-1 devValue=float(widgHigh) / float(maxValue) mesureValue = devValue * nowValue c.create_rectangle(1,1,widgLen,widgHigh,fill='black',outline=outerColor) c.create_rectangle(widgLen-1,widgHigh,2,widgHigh-int(mesureValue),fill=outerColor,outline=outerColor) c.create_line(widgLen,widgHigh,widgLen+10,widgHigh,width=1,fill=outerColor) c.create_line(widgLen,widgHigh/4,widgLen+10,widgHigh/4,width=1,fill=outerColor) c.create_line(widgLen,widgHigh/2,widgLen+10,widgHigh/2,width=1,fill=outerColor) c.create_line(widgLen,widgHigh-widgHigh/4,widgLen+10,widgHigh-widgHigh/4,width=1,fill=outerColor) c.create_line(widgLen,1,widgLen+10,1,width=1,fill=outerColor) c.create_line(widgLen+10,widgHigh,widgLen+10 ,widgHigh,width=1,fill=outerColor) c.create_text(widgLen+12,widgHigh,font="Verdana 10",anchor="w",justify=CENTER,fill=outerColor,text='0') c.create_text(widgLen+12,10,font="Verdana 10",anchor="w",justify=CENTER,fill=outerColor,text=str(maxValue)) c.create_text(widgLen+12,widgHigh/2,font="Verdana 10",anchor="w",justify=CENTER,fill=outerColor,text=str(maxValue/2)) c.create_text(widgLen+12,widgHigh-widgHigh/4,font="Verdana 10",anchor="w",justify=CENTER,fill=outerColor,text=str(maxValue/4)) c.create_text(widgLen+12,widgHigh/4,font="Verdana 10",anchor="w",justify=CENTER,fill=outerColor,text=str(maxValue-maxValue/4)) c.create_text(2,widgHigh+15,font="Verdana 12",anchor="w",justify=CENTER,fill=outerColor,text=str(nowValue))
ダイヤルゲージ。
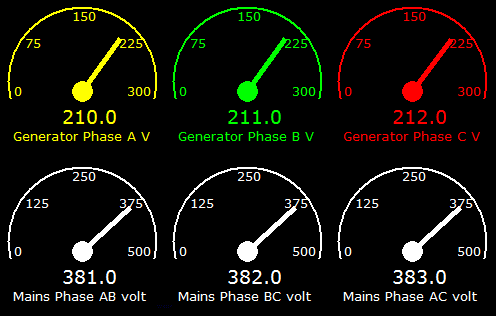
このオブジェクトを作成するには、数学ライブラリをインポートする必要があります。
数学関数sinおよびcosが使用されます。
機能
def aMeterC(nowValue,x,y,widgLen,widgHigh,maxValue,outerColor,nameValue): c = Canvas(root,width=widgLen,height=widgHigh,bg="black",bd=0, highlightthickness=0, relief='ridge') c.place(x=x, y=y) return (c,'ameter',x,y,widgLen,widgHigh,maxValue,outerColor,nameValue) def aMeter(c,nowValue,x,y,widgLen,widgHigh,maxValue,outerColor,nameValue): if(nowValue > maxValue): nowValue=maxValue-1 devValue=float(180) / float(maxValue) mesureValue = devValue * nowValue x1 = widgLen/2 y1 = widgHigh/2 + 10 x2 = 10 y2 = widgHigh/2 + 10 angle = math.pi * int(mesureValue) / 180; newx = ((x2-x1)*math.cos(angle)-(y2-y1)*math.sin(angle)) + x1 newy = ((x2-x1)*math.sin(angle)+(y2-y1)*math.cos(angle)) + y1 c.create_oval(1 , 1,widgLen-1 ,widgHigh-1,width=2,fill='black',outline=outerColor) c.create_text(7,y1,font="Verdana 10",anchor="w",justify=CENTER,fill=outerColor,text='0') c.create_text(widgLen-30,y1,font="Verdana 10",anchor="w",justify=CENTER,fill=outerColor,text=str(maxValue)) c.create_text(widgLen/2-10,10,font="Verdana 10",anchor="w",justify=CENTER,fill=outerColor,text=str(maxValue/2)) c.create_text(widgLen/8,widgHigh/4,font="Verdana 10",anchor="w",justify=CENTER,fill=outerColor,text=str(maxValue/4)) c.create_text(widgLen/2+widgLen/4,widgHigh/4,font="Verdana 10",anchor="w",justify=CENTER,fill=outerColor,text=str(maxValue-maxValue/4)) c.create_text(widgLen/2-20,widgHigh-40,font="Verdana 14",anchor="w",justify=CENTER,fill=outerColor,text=str(nowValue)) c.create_rectangle(0,widgHigh/2+18,widgLen ,widgHigh,fill='black',outline='black') c.create_text(widgLen/2-20,widgHigh-40,font="Verdana 14",anchor="w",justify=CENTER,fill=outerColor,text=str(nowValue)) c.create_text(6,widgHigh-20,font="Verdana 10",anchor="w",justify=CENTER,fill=outerColor,text=str(nameValue)) c.create_oval(x1 - 10, y1 - 10, x1+ 10,y1 + 10,fill=outerColor,outline=outerColor) c.create_line(x1,y1,newx,newy,width=5,fill=outerColor)
ダイナミックグラフ

最後に言いたいのは、動的グラフの構築です。 多くの便利なグラフ作成ツールと大量のドキュメントを実装するmatplotlibライブラリがあります。 ただし、tkinterライブラリを使用して動的なグラフを作成する簡単な方法について説明します。
オブジェクトの作成は前の例と同様に実行されますが、読み取り値は配列として送信する必要があります。配列では、appendメソッドを使用して新しい要素が最後に追加されます。
その後、オブジェクトが再描画されます。
タイムスタンプ0に、最後の測定値(100)を持つ配列があるとします。
新しいタイムスタンプを作成するとき、新しい配列要素が追加され、新しい測定値が書き込まれます(110)。
ほぼそのような表が判明します。
0.0秒-(100)
0.1秒-(100,110)
0.2秒-(100,110.90)
0.3秒-(100,110,90,120)
0.4秒-(100,110,90,120,100)
など
特定の値の配列要素の数に達すると、
配列はゼロ化され、プロセスが再び繰り返されます。
if(len(mesureValue) == 80): mesureValue=None mesureValue=[]
したがって、測定値の曲線は、グラフオブジェクトのキャンバスの最終境界に到達し、
この後、値がリセットされ、配列にデータを蓄積するプロセスが繰り返されます。
以下は、上記のすべての模倣オブジェクトの動作を示すプログラムの簡単な例です。
プログラムコード
import time from Tkinter import * import random import math def hMeter(c,nowValue,x,y,widgLen,widgHigh,maxValue,outerColor,nameValue): if(nowValue > maxValue): nowValue=maxValue-1 devValue=float(widgLen) / float(maxValue) mesureValue = devValue * nowValue c.create_rectangle(1,1,widgLen,widgHigh,fill='black',outline=outerColor) c.create_rectangle(2,2,int(mesureValue),widgHigh-1,fill=outerColor,outline=outerColor) c.create_line(1,widgHigh,1,widgHigh+5,width=1,fill=outerColor) c.create_line(widgLen,widgHigh,widgLen,widgHigh+5,width=1,fill=outerColor) c.create_line(1+widgLen/4,widgHigh,1+widgLen/4 ,widgHigh+5,width=1,fill=outerColor) c.create_line(1+widgLen/2,widgHigh,1+widgLen/2 ,widgHigh+5,width=1,fill=outerColor) c.create_line(1+widgLen-widgLen/4,widgHigh,1+widgLen-widgLen/4 ,widgHigh+5,width=1,fill=outerColor) c.create_text(0,widgHigh+10,font="Verdana 10",anchor="w",justify=CENTER,fill='white',text='0') c.create_text(widgLen -10,widgHigh+10,font="Verdana 10",anchor="w",justify=CENTER,fill='white',text=str(maxValue)) c.create_text(widgLen/2 -10,widgHigh+10,font="Verdana 10",anchor="w",justify=CENTER,fill='white',text=str(int(maxValue/2))) c.create_text(widgLen/4-10,widgHigh+10,font="Verdana 10",anchor="w",justify=CENTER,fill='white',text=str(int(maxValue/4))) c.create_text(widgLen-widgLen/4-10,widgHigh+10,font="Verdana 10",anchor="w",justify=CENTER,fill='white',text=str(int(maxValue-maxValue/4))) c.create_text(widgLen +10,widgHigh-8,font="Verdana 12",anchor="w",justify=CENTER,fill=outerColor,text=str(int(nowValue))) c.create_text(1,widgHigh+21,font="Verdana 10",anchor="w",justify=CENTER,fill='white',text=nameValue) def hMeterC(nowValue,x,y,widgLen,widgHigh,maxValue,outerColor,nameValue): c = Canvas(root,width=widgLen+50,height=widgHigh+40,bg="black",bd=0, highlightthickness=0, relief='ridge') c.place(x=x, y=y) return (c,'hmeter',x,y,widgLen,widgHigh,maxValue,outerColor,nameValue) def vMeterC(nowValue,x,y,widgLen,widgHigh,maxValue,outerColor,nameValue): c = Canvas(root,width=widgLen+50,height=widgHigh+40,bg="black",bd=0, highlightthickness=0, relief='ridge') c.place(x=x, y=y) return (c,'vmeter',x,y,widgLen,widgHigh,maxValue,outerColor,nameValue) def vMeter(c,nowValue,x,y,widgLen,widgHigh,maxValue,outerColor,nameValue): if(nowValue > maxValue): nowValue=maxValue-1 devValue=float(widgHigh) / float(maxValue) mesureValue = devValue * nowValue c.create_rectangle(1,1,widgLen,widgHigh,fill='black',outline=outerColor) c.create_rectangle(widgLen-1,widgHigh,2,widgHigh-int(mesureValue),fill=outerColor,outline=outerColor) c.create_line(widgLen,widgHigh,widgLen+10,widgHigh,width=1,fill=outerColor) c.create_line(widgLen,widgHigh/4,widgLen+10,widgHigh/4,width=1,fill=outerColor) c.create_line(widgLen,widgHigh/2,widgLen+10,widgHigh/2,width=1,fill=outerColor) c.create_line(widgLen,widgHigh-widgHigh/4,widgLen+10,widgHigh-widgHigh/4,width=1,fill=outerColor) c.create_line(widgLen,1,widgLen+10,1,width=1,fill=outerColor) c.create_line(widgLen+10,widgHigh,widgLen+10 ,widgHigh,width=1,fill=outerColor) c.create_text(widgLen+12,widgHigh,font="Verdana 10",anchor="w",justify=CENTER,fill=outerColor,text='0') c.create_text(widgLen+12,10,font="Verdana 10",anchor="w",justify=CENTER,fill=outerColor,text=str(maxValue)) c.create_text(widgLen+12,widgHigh/2,font="Verdana 10",anchor="w",justify=CENTER,fill=outerColor,text=str(maxValue/2)) c.create_text(widgLen+12,widgHigh-widgHigh/4,font="Verdana 10",anchor="w",justify=CENTER,fill=outerColor,text=str(maxValue/4)) c.create_text(widgLen+12,widgHigh/4,font="Verdana 10",anchor="w",justify=CENTER,fill=outerColor,text=str(maxValue-maxValue/4)) c.create_text(2,widgHigh+15,font="Verdana 12",anchor="w",justify=CENTER,fill=outerColor,text=str(nowValue)) def aMeterC(nowValue,x,y,widgLen,widgHigh,maxValue,outerColor,nameValue): c = Canvas(root,width=widgLen,height=widgHigh,bg="black",bd=0, highlightthickness=0, relief='ridge') c.place(x=x, y=y) return (c,'ameter',x,y,widgLen,widgHigh,maxValue,outerColor,nameValue) def aMeter(c,nowValue,x,y,widgLen,widgHigh,maxValue,outerColor,nameValue): if(nowValue > maxValue): nowValue=maxValue-1 devValue=float(180) / float(maxValue) mesureValue = devValue * nowValue x1 = widgLen/2 y1 = widgHigh/2 + 10 x2 = 10 y2 = widgHigh/2 + 10 angle = math.pi * int(mesureValue) / 180; newx = ((x2-x1)*math.cos(angle)-(y2-y1)*math.sin(angle)) + x1 newy = ((x2-x1)*math.sin(angle)+(y2-y1)*math.cos(angle)) + y1 c.create_oval(1 , 1,widgLen-1 ,widgHigh-1,width=2,fill='black',outline=outerColor) c.create_text(7,y1,font="Verdana 10",anchor="w",justify=CENTER,fill=outerColor,text='0') c.create_text(widgLen-30,y1,font="Verdana 10",anchor="w",justify=CENTER,fill=outerColor,text=str(maxValue)) c.create_text(widgLen/2-10,10,font="Verdana 10",anchor="w",justify=CENTER,fill=outerColor,text=str(maxValue/2)) c.create_text(widgLen/8,widgHigh/4,font="Verdana 10",anchor="w",justify=CENTER,fill=outerColor,text=str(maxValue/4)) c.create_text(widgLen/2+widgLen/4,widgHigh/4,font="Verdana 10",anchor="w",justify=CENTER,fill=outerColor,text=str(maxValue-maxValue/4)) c.create_text(widgLen/2-20,widgHigh-40,font="Verdana 14",anchor="w",justify=CENTER,fill=outerColor,text=str(nowValue)) c.create_rectangle(0,widgHigh/2+18,widgLen ,widgHigh,fill='black',outline='black') c.create_text(widgLen/2-20,widgHigh-40,font="Verdana 14",anchor="w",justify=CENTER,fill=outerColor,text=str(nowValue)) c.create_text(6,widgHigh-20,font="Verdana 10",anchor="w",justify=CENTER,fill=outerColor,text=str(nameValue)) c.create_oval(x1 - 10, y1 - 10, x1+ 10,y1 + 10,fill=outerColor,outline=outerColor) c.create_line(x1,y1,newx,newy,width=5,fill=outerColor) def hTrendC(x,y,widgLen,widgHigh,maxValue,outerColor,nameValue,trendKoef): c = Canvas(root,width=widgLen+50,height=widgHigh+40,bg="black",bd=0, highlightthickness=0, relief='ridge') c.place(x=x, y=y) return (c,'htrend',x,y,widgLen,widgHigh,maxValue,outerColor,nameValue,trendKoef) def hTrend(arrayData,arrayValue): c,markErr,x,y,widgLen,widgHigh,maxValue,outerColor,nameValue,trendKoef=arrayData c.create_rectangle(1,1,widgLen,widgHigh,fill='black',outline=outerColor) c.create_line(50,widgHigh/2,widgLen-5,widgHigh/2,width=0.1,fill='white',dash=(4, 2)) c.create_line(50,widgHigh/4,widgLen-5,widgHigh/4,width=0.1,fill='white',dash=(4, 2)) c.create_line(50,widgHigh - widgHigh/4,widgLen-5,widgHigh -widgHigh/4,width=0.2,fill='white',dash=(4, 2)) c.create_text(10,widgHigh-10,font="Verdana 10",anchor="w",justify=CENTER,fill='white',text=0) c.create_text(10,12,font="Verdana 10",anchor="w",justify=CENTER,fill='white',text=str(maxValue)) c.create_text(10,widgHigh/2,font="Verdana 10",anchor="w",justify=CENTER,fill='white',text=str(int(maxValue/2))) c.create_text(10,widgHigh/4,font="Verdana 10",anchor="w",justify=CENTER,fill='white',text=str(int(maxValue-maxValue/4))) c.create_text(10,widgHigh - widgHigh/4 ,font="Verdana 10",anchor="w",justify=CENTER,fill='white',text=str(int(maxValue/4))) c.create_text(1,widgHigh+25,font="Verdana 10",anchor="w",justify=CENTER,fill='white',text=nameValue) c.create_text(widgLen/10,widgHigh+10,font="Verdana 10",anchor="w",justify=CENTER,fill='white',text='1') c.create_text((widgLen/10)*2,widgHigh+10,font="Verdana 10",anchor="w",justify=CENTER,fill='white',text='2') c.create_text((widgLen/10)*3,widgHigh+10,font="Verdana 10",anchor="w",justify=CENTER,fill='white',text='3') c.create_text((widgLen/10)*4,widgHigh+10,font="Verdana 10",anchor="w",justify=CENTER,fill='white',text='4') c.create_text((widgLen/10)*5,widgHigh+10,font="Verdana 10",anchor="w",justify=CENTER,fill='white',text='5') c.create_text((widgLen/10)*6,widgHigh+10,font="Verdana 10",anchor="w",justify=CENTER,fill='white',text='6') c.create_text((widgLen/10)*7,widgHigh+10,font="Verdana 10",anchor="w",justify=CENTER,fill='white',text='7') c.create_text((widgLen/10)*8,widgHigh+10,font="Verdana 10",anchor="w",justify=CENTER,fill='white',text='8') c.create_text((widgLen/10)*9,widgHigh+10,font="Verdana 10",anchor="w",justify=CENTER,fill='white',text='9') c.create_text(widgLen-10,widgHigh+10,font="Verdana 10",anchor="w",justify=CENTER,fill='white',text='100') oldy=widgHigh - float(widgHigh)/float(maxValue) * arrayValue[0] * int(trendKoef) oldx=5 xval=0 for counter in range(0,len(arrayValue)): val=arrayValue[counter] yval=widgHigh - float(widgHigh)/float(maxValue) * val * int(trendKoef) xval+=10 c.create_line(oldx,oldy,xval,yval,width=1.5,fill='green') oldy=yval oldx=xval mesureValue = arrayValue[len(arrayValue)-1 ] * int(trendKoef) c.create_line(xval,widgHigh-10,xval,0,width=0.5,fill='white') c.create_text(xval+10,yval,font="Verdana 10",anchor="w",justify=CENTER,fill='white',text=str(mesureValue)) c.create_text(xval+10,yval+20,font="Verdana 10",anchor="w",justify=CENTER,fill='white',text=time.strftime('%H:%M:%S')) def jobMeter(): global mesureValue analogFig[0].delete("all") analogVertical[0].delete("all") analogString[0].delete("all") hMeter(analogFig[0],random.randint(30, 800),analogFig[2],analogFig[3],analogFig[4],analogFig[5],analogFig[6],analogFig[7],analogFig[8]) vMeter(analogVertical[0],random.randint(30, 800),analogVertical[2],analogVertical[3],analogVertical[4],analogVertical[5],analogVertical[6],analogVertical[7],analogVertical[8]) aMeter(analogString[0],random.randint(30, 800),analogString[2],analogString[3],analogString[4],analogString[5],analogString[6],analogString[7],analogString[8]) lenVal = len(mesureValue)+1 mesureValue.append(lenVal) mesureValue[lenVal-1] = random.randint(30, 800) trend[0].delete("all") hTrend(trend,mesureValue) if(len(mesureValue) == 80): mesureValue=None mesureValue=[] root.after(100, jobMeter) root = Tk() canv = Canvas(root,width=1900,height=950,bg="black") canv.place(x=0, y=25) analogFig=hMeterC(250,20,50,300,20,1000,'red','analog Meter') analogVertical=vMeterC(250,42,150,30,200,1000,'red','analog Meter') analogString=aMeterC(250,200,150,150,150,1000,'green','analog Meter') global mesureValue mesureValue=[] trend=hTrendC(450,28,800,400,1000,'green','analog', '1') root.after(1, jobMeter) root.mainloop()
より多くの例はここで見つけることができます。