前編
第二部
ミックステーブル、テキスト、ggplot2-graphics
このセクションでは、表とテキストをグラフとともに表示する方法を示します。 アイリスデータセットを使用します。
これらのチャートを作成することから始めましょう:
- Sepal.Length可変密度グラフ。 R関数:
ggdensity()
[in ggpubr ] - 記述統計(平均、標準偏差など)を含むピボットテーブル
- 記述統計を計算するためのR関数:
desc_statby()
[in ggpubr ] - テキスト付きのテーブルを作成するR関数:
ggtexttable()
[in ggpubr ]
- 記述統計を計算するためのR関数:
- テキストの段落 。 R関数:
ggparagraph()
[ ggpubr内 ]
ggarrange()
、3つのグラフすべてを[ ggpubrの ]
ggarrange()
関数と組み合わせます。
# "Sepal.Length" #:::::::::::::::::::::::::::::::::::::: density.p <- ggdensity(iris, x = "Sepal.Length", fill = "Species", palette = "jco") # Sepal.Length #:::::::::::::::::::::::::::::::::::::: # stable <- desc_statby(iris, measure.var = "Sepal.Length", grps = "Species") stable <- stable[, c("Species", "length", "mean", "sd")] # , "medium orange" ( ) stable.p <- ggtexttable(stable, rows = NULL, theme = ttheme("mOrange")) # #:::::::::::::::::::::::::::::::::::::: text <- paste("iris data set gives the measurements in cm", "of the variables sepal length and width", "and petal length and width, respectively,", "for 50 flowers from each of 3 species of iris.", "The species are Iris setosa, versicolor, and virginica.", sep = " ") text.p <- ggparagraph(text = text, face = "italic", size = 11, color = "black") # ggarrange(density.p, stable.p, text.p, ncol = 1, nrow = 3, heights = c(1, 0.5, 0.3))

グラフィックエレメントをggplotに追加する
テーブル、グラフ、またはその他のテーブルベースの要素をggplotワークスペースに追加するには、
annotation_custom()
関数[ ggplot2内 ]があります。 簡略化された形式:
annotation_custom(grob, xmin, xmax, ymin, ymax)
- grob :表示用の外部グラフィック要素
- xmin 、 xmax :座標のx位置(水平位置)
- ymin 、 ymax :座標のy位置(垂直位置)
テーブルをggplotに配置します
前のセクションで作成したdensity.pおよびstable.pグラフを使用します。
density.p + annotation_custom(ggplotGrob(stable.p), xmin = 5.5, ymin = 0.7, xmax = 8)

散布図をggplotに入れます
- irisデータセットから、y =“ Sepal.Width” x x =“ Sepal.Length”の散布図を作成します。 R関数:
ggscatter()
[ ggpubr ]。 - 背景が透明なx変数とy変数の個別の散布図を作成します。 R関数:
ggboxplot()
[ ggpubr ]。 - 散布図をグリッド用語で「グロブ」と呼ばれるグラフィックに変換します。 R関数:
ggplotGrob()
[ ggplot2 ]。 - 散布図のグローブを散布図内に配置します。 R関数:
annotation_custom()
[ ggplot2 ]。
内部に配置された散布図は複数のポイントで重ねられているため、透明な背景が使用されます。
# ("Species") #:::::::::::::::::::::::::::::::::::::::::::::::::::::::::: sp <- ggscatter(iris, x = "Sepal.Length", y = "Sepal.Width", color = "Species", palette = "jco", size = 3, alpha = 0.6) # x/y #:::::::::::::::::::::::::::::::::::::::::::::::::::::::::: # x xbp <- ggboxplot(iris$Sepal.Length, width = 0.3, fill = "lightgray") + rotate() + theme_transparent() # ybp <- ggboxplot(iris$Sepal.Width, width = 0.3, fill = "lightgray") + theme_transparent() # # “grob” Grid xbp_grob <- ggplotGrob(xbp) ybp_grob <- ggplotGrob(ybp) # #:::::::::::::::::::::::::::::::::::::::::::::::::::::::::: xmin <- min(iris$Sepal.Length); xmax <- max(iris$Sepal.Length) ymin <- min(iris$Sepal.Width); ymax <- max(iris$Sepal.Width) yoffset <- (1/15)*ymax; xoffset <- (1/15)*xmax # xbp_grob sp + annotation_custom(grob = xbp_grob, xmin = xmin, xmax = xmax, ymin = ymin-yoffset, ymax = ymin+yoffset) + # ybp_grob annotation_custom(grob = ybp_grob, xmin = xmin-xoffset, xmax = xmin+xoffset, ymin = ymin, ymax = ymax)

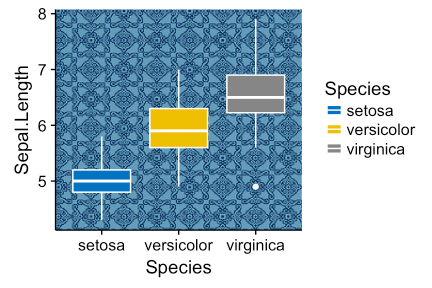
背景画像をggplot2グラフィックスに追加します
背景画像をインポートします。 背景画像の形式に応じて、
readPNG()
関数[ jpegパッケージ]または
readPNG()
関数[ pngパッケージ]のいずれかを使用します。
以下の例をテストするには、 pngパッケージがインストールされていることを確認してください。
install.packages(“png”)
コマンドを使用してインストールできます。
# img.file <- system.file(file.path("images", "background-image.png"), package = "ggpubr") img <- png::readPNG(img.file)
ggplotを背景画像と組み合わせます。 R関数:
background_image()
[ ggpubr内 ]。
library(ggplot2) library(ggpubr) ggplot(iris, aes(Species, Sepal.Length))+ background_image(img)+ geom_boxplot(aes(fill = Species), color = "white")+ fill_palette("jco")

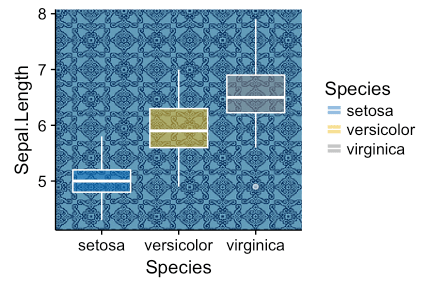
引数alphaを指定して、散布図の塗りつぶしの透明度を変更します。 値は[0、1]の範囲である必要があります。0は完全な透明度で、1は透明度の欠如です。
library(ggplot2) library(ggpubr) ggplot(iris, aes(Species, Sepal.Length))+ background_image(img)+ geom_boxplot(aes(fill = Species), color = "white", alpha = 0.5)+ fill_palette("jco")

別の例、ggplot2にフランスの地図を重ねる:
mypngfile <- download.file("https://upload.wikimedia.org/wikipedia/commons/thumb/e/e4/France_Flag_Map.svg/612px-France_Flag_Map.svg.png", destfile = "france.png", mode = 'wb') img <- png::readPNG('france.png') ggplot(iris, aes(x = Sepal.Length, y = Sepal.Width)) + background_image(img)+ geom_point(aes(color = Species), alpha = 0.6, size = 5)+ color_palette("jco")+ theme(legend.position = "top")

複数のページにグラフィックを配置します
ggplotsの長いリスト(n = 20など)がある場合は、それらを複数のページに配置して整理することをお勧めします。 1ページに4つのグラフィックスがある場合、20ページには5ページが必要です。
[ ggpubr ]の
ggarrange()
関数は、複数のページに複数のggplotを配置するための便利なソリューションを提供します。 nrow引数とncol引数を指定した後、
ggarrange()
関数は、すべてのグラフに適合するために必要なページ数を自動的に計算します。 順序付けられたggplotのリストを返します。
たとえば、次のコード
multi.page <- ggarrange(bxp, dp, bp, sp, nrow = 1, ncol = 2)
それぞれに2つのグラフがある2つのページを返します。 次のように各ページを表示できます。
multi.page[[1]] # 1 multi.page[[2]] # 2
順序付きチャートは、
ggexport()
関数[ ggpubr内 ]を使用してPDFファイルにエクスポートできます。
ggexport(multi.page, filename = "multi.page.ggplot2.pdf")
PDFファイル
マルチページ出力は、 marrangeGrob
marrangeGrob()
関数[ gridExtra ]でも取得できます。
library(gridExtra) res <- marrangeGrob(list(bxp, dp, bp, sp), nrow = 1, ncol = 2) # pdf- ggexport(res, filename = "multi.page.ggplot2.pdf") # res
ggarrangeとのネストされた関係()
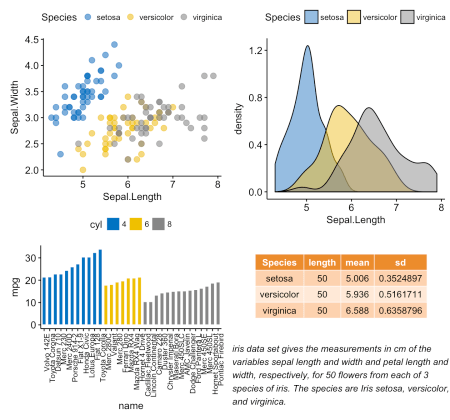
前のセクションで作成したチャートを配置します。
p1 <- ggarrange(sp, bp + font("x.text", size = 9), ncol = 1, nrow = 2) p2 <- ggarrange(density.p, stable.p, text.p, ncol = 1, nrow = 3, heights = c(1, 0.5, 0.3)) ggarrange(p1, p2, ncol = 2, nrow = 1)

チャートのエクスポート
R関数:
ggexport()
[ ggpubr内 ]。
最初に、虹彩データセットの変数Sepal.Length、Sepal.Width、Petal.LengthおよびPetal.Widthに対応する4つのggplotのリストを作成します。
plots <- ggboxplot(iris, x = "Species", y = c("Sepal.Length", "Sepal.Width", "Petal.Length", "Petal.Width"), color = "Species", palette = "jco" ) plots[[1]] # plots[[2]] # ..
その後、個々のグラフィックをファイル(pdf、eps、またはpng)にエクスポートできます(ページごとに1つのグラフィック)。 エクスポート時にグラフを配置できます(1ページに2つ)。
PDFでの個々のグラフのエクスポート(ページごとに1つ):
ggexport(plotlist = plots, filename = "test.pdf")
並べ替えてエクスポートします。 同じページに複数のグラフを表示するには、nrowとncolを設定します。
ggexport(plotlist = plots, filename = "test.pdf", nrow = 2, ncol = 1)