Hello everyone, my name is Alexander, and I am a data scientist at Clain. We are engaged in the analysis of blockchain transactions for their affiliation with criminal actions, such as cashing out, theft, terrorist financing and the like.
Cryptocurrency regulations are tightened every year, and now companies are required to comply with AML \ KYC policies. About the same thing, the company Elliptic, which in early August 2019 published a labeled dataset of 200k bitcoin transactions.
The main purpose of their publication is to give the crypto community real data in order to test new approaches to detect dubious transactions, using both a set of standard attributes (the number of inputs and outputs, transfers, transfers to miners, etc.) and the topology of the graph built on these transactions . The dataset is anonymized and has 167 attributes. All of them have zero mean and unit variance except the first, which is the identifier, and the second - characterizes the time from 1 to 49, which corresponds to the components of the transaction graph.
Using the data from the elliptic_txs_edgelist.csv file, you can build a directed graph and calculate the inbound and outbound degrees of each txId transaction. This allows you to approximately (since the graph is cut from the whole blockchain and part of the connections are lost) estimate the number of sender and recipient addresses for each transaction. In the elliptic_txs_features.csv plate, rename the columns as V1 - V167 and immediately replace V1 with txId, V2 with elliptic_time. Some attributes correlate better than others with the value of the incoming and outgoing degrees of the graph: cor (out-degree, V16) = 0.689, cor (out-degree, V7) = 0.680, cor (in-degree, V6) = 0.589, cor (in- degree, V8) = 0.582. Let's look at these variables.
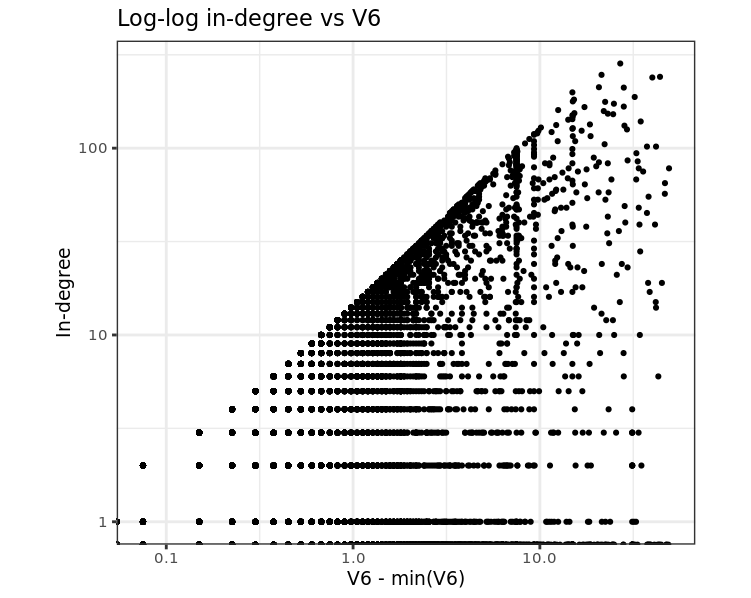
Scatterplot offset V6 variable and incoming graph degree from elliptic_txs_edgelist
The graph shows that for each in-degree value there is an upper limit of V6 values, in addition, if you sort V6 and find the difference between similar values, it will change as an integer times a constant:

The unique values of the change of sorted V6 (diff_V6), the encountered frequency (Freq) of diff_V6 values and the ratio of diff_V6 to the minimum value from diff_V6.
In the V6 change table, you can see that 0.075038 occurs much more often than other values and is probably associated with a change in-degree by 1. Given that the minimum number of entries in a transaction is 1 (if it is not a coinbase transaction), we write:
inputs_count_V6 = (V6 - min (V6)) / min (diff_V6) + 1.
After a similar analysis for V7, V8, V16:
- inputs_count_V6 = 13.3266685112665 * V6 + 2.62544842444139,
- inputs_unique_count_V8 = 11.9243179897452 * V8 + 2.34747189219164,
- outputs_count_V7 = 50.3777694891647 * V7 + 4.21030186142152,
- outputs_unique_count_V16 = 49.3957564403755 * V16 + 4.121809499973.
Here inputs_count_V6 is the total number of entries in the transaction, inputs_unique_count_V8 is the number of unique entries in the transaction, outputs_count_V7 is the number of exits from the transaction, outputs_unique_count_V16 is the number of unique exits.
The question may arise - why is V6 and not V8 mapped to inputs_count? The answer is simple, always inputs_count> = inputs_unique_count, and substituting the values of V6 and V8 from elliptic_txs_features.csv into the indicated formulas, we can make sure that the inequality (13.3266685112665 V6 + 2.62544842444139)> = (11.9243179897452 V8 + 2.34747189 always works the same way correlate between V6, V8, inputs_count and inputs_unique_count. The same goes for outputs_count and outputs_unique_count.
After you find the number of inputs and outputs, as well as the number of unique inputs and unique outputs, you can find transactions in which combinations of these numbers occur only once in the entire history of Bitcoin (until the publication of the Elliptic dataset). This allows you to find unique transactions and approximate times for each elliptic_time value:
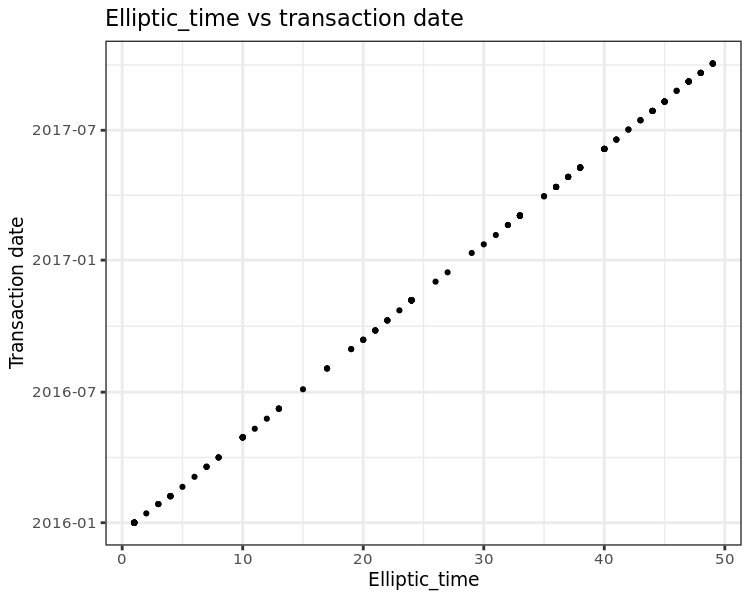
Date of unique transactions found for each elliptic_time.
The graph above shows that the date is linearly dependent on elliptic_time:
approx_time = 1450468509.80488 + 1155672.19512195 * elliptic_time.
Here approx_time is an approximate unixtime for each elliptic_time. And since elliptic_time varies from 1 to 49, the approx_time date changes from 2016-01-01 to 2017-10-04, in increments of 1155672.19512195 / 3600/24 = 13.37584 days.
Given the time constraints on possible transactions and combinations of a unique number of inputs and outputs, you can find 189 transactions that are suitable for these conditions and are found only once in the entire Bitcoin blockchain. For example, a transaction with 1 input and 13107 outputs, there is only one - dd9f6bbf80ab36b722ca95d93268667a3ea6938288e0d4cf0e7d2e28a7a91ab3.
Now you can find other characteristics of transactions, such as fee, as well as the total input (total_in_value) and output (total_out_value) volume in Satoshi. Correlation search and linear regression help to do this quickly, I will give only final formulas:
- fee_V4 = 81341.4537626213 + 386323.710952989 * V4,
- total_out_value_V3 = 2742460603.92287 + 15853961614.9796 * V3.
We will find the required value total_in_value from the equality:
total_in_value = total_out_value + fee.
The total information found allows us to identify 92.9% of all Elliptic dataset transactions. The other part can be revealed if you use the transaction graph from elliptic_txs_edgelist.csv, comparing it with a graph built on many suitable transactions with their connections recorded on the blockchain, this adds another 6.6%.
Thus, 99.5% of all anonymous transactions are easily disclosed, the remaining 0.5% can also be identified, but the time spent on their deanonymization is likely to be comparable to the time spent on the already disclosed part of the transactions. You can see the deanonymized dataset here . And here is the original Elliptic data.