Firstly, although the tests worked, and quite successfully, we did not have a clear understanding of what was covered by the tests and what wasn’t. Of course, there was some idea of the degree of coverage, but we did not measure it quantitatively. Secondly, the composition of tests increased over time and different tests often tested the same thing, because in different screenshots, some part coincided with the same part, but in a different screenshot. As a result, even minor changes in CSS could overwhelm many tests at once and require updating a large number of standards. Thirdly, a dark theme appeared in our product, and in order to somehow cover it with tests, some tests were selectively switched to using a dark theme, which also did not add clarity to the problem with determining the degree of coverage.
Performance optimization
We started, oddly enough, with performance optimization. I will explain why. Our visual tests are based on the Storybook . Each story in the storybook is not a single component, but a whole “block” (for example, a grid with a list of entities, an entity card, dialogue, or even the application as a whole). To display this block, you need to “pump” the story with data, not only the data displayed to the user, but also the state of the components used inside the block. This information is stored along with the source code in the form of json files containing a serialized representation of the state of the application (redux store). Yes, this data is, to put it mildly, redundant, but it greatly simplifies the creation of tests. To create a new test, we simply open the desired card, list or dialog in the application, take a snapshot of the current state of the application and serialize it into a file. Then we add a new story and tests that take screenshots of this story (all in a few lines of code).
This approach inevitably increases the size of the bundle. The degree of data duplication in it simply “rolls over”. When running tests, the gemini engine executes each test suite in a separate browser session. Each session loads the bundle anew and the size of the bundle in such a scheme is far from the last value.
To reduce the test run time, we reduced the number of test-suites by increasing the number of tests in them. Thus, one test suite could affect several story at once. In this scheme, we practically lost the ability to “screen” only a certain area of the screen due to the fact that Gemini allows you to set the screenshot area only for the test suite as a whole (although the API allows you to do this before each screenshot, but in practice it does not work).
The inability to limit the area of the screenshot in the tests led to the duplication of visual information in the reference images. While there were not many tests, this problem did not seem significant. Yes, and UI did not change very often. But this could not last forever - the redesign loomed on the horizon.
Looking ahead, I’ll say that in Hermione a screenshot area can be set for each shot and, at first glance, switching to a new engine would solve all the problems. But we would still have to “crush” large test suites. The fact is that visual tests are not stable in nature (this can be due to various reasons, for example, with network lags, using animations, or with “weather on Mars”) and it’s very difficult to do without automatic retries. Both Gemini and Hermione perform retries for the test suite as a whole, and the “thicker” the test suite is, the less likely it will be to complete successfully during retries, as on the next run, tests that were previously successfully completed may fall. For thick test suites, we had to implement an alternative retry scheme built into the Gemini engine and really did not want to do this again when switching to a new engine.
Therefore, in order to speed up the loading of the test-suite, we split the monolithic bundle into parts, separating each snapshot of the application state into a separate “piece”, loaded “on demand” for each story separately. The story creation code now looks like this:
// visual-regression.stories.js import React from 'react'; import StoryProvider from './story-provider'; const stories = storiesOf('visual-regression', module); [ { name: 'Contract', loadData: import('./snapshots/contract.testdata') }, { name: 'ExecutionTask', loadData: import('./snapshots/execution-task.testdata') }, { name: 'ExecutionAssignment', loadData: import('./snapshots/execution-assignment.testdata') }, { name: 'DocumentTemplate', loadData: import('./snapshots/document-template.testdata') }, { name: 'Explorer', loadData: import('./snapshots/explorer.testdata') }, { name: 'Inbox', loadData: import('./snapshots/inbox.testdata') }, ] .map(story => { stories .add(story.name, () => <StoryProvider loadSnapshot={story.loadData} />) .add(`${story.name}Dark`, () => <StoryProvider loadSnapshot={story.loadData} theme='night' />); });
To create a story, the StoryProvider component is used (its code will be given below). Snapshots are loaded using the dynamic import function. Different stories differ from each other only in pictures of states. For a dark theme, its own story is generated, using the same snapshot as story for a light theme. In the context of a storybook, it looks like this:
Default theme story 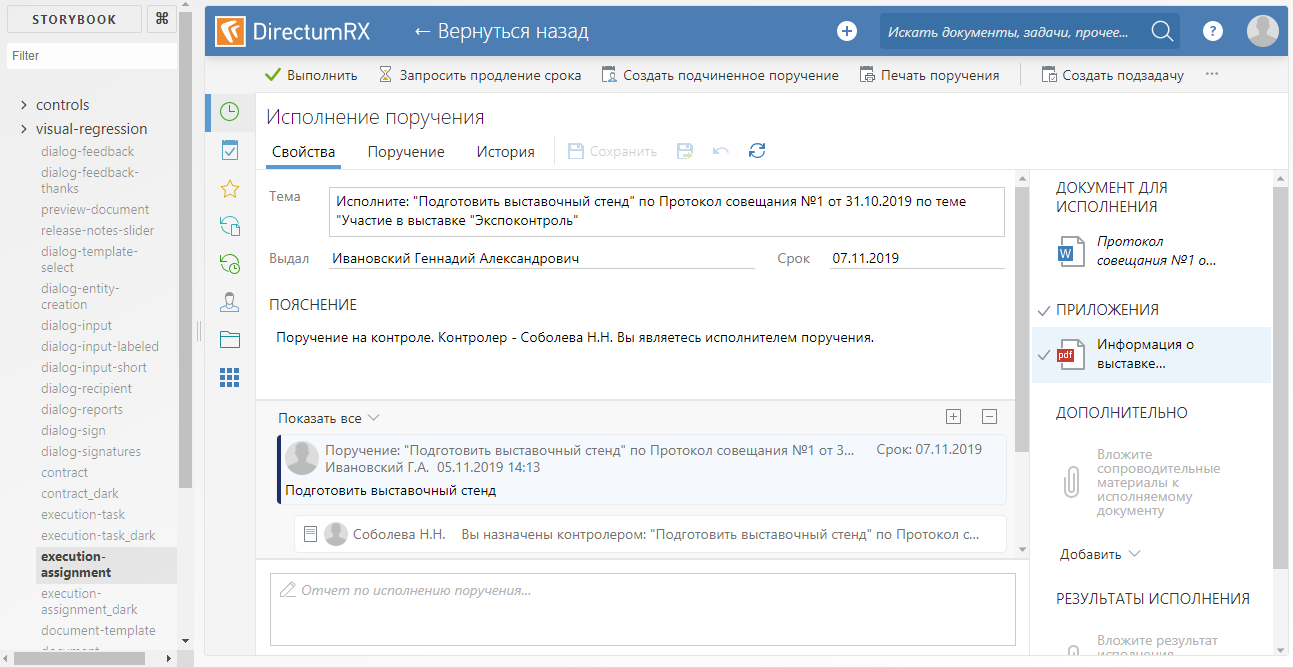
Dark theme story 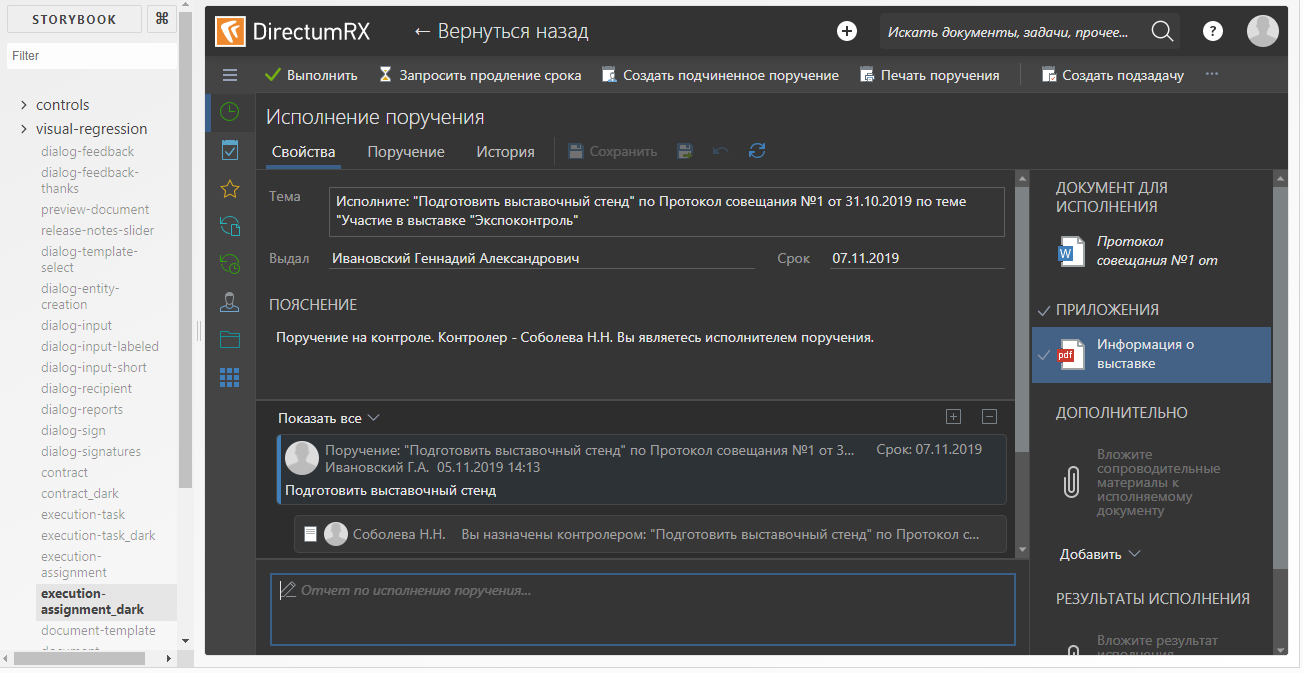
The StoryProvider component accepts a callback to load a snapshot in which the import () function is called. The import () function works asynchronously, so you cannot take a screenshot immediately after loading the story - we risk removing the void. In order to catch the moment of the end of the download, the provider renders a marker DOM element signaling the test engine for the duration of the download, which needs to be delayed with the screenshot:
story-provider.js
// story-provider.js const propsStub = { // -, . . . }; type Props = { loadSnapshot: () => Object, theme: ?string }; const StoryProvider = (props: Props) => { const [ snapshotState, setsnapshotState ] = React.useState(null); React.useEffect(() => { // (async() => setsnapshotState((await props.loadSnapshot).default))(); }); if (!snapshotState) // , return <div className={'loading-stub'}>Loading...</div>; // snapshotState.metadata = require('./snapshots/metadata'); // redux- const store = createMockStore(snapshotState); // applyTheme(props.theme); return ( <Provider store={store}> <MemoryRouter> <App {...propsStub} /> </MemoryRouter> </Provider> ); }; export default StoryProvider;
Additionally, to reduce the size of the bundle, disable the addition of source maps to the bundle. But in order not to lose the ability to debug the story (you never know what), we do this under the condition:
.storybook / webpack.config.js
// .storybook/webpack.config.js ... module.exports = { ... devtool: process.env.NODE_ENV === 'vr-test' ? '(none)' : 'eval-source-map' };
package.json
// package.json { ... "scripts": { ... "storybook": "start-storybook", "build-storybook": "cross-env NODE_ENV=vr-test build-storybook -o ./storybook-static", ... },
The npm run build-storybook script compiles a static storybook without sourcemap into the storybook-static folder. It is used when performing tests. And the npm run storybook script is used to develop and debug test stories.
Elimination of duplication of visual information
As I said above, Gemini allows you to set screenshot area selectors for the test suite as a whole, which means that to completely solve the problem of duplicating visual information in the screenshots, we would have to make our own test suite for each screenshot. Even taking into account the optimization of loading the story, it did not look too optimistic in terms of speed and we thought about changing the test engine.
Actually, why Hermione? At the moment, the Gemini repository is marked as deprecated and, sooner or later, we had to “move” somewhere. The structure of the Hermione configuration file is identical to the structure of the Gemini configuration file, and we were able to reuse this config. Gemini and Hermione plugins are also common. In addition, we were able to reuse the test infrastructure - virtual machines and deployed selenium-grid.
Unlike Gemini, Hermione is not positioned as a tool only for regression testing of layout. Its browser manipulation capabilities are much wider and limited only by the capabilities of Webdriver IO . In combination with mocha, this engine is convenient to use more for functional testing (simulating user actions) than for layout testing. For regression testing of layout Hermione provides only the assertView () method, which compares a screenshot of a browser page with a reference. The screenshot can be limited to the area specified using css selectors.
For our case, the test for each individual story would look something like this:
// describe('Visual regression', function() { it('Contract card should equal to etalon', function() { return this.browser // story .url('http://localhost:8080/iframe.html?selectedKind=visual-regression&selectedStory=ContractDark') // , story .waitForVisible('.loading-stub', true) // .assertView('layout', '.form'); }) });
The waitForVisible () method, despite its name, allows you to expect not only the appearance, but also the hide of an element, if you set the second parameter to true. Here we use it to wait for a marker element to be hidden, indicating that the data snapshot is not yet loaded and story is not yet ready for a screenshot.
If you try to find the waitForVisible () method in the Hermione documentation, you won’t find anything. The fact is that the waitForVisible () method is the Webdriver IO API method . The url () method, respectively, too. In the url () method, we pass the frame address of a particular story, not the entire storybook. Firstly, this is necessary so that the stories list is not displayed in the browser window - we do not need to test it. Secondly, if necessary, we can have access to DOM elements inside the frame (webdriverIO methods allow you to execute JavaScript code in a browser context).
To simplify the writing of tests, we made our wrapper on mocha-tests. The fact is that there is no special sense in the detailed elaboration of test cases for regression testing. All test cases are the same - 'should equal to etalon'. Well, I do not want to duplicate the code for waiting for data loading in each test either. Therefore, the same work for all “monkey” tests is delegated to the wrapper function, and the tests themselves are written declaratively (well, almost). Here is the text of this function:
create-test-suite.js
const themes = [ 'default', 'dark' ]; const rootClassName = '.explorer'; const loadingStubClassName = '.loading-stub'; const timeout = 2000; function createTestSuite(testSuite) { const { name, storyName, browsers, testCases, selector } = testSuite; // , browsers && hermione.only.in(browsers); // themes.forEach(theme => { describe(`${name}_${theme}`, () => it('should equal to etalon', function() { let browser = this.browser // story .url(`${storybookUrl}/iframe.html?selectedKind=visual-regression&selectedStory=${storyName}-${theme}`) // .waitForVisible(loadingStubClassName, timeout, true) .waitForVisible(rootClassName); // ( ) if (testCases && testCases.length > 0) { testCases.forEach(testCase => { if (testCase.before) browser = testCase.before(browser); browser = browser.assertView(`${name}__${testCase.name}_${theme}`, testCase.selector || selector || rootClassName, testCase.options); }); return browser; } // , return browser.assertView(`${name}_${theme}`, selector || rootClassName); })); }); }
An object describing the test suite is passed to the input of the function. Each test suite is built according to the following scenario: we take a screenshot of the main layout (for example, the area of the entity card or the area of the entity list), then programmatically press the buttons that can lead to the appearance of other elements (for example, pop-up panels or context menus) and “screenshot »Each such element separately. Thus, we simulate user actions in the browser, but not with the goal of testing some kind of business scenario, but simply in order to “capture” the maximum possible number of visual components. Moreover, duplication of visual information in the screenshots is minimal, because screenshots are taken "pointwise" using selectors. Test suite example:
explorer-suite.js
// explorer-suite.js // module.exports = { // story, storyName: 'explorer', // name: 'explorer', // , browsers: [ 'chrome-1920x1080', 'ie-1920x1080' ], // testCases: [ { // name: 'layout' }, { // name: 'notification-area', selector: '.notification-area__popup', before: b => b .click('.notification-area__popup-button') .waitForVisible('.notification-area__popup') .execute(function() { // document.querySelectorAll('.expandable-item__content')[2].click(); }) }, //... ] };
tests.js
// tests.js [ require('./suites/explorer-suite'), //... ] .forEach(suite => createTestSuite(suite));
Determination of coverage
So, we figured out the speed and redundancy, it remains to figure out the effectiveness of our testing, that is, to determine the degree of coverage of the code with tests (here by code I mean CSS style sheets).
For test stories, we empirically selected the most difficult to fill cards, lists and other elements to cover as many styles as possible with one screenshot. For example, to test an entity card, cards with a large number of different types of controls (text, number, transfers, dates, grids, etc.) were selected. Cards for different types of entities have their own specifics, for example, from a document card you can show a panel with a list of document versions, and the task card displays the correspondence on this task. Accordingly, for each type of entity, its own story and a set of tests specific to this type, etc., were created. In the end, we figured that everything seemed to be covered by tests, but we wanted a little more confidence than “like”.
To evaluate coverage in Chrome DevTools, there is a tool with the name Coverage very suitable for this case:
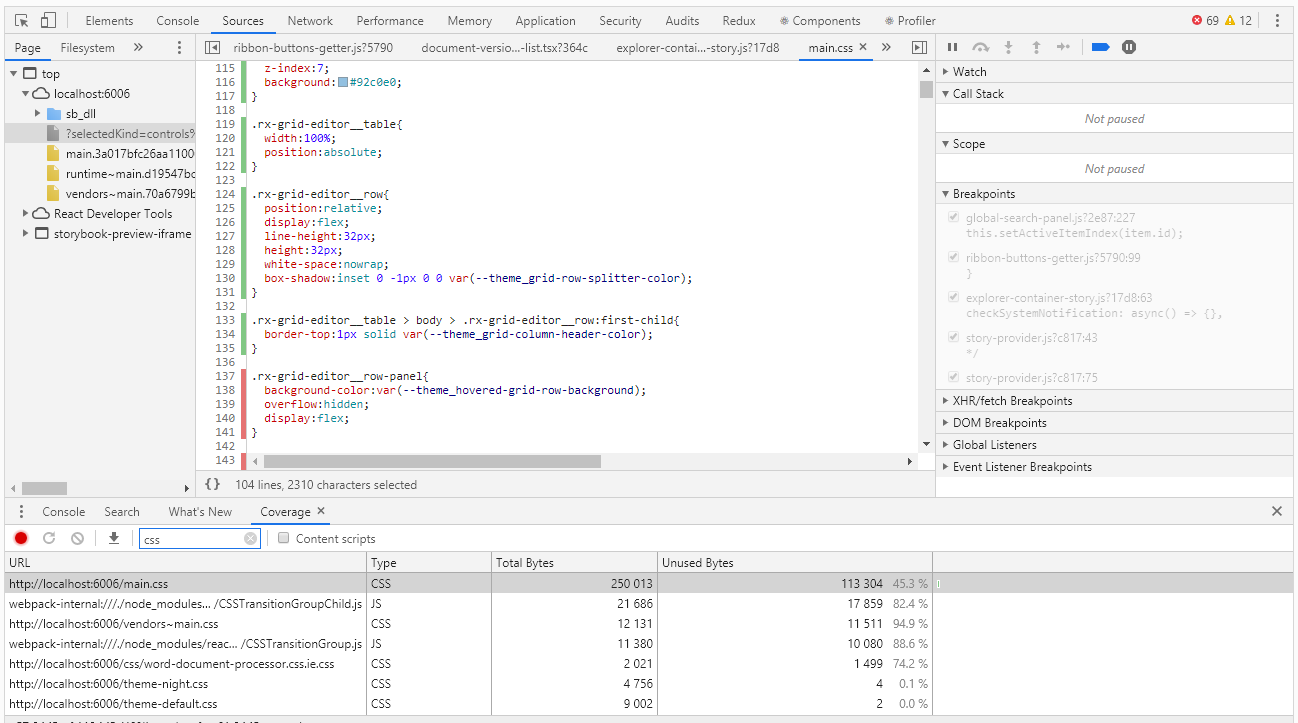
Coverage allows you to determine which styles or which js code was used when working with the browser page. The report on the use of green stripes indicates the code used, red - not used. And everything would be fine if we had a hello, world application, but what if we have thousands of lines of code? Coverage developers understood this well and provided for the ability to export the report to a file that can already be worked out programmatically.
I must say right away that so far we have not found a way to collect the degree of coverage automatically. Theoretically, this can be done using the pupeteer headless browser, but pupeteer does not work under the control of selenium, which means that we will not be able to reuse the code of our tests. Therefore, for now, we will skip this extremely interesting topic and work with pens.
Having run the tests in manual mode, we get a coverage report, which is a json file. In the report for each css, js, ts, etc. the file indicates its text (in one line) and the intervals of the code used in this text (in the form of character indices of this line). Below is a piece of the report:
coverage.json
[ { "url": "http://localhost:6006/theme-default.css", "ranges": [ { "start": 0, "end": 8127 } ], "text": "... --theme_primary-accent: #5b9bd5;\r\n --theme_primary-light: #ffffff;\r\n --theme_primary: #f4f4f4;\r\n ..." }, { "url": "http://localhost:6006/main.css", "ranges": [ { "start": 0, "end": 610 }, { "start": 728, "end": 754 } ] "text": "... \r\n line-height:1;\r\n}\r\n\r\nol, ul{\r\n list-style:none;\r\n}\r\n\r\nblockquote, q..." ]
At first glance, there is nothing difficult in finding unused css selectors. But then what to do with this information? Indeed, in the final analysis, we need to find not specific selectors, but components that we forgot to cover with tests. Styles of one component can be set by more than a dozen selectors. As a result, based on the results of the analysis of the report, we get hundreds of unused selectors, and if you deal with each of them, you can kill a lot of time.
Here, regular expressions help us. Of course, they will only work if the naming conventions for css classes are fulfilled (in our code, css classes are named according to the BEM methodology - block_name_name_name_modifier). Using regular expressions, we calculate the unique values of the block names, which are no longer difficult to associate with the components. Of course, we are also interested in elements and modifiers, but not in the first place, first we need to deal with a larger “fish”. Below is a script for processing a Coverage report
coverage.js
const modules = require('./coverage.json').filter(e => e.url.endsWith('.css')); function processRange(module, rangeStart, rangeEnd, isUsed) { const rules = module.text.slice(rangeStart, rangeEnd); if (rules) { const regex = /^\.([^\d{:,)_ ]+-?)+/gm; const classNames = rules.match(regex); classNames && classNames.forEach(name => selectors[name] = selectors[name] || isUsed); } } let previousEnd, selectors = {}; modules.forEach(module => { previousEnd = 0; for (const range of module.ranges) { processRange(module, previousEnd, range.start, false); processRange(module, range.start, range.end, true); previousEnd = range.end; } processRange(module, previousEnd, module.length, false); }); console.log('className;isUsed'); Object.keys(selectors).sort().forEach(s => { console.log(`${s};${selectors[s]}`); });
We execute the script by first putting the coverage.json file exported from Chrome DevTools and writing the exhaust to a .csv file:
node coverage.js> coverage.csv
You can open this file using excel and analyze the data, including determining the percentage of code coverage by tests.

Instead of a resume
Using the storybook as a basis for visual tests has fully paid off - we have a sufficient degree of coverage of the css code with tests with a relatively small number of stories and minimal costs for creating new ones.
The transition to a new engine allowed us to eliminate duplication of visual information in screenshots, which greatly simplified the support of existing tests.
The degree of coverage of the css code is measurable and, from time to time, is monitored. There is of course a big question - how not to forget about the need for this control and how not to miss something in the process of collecting information about coverage. Ideally, I would like to measure the degree of coverage automatically at each test run, so that when the specified threshold is reached, the tests would fall with an error. We will work on it, if there is news, I will definitely tell you.