
I would like to tell you about a solution that helps to detect these very attacks and that is made on our network. It is free, based on analysis of NetFlow data, therefore it is simple and very effective.
In fact, there are a lot of systems for detecting Ddos attacks based on the analysis of data from the NetFlow / SFlow / IPFIX protocols (probably almost all?). In a first approximation, the essence of all such systems comes down to setting thresholds for the number of packets / streams / octets for a certain type of traffic to a specific IP, upon exceeding which the system signals a possible attack. And our decision is no different from them in this regard. However, the main problem is that most of them are paid. And the free versions offer a rather crude analysis, which is often inefficient (for example, it allows you to set a threshold only for all traffic to a specific IP, without first filtering it, which is almost always useless in the case of transit traffic analysis).
So, first you need to configure the NetFlow protocol on network equipment with the minimum possible active timeout (the interval at which data is exported from the equipment to the collector) - this is 60s for Cisco and Juniper.
We configure Netflow on a router
Our core router is Juniper MX480, and it will be sending telemetry. First, configure the sampling:
Here:
Then we hang it on the interfaces, where we will collect statistics (at least it should be uplink interfaces):
forwarding-options { sampling { input { rate 2000; run-length 0; } family inet { output { flow-inactive-timeout 15; flow-active-timeout 60; flow-server 10.0.0.10 { port 9999; autonomous-system-type origin; source-address 10.0.0.1; version 5; } } } } }
Here:
- rate and run-length are responsible for sampling statistics. For traffic analysis, one of the 2000 packets is taken. Data taken from Juniper recommendations for 10G interfaces. (Surprisingly, I found that I can’t find these recommendations now)
- flow-active-timeout 60; - the above interval at which the data is exported to the collector
- flow-inactive-timeout 15; - the inactivity interval after which the stream is considered completed.
- autonomous-system-type origin; - Export the source AS number (Not necessary for our task, but necessary for Traffic Engineering)
- version 5 - here we need to make a small digression. The choice of the 5th version, and not the 9th, is due to two reasons. Firstly, for the 9th version to work, you need an additional board in Juniper. Secondly, the selected collector must understand the 9th version (spoiler: he does not understand). However, the fifth version is quite suitable for our task.
Then we hang it on the interfaces, where we will collect statistics (at least it should be uplink interfaces):
interfaces { ae1 { vlan-id ...; family inet { sampling { input; output; } address ... } } }
Next, we need to configure the NetFlow collector, which will collect statistics data from the equipment.
As a collector, it was decided to use many familiar flow-capture from the flow-tools utility set. It is the set of utilities that allows you to build a variety of and detailed reports based on the collected statistics is the main advantage of this package. (By the way, the utility set also has flow-dscan for detecting host / port scans and other unwanted activity). The disadvantages include the lack of a web shell and the lack of support for the 9th version of NetFlow. However, I repeat, the flexibility of such utilities as flow-nfilter, flow-report and, of course, free distribution easily block everything.
Configure flow-tools on the server
The server on which the collector works, in our case under FreeBSD (of course flow-tools is also available for linux).
Add to /etc/rc.conf:
Here:
-z0 - file compression (0 - off)
-n1439 - the number of files that the collector will create per day. By default, 95 is one file in 15 minutes. 1439 - The maximum value is one file per minute. We need to create files as quickly as possible.
-N3 is the nesting level of files and folders (YYYY / YYYY-MM / YYYY-MM-DD / flow-file)
-E10G - disk space limit. Will delete old files so that the total volume of telemetry files is less than this number. Very useful thing, sorry it doesn’t clean up the created directories.
-e0 - the same thing only about the number of files (0 - do not follow)
-S1 - log message about received / lost / processed threads every minute
# cd /usr/ports/net-mgmt/flow-tools # make install clean
Add to /etc/rc.conf:
flow_capture_enable="YES" flow_capture_localip="10.0.0.10" # ip flow_capture_remoteip="10.0.0.1" #ip flow_capture_port="9999" # flow_capture_datadir="/var/db/flows" # flow_capture_flags="-z0 -n1439 -N3 -E10G -e0 -S1" #
Here:
-z0 - file compression (0 - off)
-n1439 - the number of files that the collector will create per day. By default, 95 is one file in 15 minutes. 1439 - The maximum value is one file per minute. We need to create files as quickly as possible.
-N3 is the nesting level of files and folders (YYYY / YYYY-MM / YYYY-MM-DD / flow-file)
-E10G - disk space limit. Will delete old files so that the total volume of telemetry files is less than this number. Very useful thing, sorry it doesn’t clean up the created directories.
-e0 - the same thing only about the number of files (0 - do not follow)
-S1 - log message about received / lost / processed threads every minute
Of the entire set of flow-tools utilities, we will be interested in three:
- Flow-nfilter - allows you to filter statistics by such parameters as ip address / protocol / port. We will need it for a kind of whitelist IP, which must be excluded from the scan. For example, the IP addresses of the Google cache servers on your network (or any other caches), where a sufficiently high traffic flow can falsely signal a DDoS attack. Create a filters.cfg file with a filter (ip-addresses for example):
filter-primitive white-list-ip type ip-address-prefix deny 8.8.8.8 deny 64.233.160.0/19 default permit filter-definition white-list match ip-destination-address white-list-ip match ip-source-address white-list-ip
- Flow-report - a utility that allows you to build reports by grouping traffic and sorting data according to specified parameters. Something similar to the Groups By function in SQL. There are many types of reports that it can generate (many of them can be useful for Traffic Engineering). We are interested in the following:
- ip-destination-address / ip-source / destination-port - grouping of flows, as you might guess, by ip-destination address, source / dest port. This means that all streams with the same ip-destination-address & ip-source & destination-port will be merged and presented in the report in sorted order, for example, by stream or packet (unless of course you specify this sort). This kind of report will allow you to identify the so-called DDoS attacks with a reflection on some service. For example, if an abnormally large number of flows from port 53 to port 80 of a host are detected, we can talk about a possible attack. This is convenient, since in most cases there are few such flows, and if the threshold is set correctly, an attack can be detected even with minimal resulting traffic. In order to set up a report, you need to create a file with its description. Create the reports.cfg file:
stat-report sdport_flows type ip-destination-address/ip-source/destination-port output format ascii options -header,-xheader,-totals,-names fields +flows,-octets,-packets,-duration sort +flows stat-definition sdport_flows report sdport_flows
- ip-destination-address / ip-destination-port is a coarser grouping that takes into account only two parameters. But it will work on packages. Add to the created reports.cfg file:
stat-report dport_packets type ip-destination-address/ip-destination-port output format ascii options -header,-xheader,-totals,-names fields -flows,-octets,+packets,-duration sort +packets stat-definition dport_packets report dport_packets
- ip-destination-address - and the coarsest grouping of the resulting traffic on a specific ip. Here we will create two reports on flows and on packages.
stat-report flows type ip-destination-address output format ascii options -header,-xheader,-totals,-names fields +flows,-octets,-packets,-duration sort +flows stat-definition flows report flows stat-report packets type ip-destination-address output format ascii options -header,-xheader,-totals,-names fields -flows,-octets,+packets,-duration sort +packets stat-definition packets report packets
- ip-destination-address / ip-source / destination-port - grouping of flows, as you might guess, by ip-destination address, source / dest port. This means that all streams with the same ip-destination-address & ip-source & destination-port will be merged and presented in the report in sorted order, for example, by stream or packet (unless of course you specify this sort). This kind of report will allow you to identify the so-called DDoS attacks with a reflection on some service. For example, if an abnormally large number of flows from port 53 to port 80 of a host are detected, we can talk about a possible attack. This is convenient, since in most cases there are few such flows, and if the threshold is set correctly, an attack can be detected even with minimal resulting traffic. In order to set up a report, you need to create a file with its description. Create the reports.cfg file:
- Flow-print - allows you to display the collected telemetry.
The resulting script (Python 3) with the set thresholds for each report will analyze the collected telemetry and, in the event of an attack (that is, exceeding the threshold for the report), drop a mail message with traffic decryption on the victim's IP for this minute.
I will not provide the script code, it is available on the GitHub files with filters.cfg and reports.fg files
For its operation, it is enough to configure some parameters in config.ini. And add it to the crowns for execution every minute.
Configuring config.ini
In particular, set thresholds for reports depending on the traffic intensity on your network, as well as on the settings of NetFlow sampling on network equipment.
Set file location paths and mail sending settings:
[REPORTS] sdport_flows dport_packets flows packets # Reports(rules) options # threshold - threshold value # key_field - report field index number to which the threshold applies # filter - name of a filter described in FiltersFileName [sdport_flows] threshold = 300 key_field = 4 filter = white-list [dport_packets] threshold = 3000 key_field = 3 filter = white-list [flows] threshold = 2000 key_field = 2 filter = white-list [packets] threshold = 5000 key_field = 2 filter = white-list
- threshold - threshold value, IP addresses in the report with the number of streams / packets exceeding this value are considered attacked.
- key_field - field index in the report output (starting from 1) to which the threshold is applied.
- filter - the name of the filter applied to the statistics data before grouping the data with the flow-report report.
Set file location paths and mail sending settings:
[FILES] # Dir with flow-tools binary files FlowToolsBinDir = /usr/local/bin/ # Dir with Whois, AWK binary files SysBinDir = /usr/bin/ FlowsDir = /var/db/flows/ ReportsFileName = reports.cfg FiltersFileName = filters.cfg [EMAIL] SMTPServer = localhost # 0-default port SMTPPort = 0 MailFrom = mail@example.com MailTo = mail@example.com Subject = [DDoS Detect] # Amount of flow-print records in an email FlowPrintTail = 50 # Use TLS (if True, Auth must be the same) Secure = False # Use Login and Password Auth = False # Notification Frequency about current DDoS attack - every value minutes # if 0 - don't send email, print victims ip to stdout NotifyFreq = 5 # Act if Auth = True [EMAIL-AUTH] Login = ... Password = ...
The attack notification email looks like this:
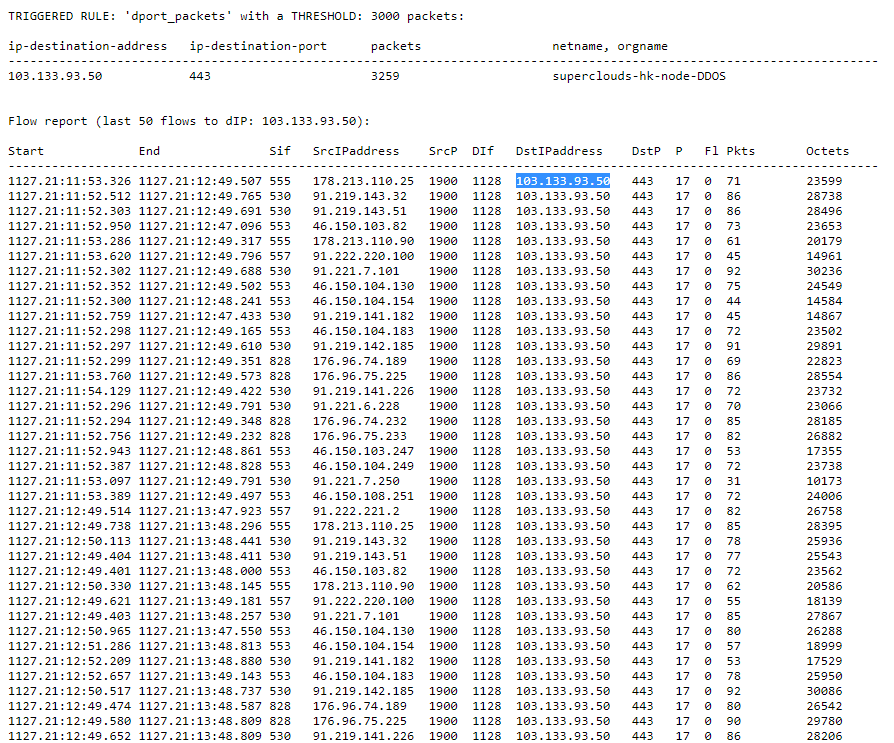
The script allows you to add / remove your reports on which traffic analysis will take place, set a filter for each report from the filters.cfg file, change the notification frequency for the current DDoS attack. It also allows you to list attacked IPs on stdout without sending an email.
Once again the link to Github
That's all. Thanks for attention!