
In previous articles, we talked about monitoring various databases in Quest Foglight for Databases and the approach to quickly localizing SQL Server performance problems . In this, we will show what other dashboards you can use based on the collected metrics. And these metrics are enough. Under the cat are screenshots of the interface and descriptions for them.
Foglight is a handy DBA tool that supports monitoring of SQL Server, Oracle, MySQL, PostgreSQL, DB2, SAP ASE, MongoDB, and Cassandra. And all this in one interface.
The header screenshot above shows the interface with the heat map of the databases. Similarly, the heat map of the databases in the other Quest monitoring product, Spotlight, is implemented. The image below shows that by clicking on each of the database instances a window appears with the corresponding events.

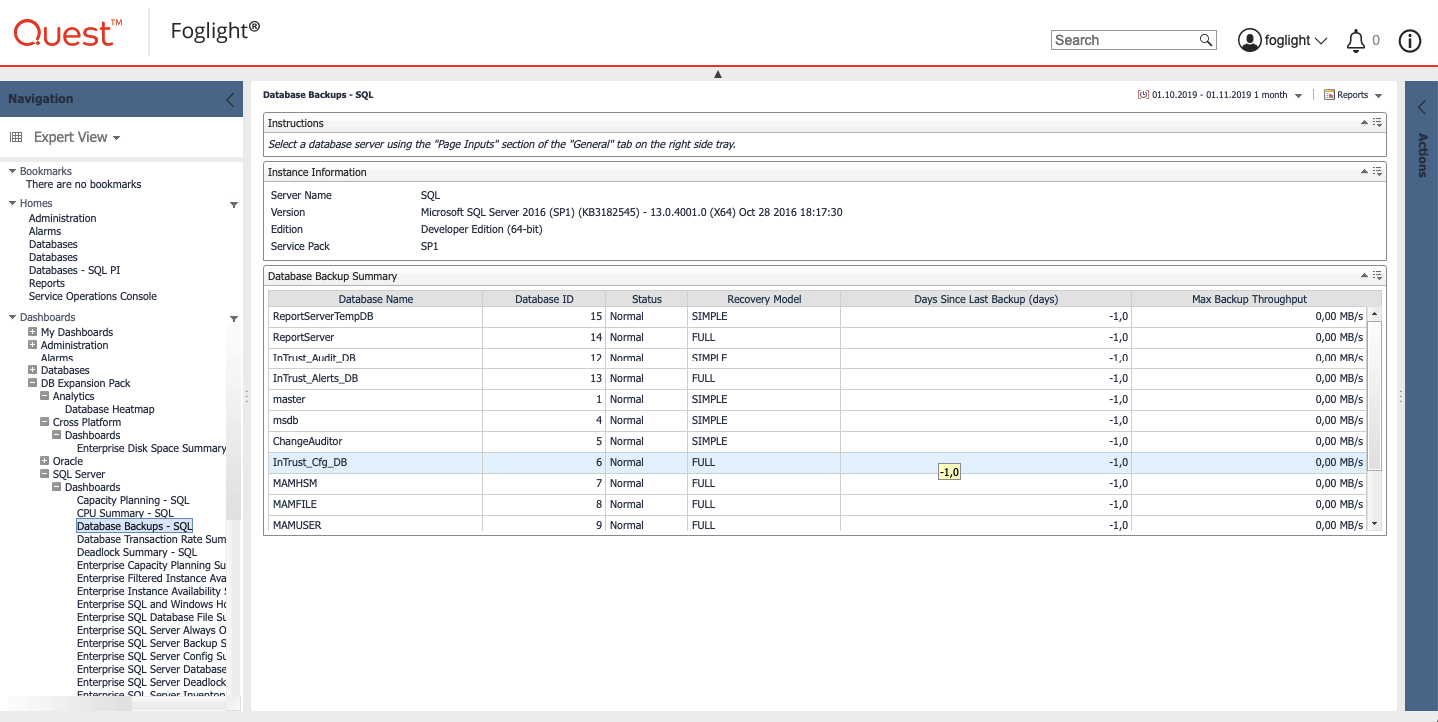
Another convenient view is backup data. Here, all the data is collected for all databases of the database instance (in this example, we consider SQL Server).
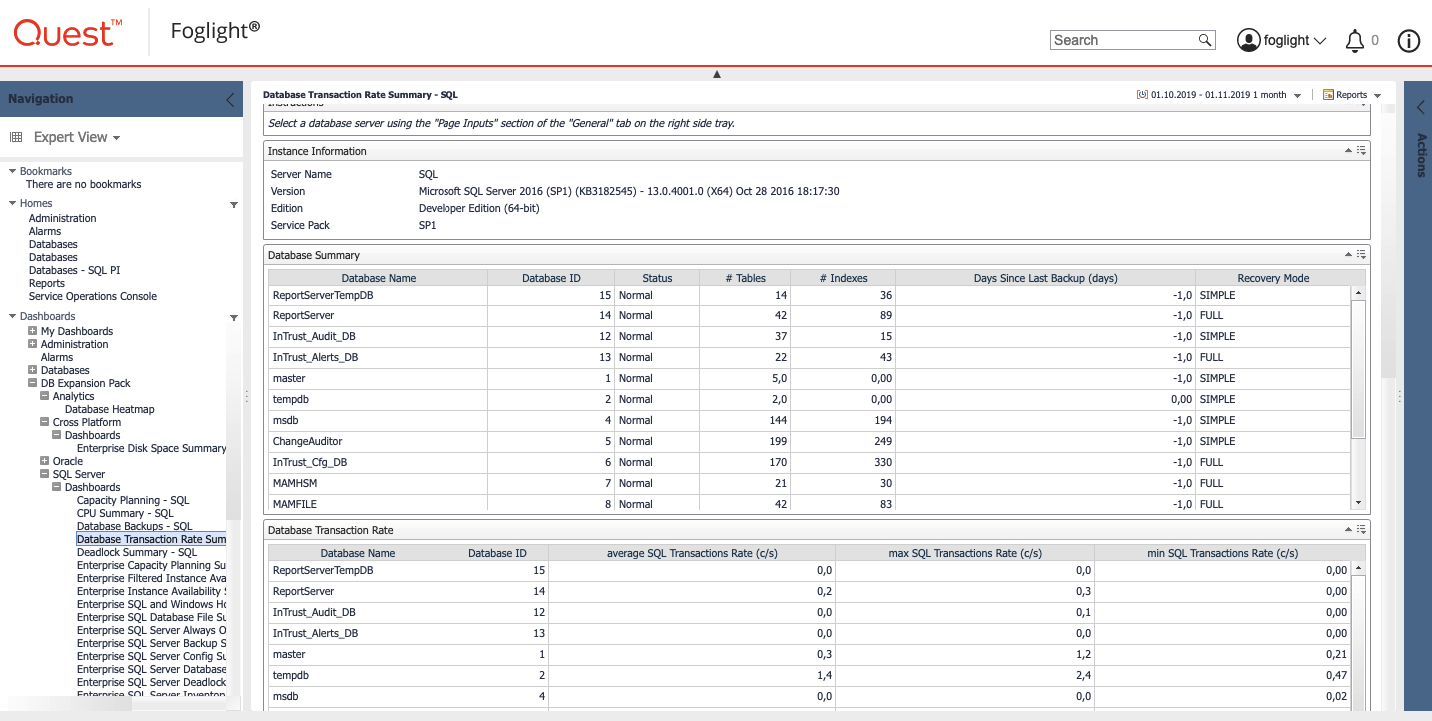
The following view is the number of tables, indexes, and transactions in each instance database.
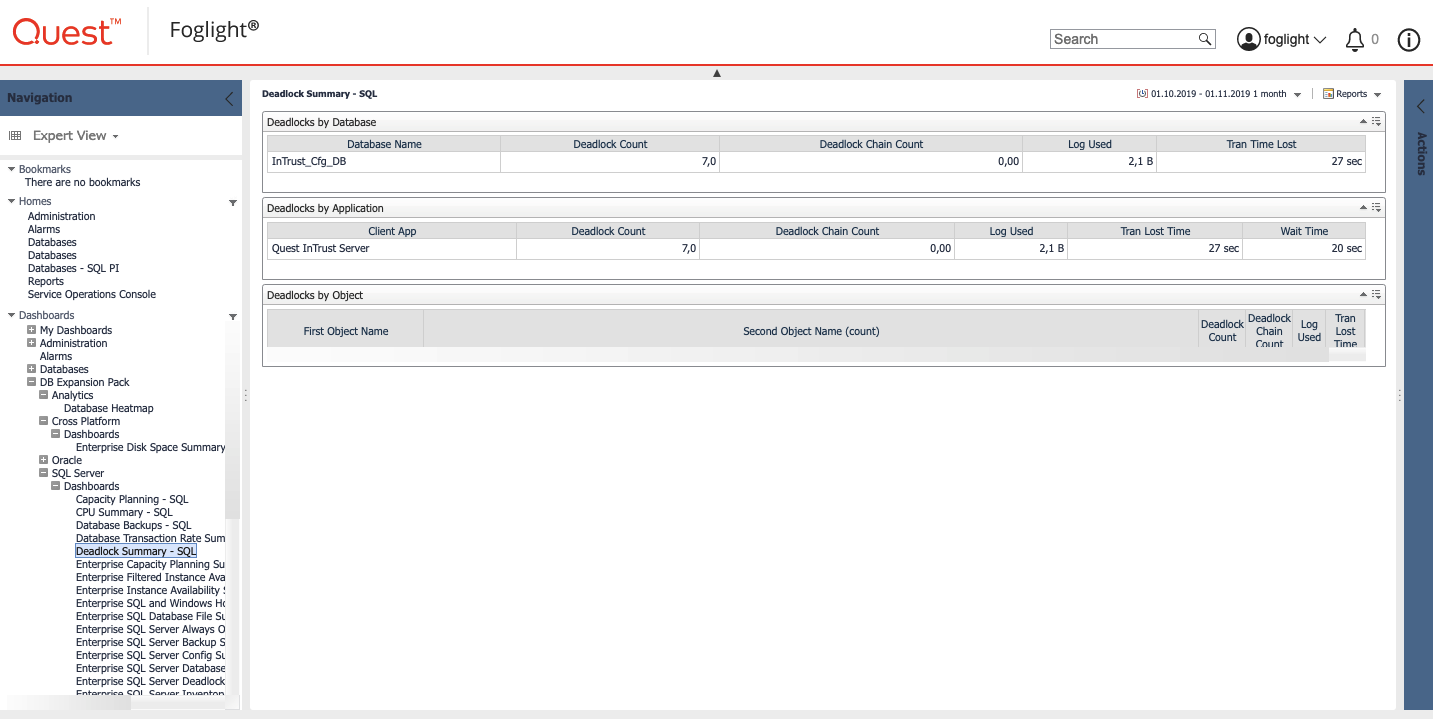
In the image below, data on deadlocks. There are not many of them in our demo laboratory, therefore it does not look very impressive. But there is important information - the database where the lock occurred and the application that caused it. A good point to start an investigation.
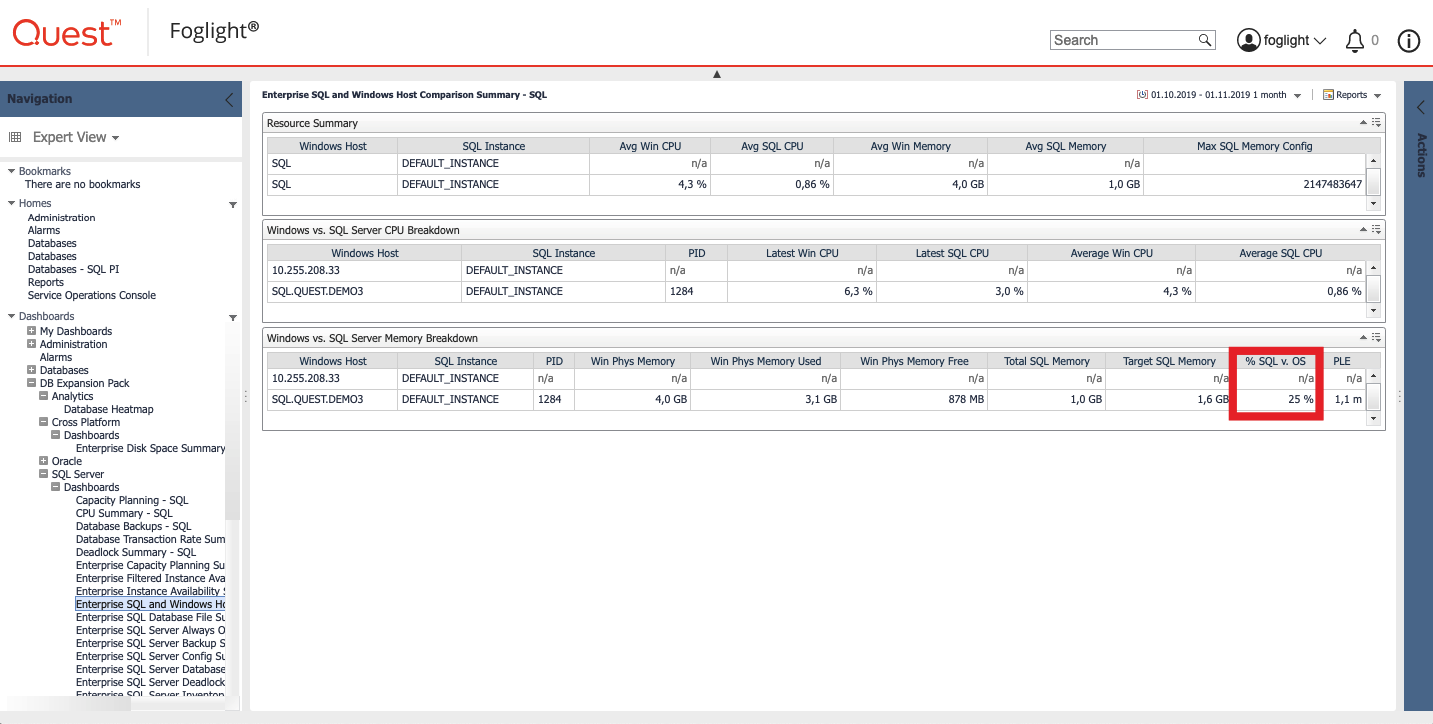
The next important view is the resource consumption of the database. Here is a view of the instances of SQL servers available on the system. The screenshot shows the column with memory consumption by the database instance in relation to the total consumption.
Abnormal values of the load indicators on the disk subsystem can tell about many problems. On this view, delays reading and writing to disk.

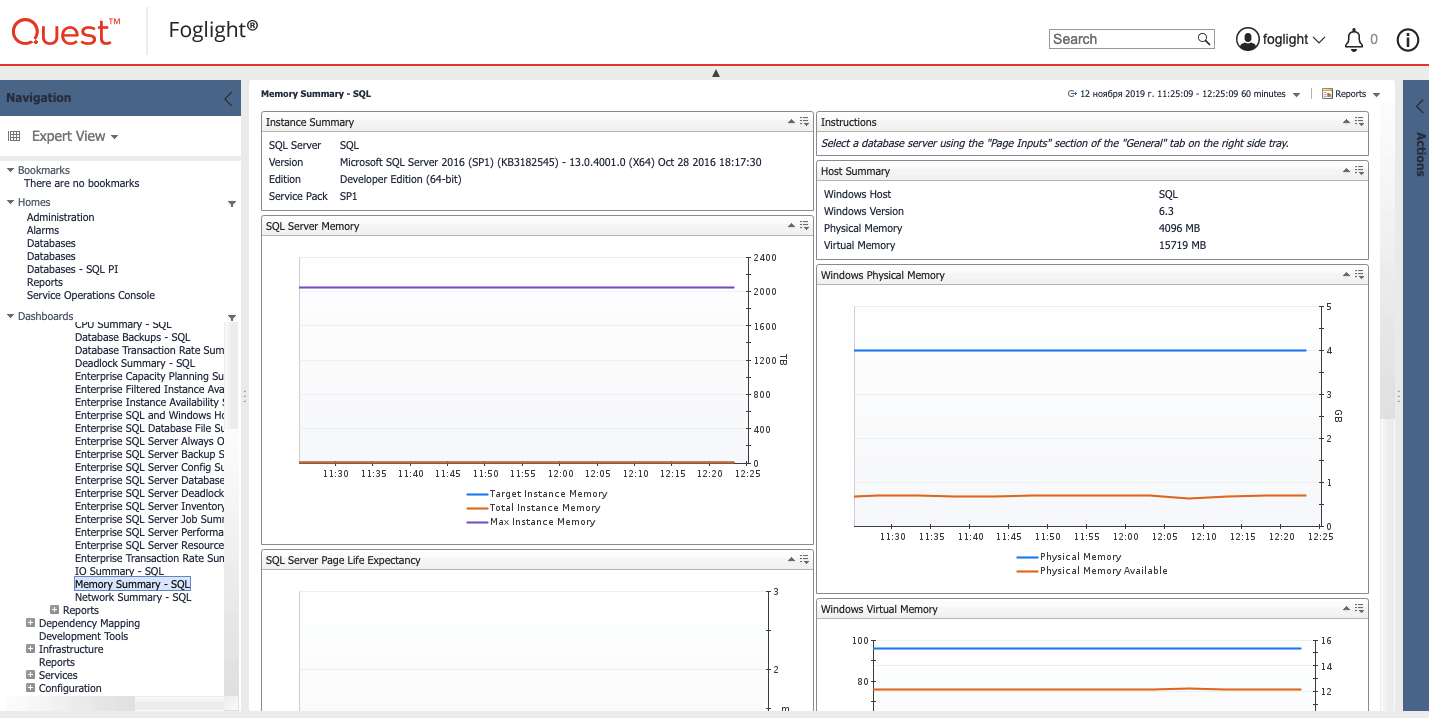
Similar to disk, there is an aggregating interface for memory consumption.
And on the use of the network subsystem.

In this collection, we showed ready-made dashboards, but you can display any metrics collected in the system on Foglight views. Or embed dashboards from external systems. Any of the submissions can be packaged in a report and sent on a regular basis to interested parties.
If you want to look at the performance of your databases from the Foglight interface, leave a request for a distribution kit and demo licenses or for a pilot project.
Read about free SQL Server management utilities.