A few years ago, I did my first freelance statistic job for a fruit and vegetable delivery company. Twenty-four hours a day, incoming products from farmers, before being sent to supermarkets, went through the quality control department. The choice of products was carried out randomly by employees of this department.
In the annual report, they noticed that the quality this year is lower than the quality in the past: the difference was about half a point on a scale of 1 to 10.
Then they invited me. I had to answer the question:
Are these 0.5 points a significant difference?
If you do not know the statistics, then this question may seem strange to you. But don't worry: the purpose of this article is to show you how to answer this question using hypothesis testing, also called statistical inference.
The game of numbers: the contribution of one apple
Imagine that you are checking an apple for good or bad, using a random selection of apples from a very large box with apples. In the image below we see the real effect of the sample size on the measurements: the effect of one apple is very significant for small samples and becomes less and less significant, the larger the sample size.
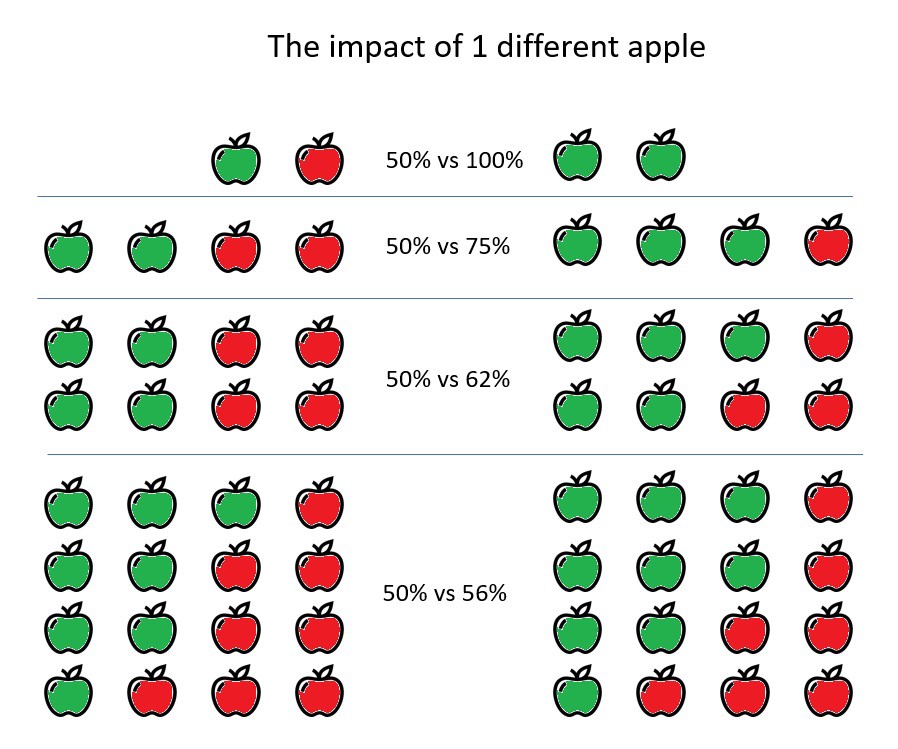
The contribution of one apple depends on the size of the sample.
Understanding the effect of sample size is the first basis for understanding hypothesis testing. We can begin to argue that 0.5 on 2 apples will be like a difference of 1 apple, very small. But for 100 apples, 0.5 will be a difference of 50 apples: a very big difference!
For small samples, 0.5 points is a small difference, but for large samples 0.5, this is a large difference.
How big the sample should be: hypothesis testing and significance as an answer
There are several ways to answer this question, but in this article I am going to dive into statistical inference or hypothesis testing.
Hypothesis testing is a family of statistical methods used to understand how sampling of observed objects can be used to accept or reject a predefined hypothesis. Hypothesis testing is used to solve many problems, mainly in scientific research and as a key method in online marketing (A \ B testing).
Mathematicians have developed a hypothesis test in such a way that there is a certain procedure for finding the truth.
Hypothesis testing allows you to only test hypotheses, but not to develop them.
From the box in which 100 apples (let's call it the population), we take a sample of 8 apples. This year, out of 8 apples, 5 were rotten (62%), and in the sample last year, out of 8 apples, only 4 were rotten (50%). We want to use a hypothesis test to determine if the percentage of rotten apples this year is greater than last year.
Hypothesis testing is a mathematical alternative to measuring the population. Thanks to these calculations, we can generalize the measurements of a small sample to a large population. So we do less work.
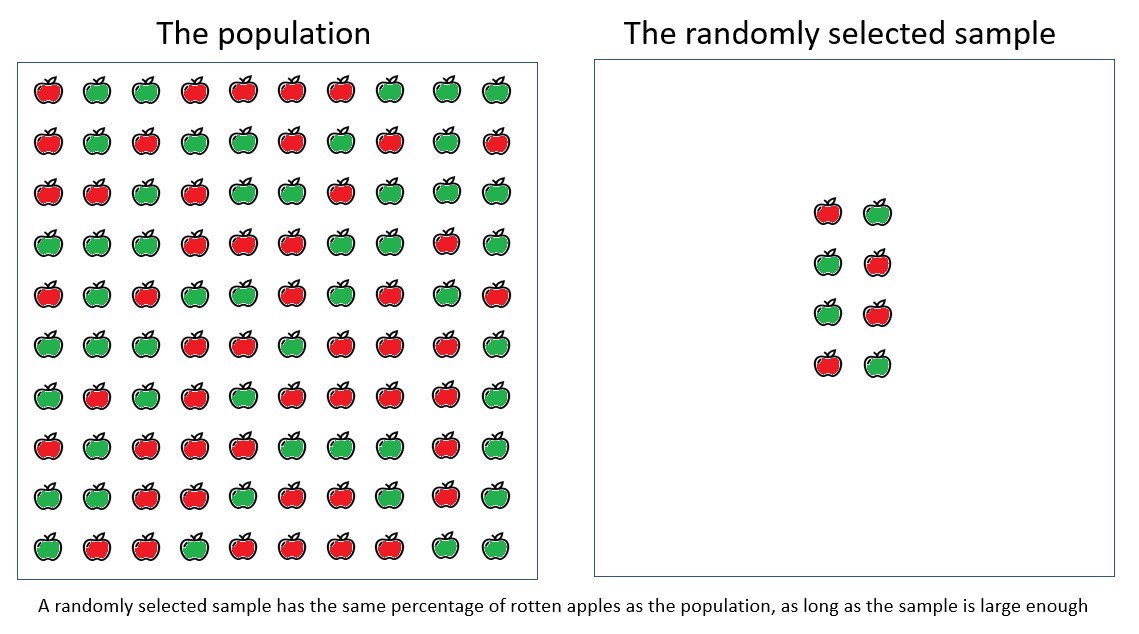
A randomly sampled sample has the same percentage of rotten apples as the general population, provided that the sampled sample is large enough.
Mathematicians have come up with a way to generalize the conclusion based on the sample to the general population.
This method begins with the formulation of a clear research hypothesis. Unfortunately, math only works if we already have an idea of what we want to test.
The main hypothesis for our example:
The percentage of rotten apples in the general population this year is more than in the past.
Actual hypothesis test
The mathematics of hypothesis testing forms a balance between the result of measurements of the sample with the number of observations. The result is a p-value.
These calculations go through the use of distributions: for almost every imaginary situation, a mathematical law has been derived that describes the expected result.
For yes / no questions, such as the question of our rotten apples (rotten / not rotten), the coin toss law applies. This is the simplest example of a mathematical law: 50% tails, 50% eagle.
It can also be very simply represented as a standard mathematical distribution that tells us about the probability of observations. For example, 7 eagles dropped out of 10 coin flips. This is called a binomial distribution and can be represented as follows:
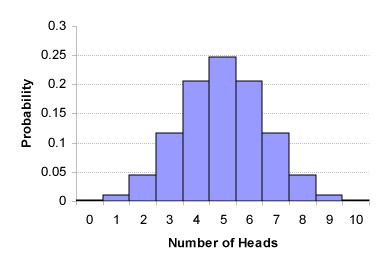
binomial distribution of 10 coin flips.
In this article, I will be far from hard mathematics, but it is important to know that we can use mathematical formulas to assess whether the observed percentage is far from the expected percentage.
At the end of this article I will give you a list of commonly used hypothesis testing formulas for various cases, and afterwards I will explain how to use them. But first, I will explain the interpretation of hypothesis testing.
Hypothesis Test Result: p-value
Behind hypothesis testing there is a mathematical balance between the observed values and the sample size. At the end of the calculations, each existing hypothesis testing option will produce a standardized score that will allow you to compare the result even when the math is not exactly the same.
P-value is a standard way to formulate the result of a hypothesis test and use it in any other tests.
P-value is a number between 0 and 1 that tells us if the difference is between our observations of the samples and our hypotheses are very different. The reference value is 0.05.
The difference is statistically significant if p-value is less than 0.05.
And the difference is not statistically significant if p-value is greater than 0.05.
Example 1:
We made 10 coin flips.
Our hypothesis: we expect 5 tails.
Our observations: we got 6 tails.
The calculation of p-value yielded 0.518, which is more than 0.05.
Our conclusion: the difference is not statistically significant.
Our interpretation: the result is consistent with the hypothesis.
Example 2:
We made 10 coin flips
Our hypothesis: we expect 5 tails.
Our result: we got 10 tails.
Our p-value is 0.0, which is less than 0.05.
Our conclusion: the difference is statistically significant
Our interpretation: the result is not consistent with the hypothesis.
Example 3:
We checked 10 apples.
Our hypothesis: we expect 1 rotten apple.
Our result: we got 1 rotten apples.
Our p-value is 1.0 which is more than 0.05.
Our conclusion: the difference is not statistically significant
Our interpretation: the result is consistent with the hypothesis.
Example 4:
We checked 10 apples.
Our hypothesis: we expect 1 rotten apple.
Our result: we got 5 rotten apples.
Our p-value is 0.0114 which is less than 0.05.
Our conclusion: the difference is statistically significant
Our interpretation: the result is not consistent with the hypothesis.
Conclusion
In this article, I gave an intuitive interpretation of the general structure of statistical errors or hypothesis testing. I hope that now you better understand hypothesis testing and how it can be useful to you.
I did not go deep into mathematical proofs and into specific details. The table below lists the most frequent hypothesis tests that I recommend for further study.
| Test name | Alternative hypothesis |
| Single sample test | The value of the variable is different from the expected value. |
| Test two samples | The meaning of the two groups is different |
| Anova | The value of more than two groups is different |
| Proportional z check | The percentage of success of the variable of the two possible options is different from the expected value |
| Bipartitional z-check | The success rate of a two-outcome variable is different between the two groups |
A list with alternative hypotheses for some hypothesis tests.
I hope this article will be useful to you, and I wish you good luck in further research on hypothesis testing.