I continue to develop my project on visualizing data trends, I added the ability to view in a browser in real time. To whom it is interesting I ask.
Briefly tell what the project is. This is a software system called “SVisual”.
Consists of three parts:
- server "SVMonitor", it is also an online monitor;
- client - a library or sketch for transferring data from MK;
- and viewer archive records.
The system is described in detail in a previous article .
Immediately see the video, what happened:
I focused on viewing from the phone, since it will be more convenient to use a desktop application on a PC.
The page is written on a modern stack (React + Redux, Boostrap design).
On old tablets and phones it won’t work.
Functional diagram of software.
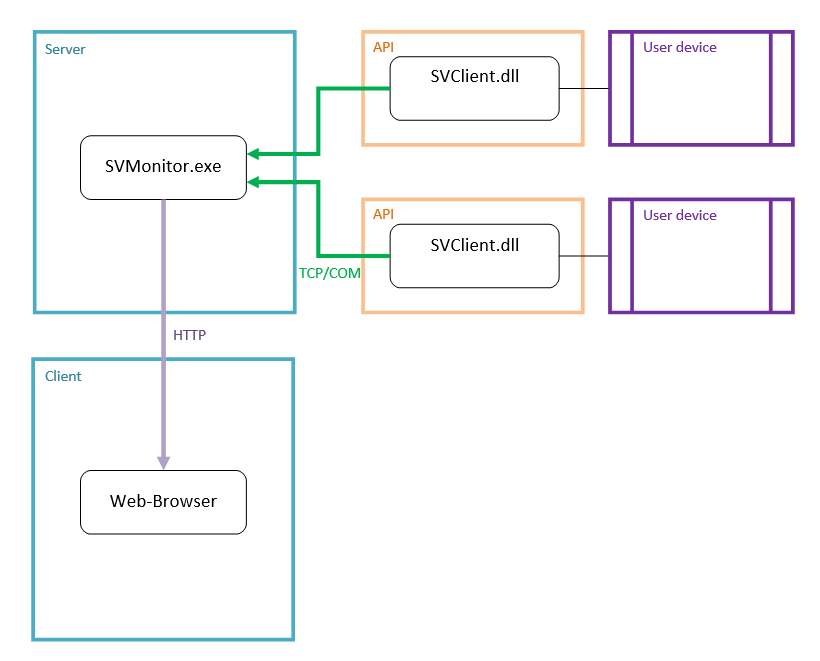
Here:
- MK transfers data via COM-port or Ethernet to the SVMonitor server, it is also an http-server.
- the user in the browser opens the page.
The page is transmitted via http, later I will do https. For now, you can use third-party software for protection, such as stunnel, for example.
I did not show in detail the internal kitchen of the server, since everything is described in the previous article , and in the software manual .
Example usage for Arduino.
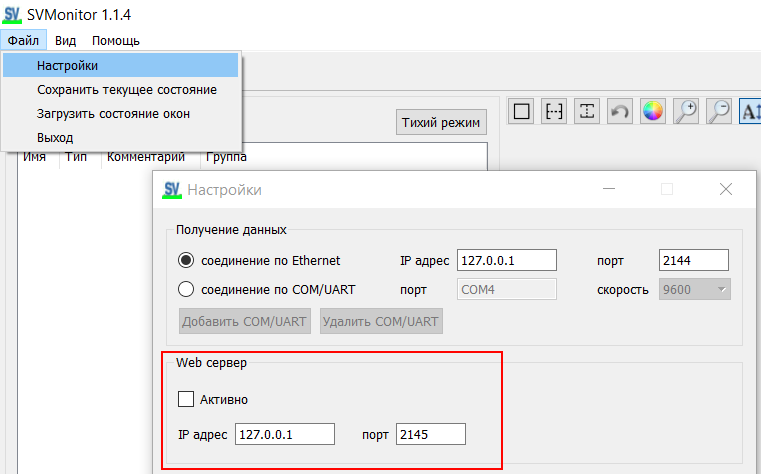
1. Run SVMonitor, and in the settings for the Web server, specify the IP address and port.
2. Fill such a sketch in MK:
#include <SVClient.h> void setup() { bool ok = svisual::connectOfCOM("client"); } int cnt = 0; void loop() { svisual::addIntValue("dfv", cnt); ++cnt; if (cnt > 10) cnt = 0; bool odd_cnt = cnt % 2; svisual::addBoolValue("bFW", odd_cnt ); svisual::addBoolValue("bBW", !odd_cnt ); delay(200); }
3. Next, you need to restart SVMonitor and reconnect the MK.
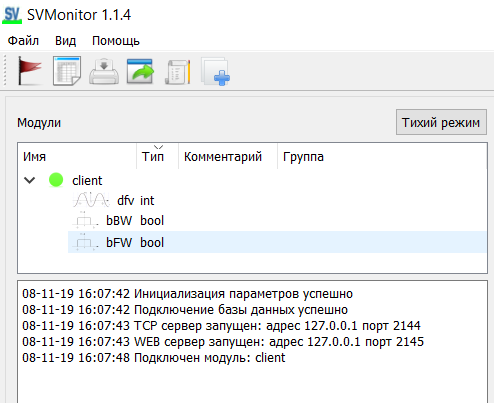
4. Now in SVMonitor we should see the connected MK:
5. Open the browser, enter the address specified in the SVMonitor settings in the address bar and see the following page:
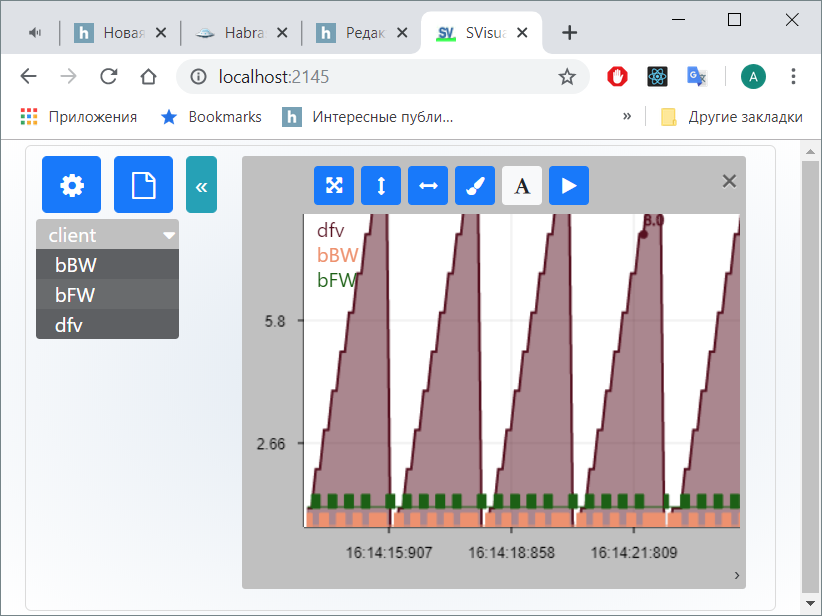
This video shows all the possibilities of working with a graph in a browser
For STM32, the client is here .
That's all in principle.
The software is freely distributed, MIT license.
Thanks.