- I work in the operation and development department of the Yandex network, and sometimes I am forced to solve some problems, instead of drawing beautiful clouds on leaves or inventing a bright future. People come and say that something does not work for them. If this matter is monitored, if our duty engineers see what exactly does not work, then it will be easier for me myself. So these half an hour will be devoted to monitoring.
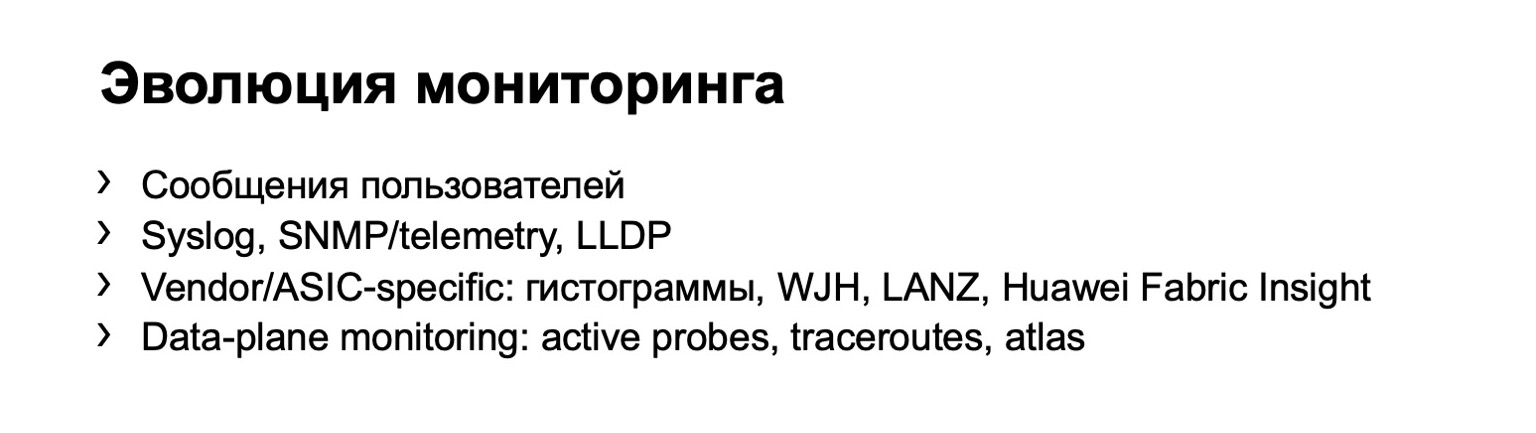
Sooner or later, everyone comes to the idea of monitoring. That is, at first you can collect the appeals of the users themselves, they will knock on you and say that something is not working for them. But it is clear that such a system does not scale well. If you have more than one switch, if you have a sufficiently large network, then with this monitoring option you can not go far.
And sooner or later all come to the conclusion that it is necessary to collect some data from the equipment. This is the very first step. It can be logs, various data on SNMP, drops, you can build topologies according to LLDP, etc. There is a clear minus - the device itself provides all this information to you. It may be underestimating something, deceiving you, etc.
The logical stage in the development of your monitoring is monitoring on hosts. We can say that there is a small branch. If you are lucky - or not lucky - to have a network on one vendor, then the vendor can offer you one of your own monitoring options. But last year at Next Hop, Dima Ershov said that our factory was created from two basic vendors and we cannot afford such a luxury. Or we can, but only partially.
Finally, the last option, which everyone somehow reaches with the development of the network. This is monitoring on end hosts. Yandex has such monitoring. It is called Netmon.
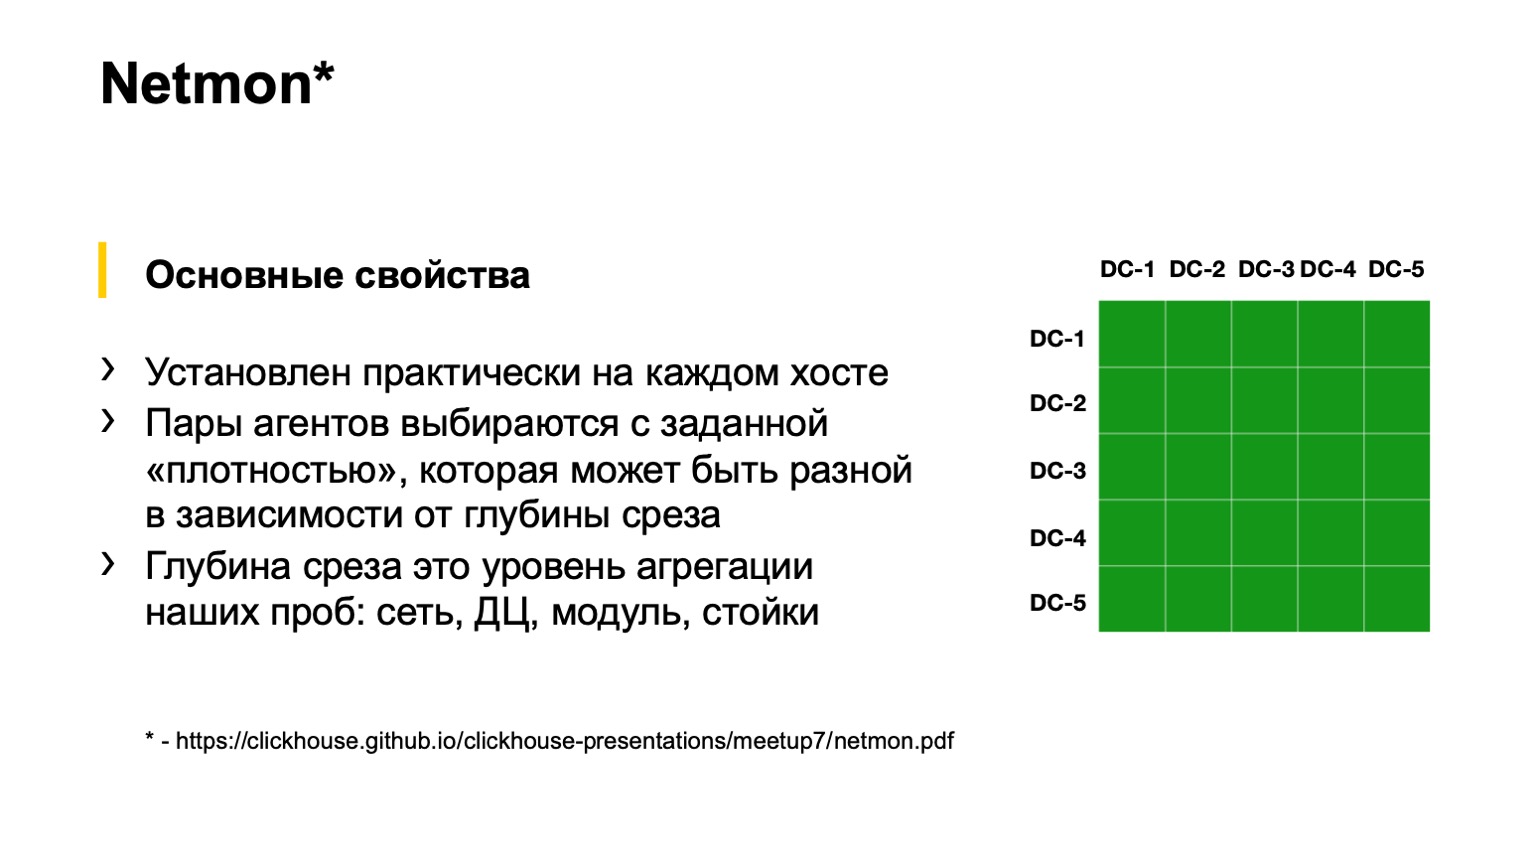
At the bottom of the slide there is a link with a detailed presentation on how Netmon works. I will tell literally within one slide. If anyone wants to, please read the talk from another Netmon conference.
Netmon are agents that are installed on almost every host on the network. The task is sent to the agents: to send some packets to some network node. They can be completely different: UDP, TCP, ICMP. It can be both different paints, that is, DSCP, and destination. Source and destination ports can also be different.
This data is aggregated, uploaded to a separate storage, and we get here a slice like the one on the right in the figure. A slice can be more aggregated or less aggregated, depending on what we want to see. For example, here, as far as I see, we have a slice of all data-center connectivity, that is, between all our data-centers. We can fall deeper into the squares - see the connectivity between the POD or inside the building of one data center; even deeper - inside the POD between the racks; and even deeper - even within the rack.
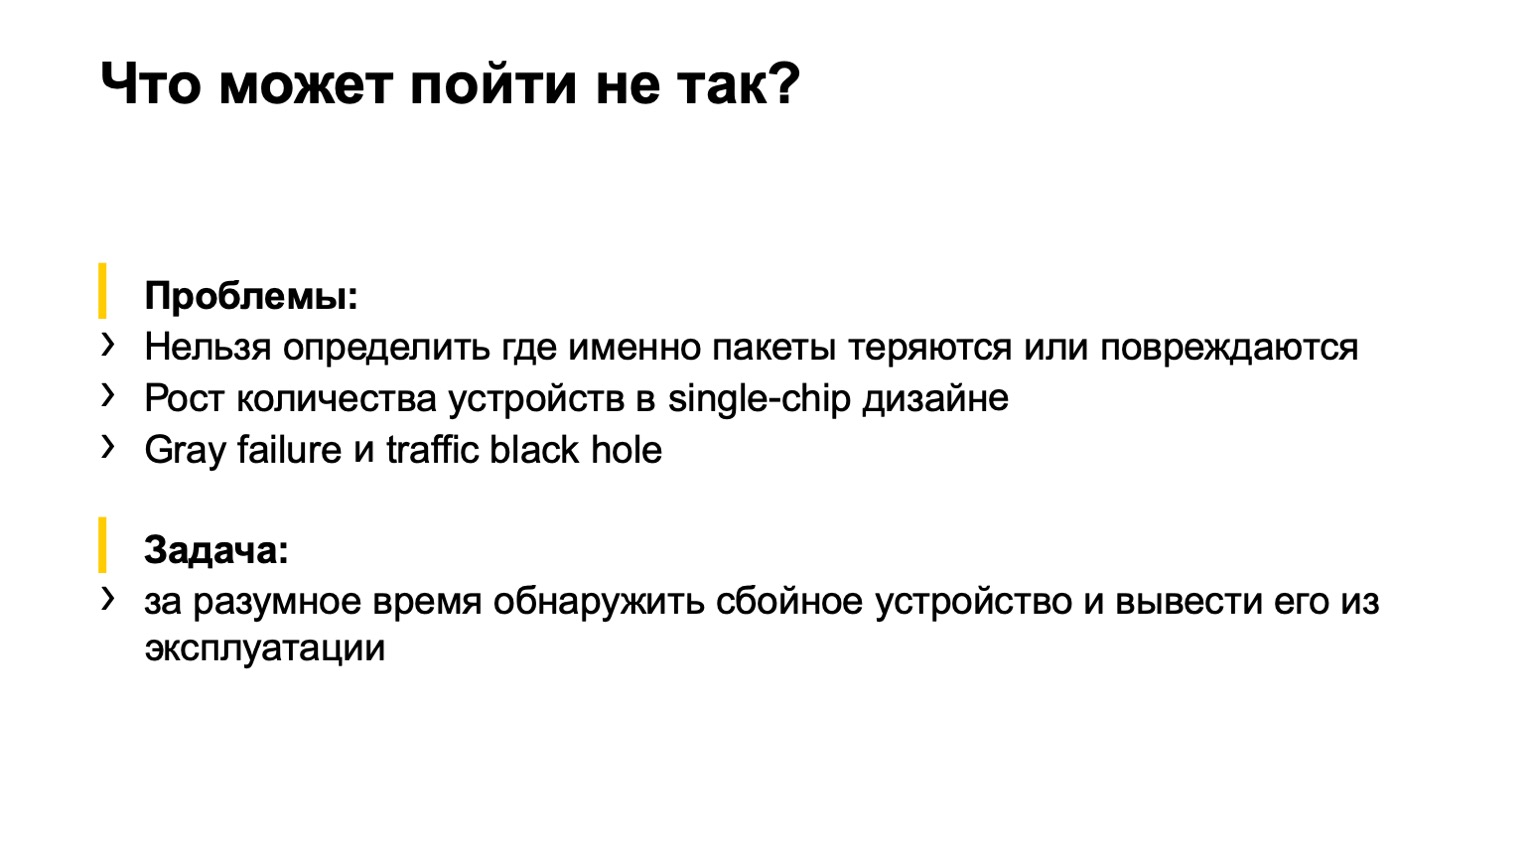
What could possibly go wrong here? A small digression for those who did not watch last year's Next Hop.
We used 400 gigabits per ToR, and at the first moment of implementation of this factory we included only 200, because there were more important tasks. No matter why. They turned on 200, services came and said: why 200? We want 400! Started to turn it on. And so it happened that the second part of the factory, which we included, had some kind of marriage in the memory of cards. As a result, we turn on the factory and see this picture:

This Netmon, the red squares, is on fire. We understand that everything is lost. We grab hold of our heads like Homer and try to push something frantically. And what to press, what to turn off, we do not understand. That is, Netmon shows us the presence of a problem, but does not show where, in fact, the problem is located on the network.

We have come to the task that we need to complete. What should be done? Determine with which device in the network there is a problem and take it out of service - either automatically, or by forces, for example, on-duty engineers.
Moreover, the initial conditions are such that we have a fairly regular topology, that is, there are no strange links between second-level spins or between tori. We have most of the traffic - TCP, there is a central place, we have already talked about it, and the servers are more or less centrally administered. We can come to this central place and reasonably declare: guys, we want to do so, please do so.
What options have we considered?

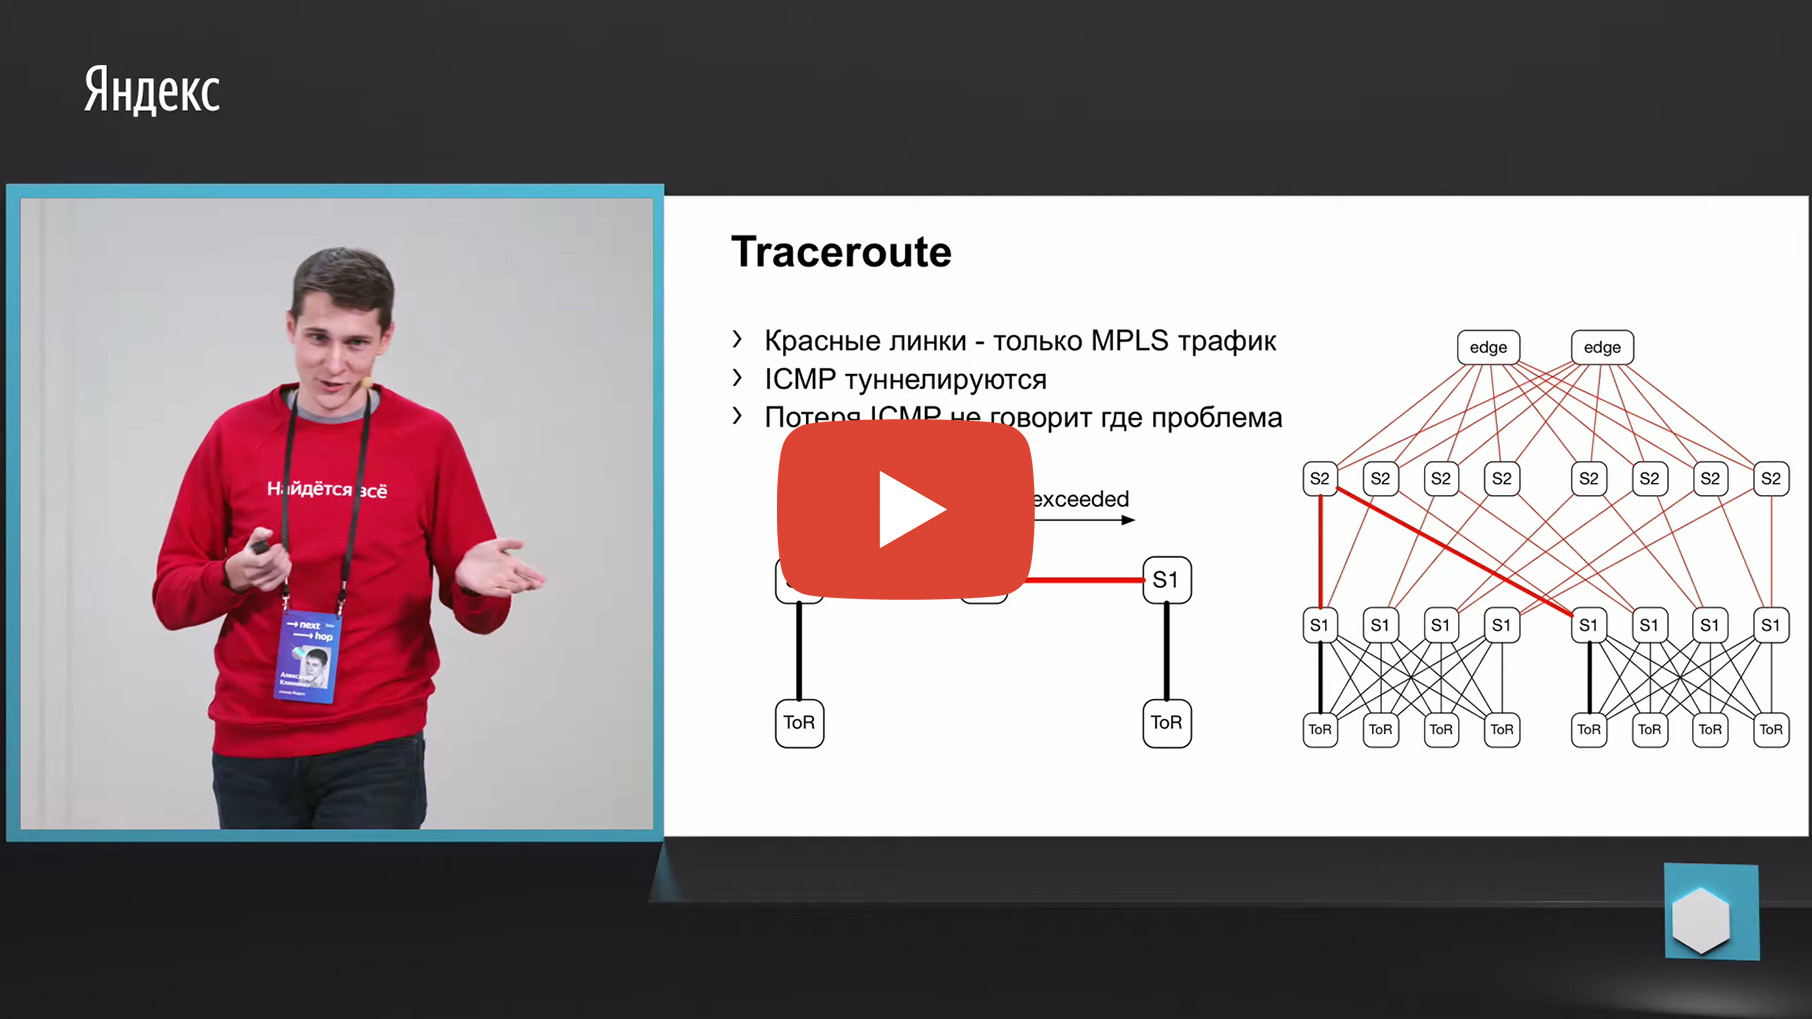
The first thing that comes to mind is tracing. Why? Because the same Netmon unloads the failed source and destination pairs into a separate collector. Accordingly, we can take this 5-tuple, look at it and make a trace with the same parameters. And to aggregate data about which link or through which devices the greatest number of traces passes through.
But unfortunately, MPLS is used in our factory (now we are moving in the opposite direction from MPLS, but we also need to monitor the old factories somehow, but do not throw them away, actually). We have MPLS in the factory, and the problem with MPLS and tracing is that it needs to tunnel the TTL exceeded ICMP message, which underlies the tracing. Having lost such a message from ingress to egress, we can lose the very monitoring. That is, we will not understand through which nodes this message passed. This did not suit us for monitoring.
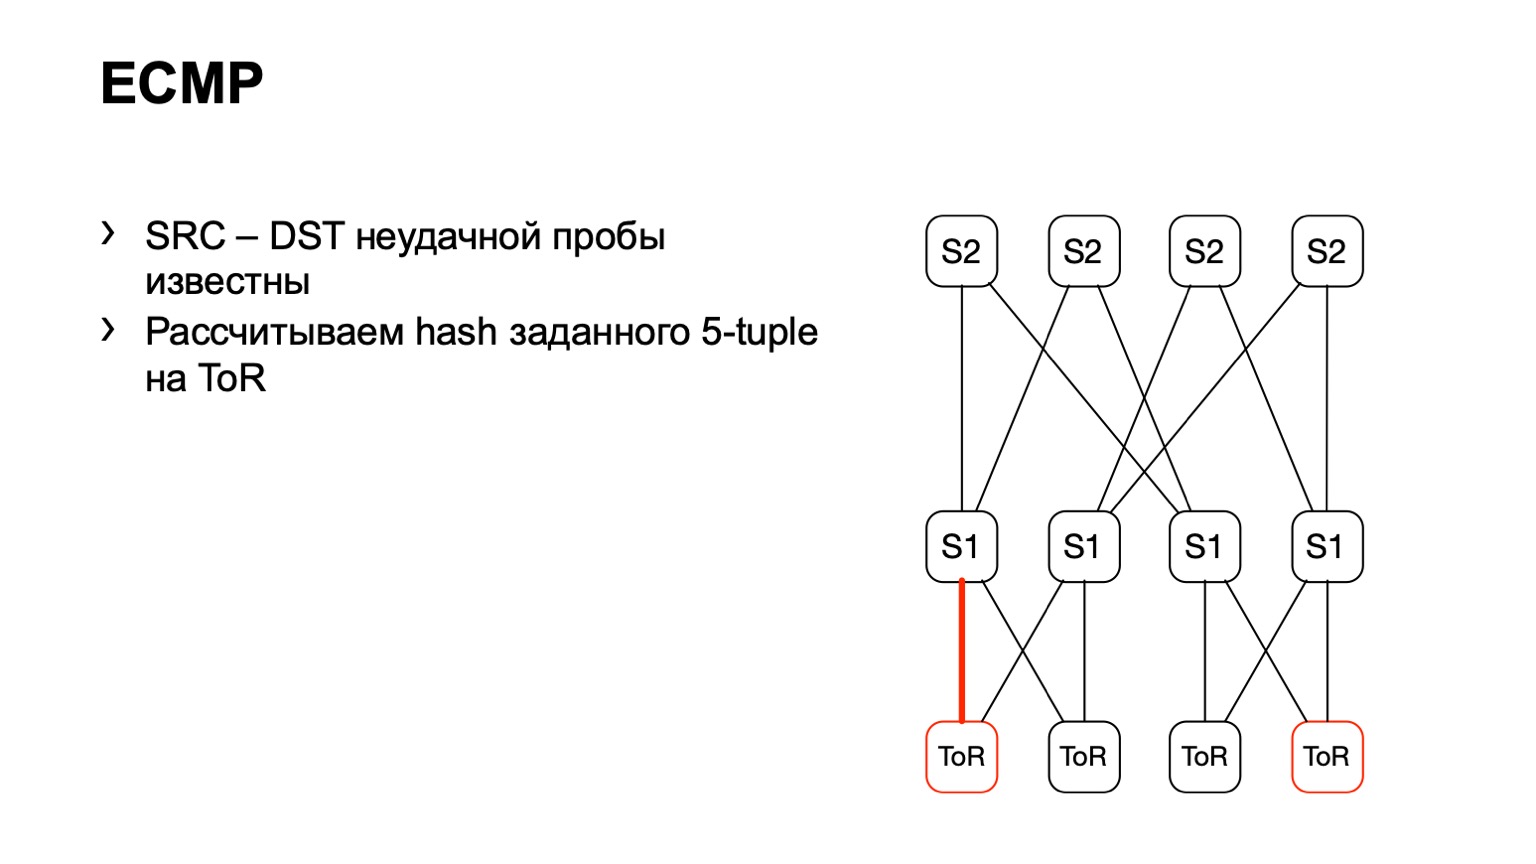
There is a second option related to ECMP. We take the same source and destination pair, in addition source-port destination-port. We come to one piece of iron, through the API or through the CLI we feed this piece of iron to the piece of iron, and we get the output interface. Many devices support this kind of output.
We come to ToR, see that ToR has chosen the left or right link. In this case, the left link is towards the left S1.
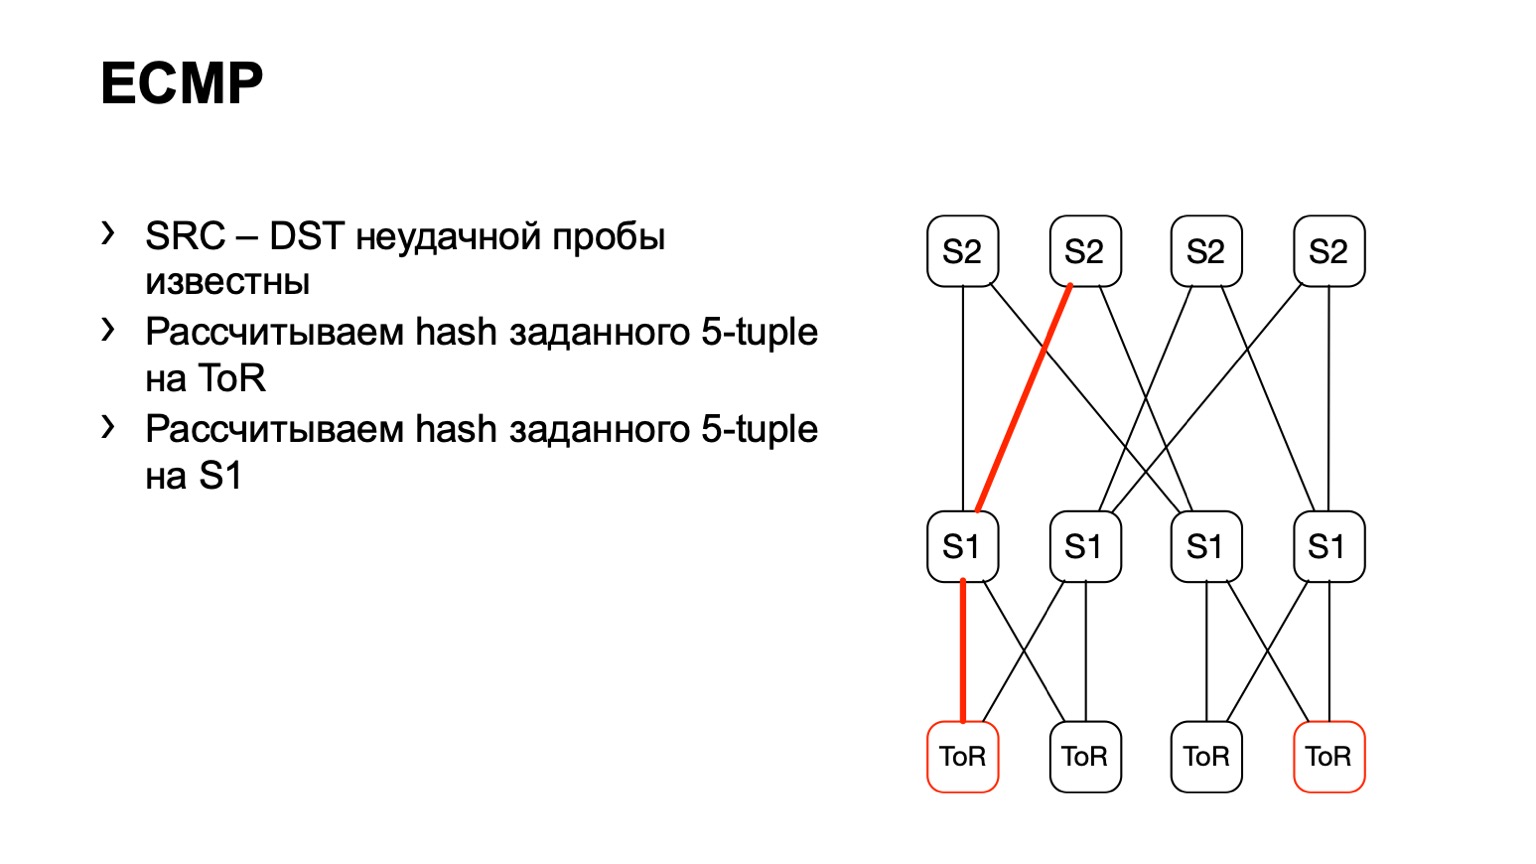
We came to this S1, looked, the right S2, and thus the road was ready.
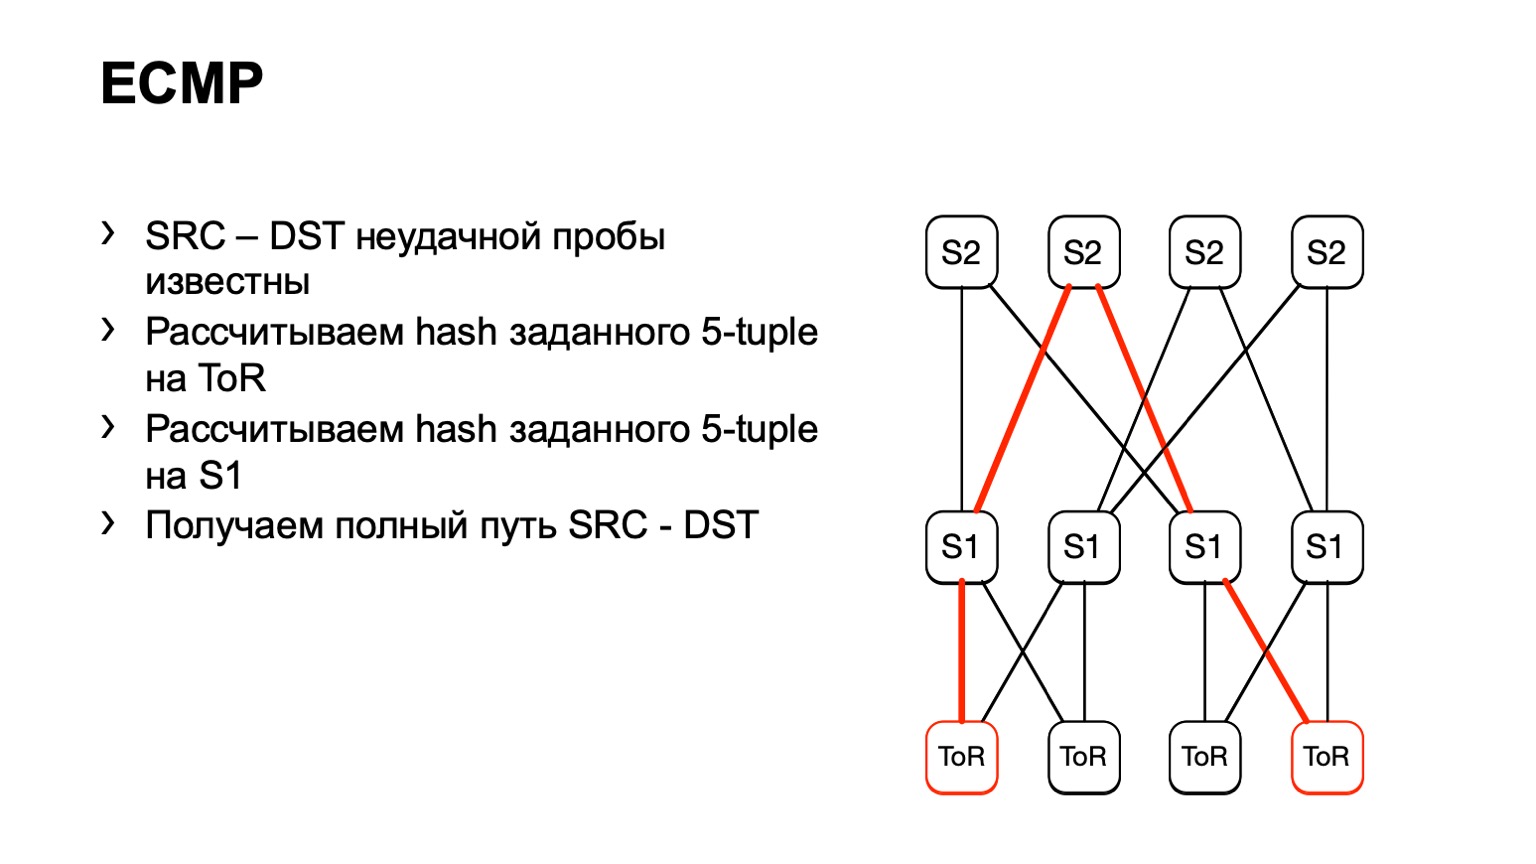
There are some disadvantages. Firstly, not all devices can normally accept these input data that we give them. This is due to the fact that we have IPv6 and MPLS, as well as the fact that some vendors simply did not implement this. The second minus of this solution: we rely on what the piece of iron will tell us again, instead of looking at what is happening on the hosts. And finally, the third minus - for the time while you go and see what happens there, something can already change on the network, and your data will not be relevant.
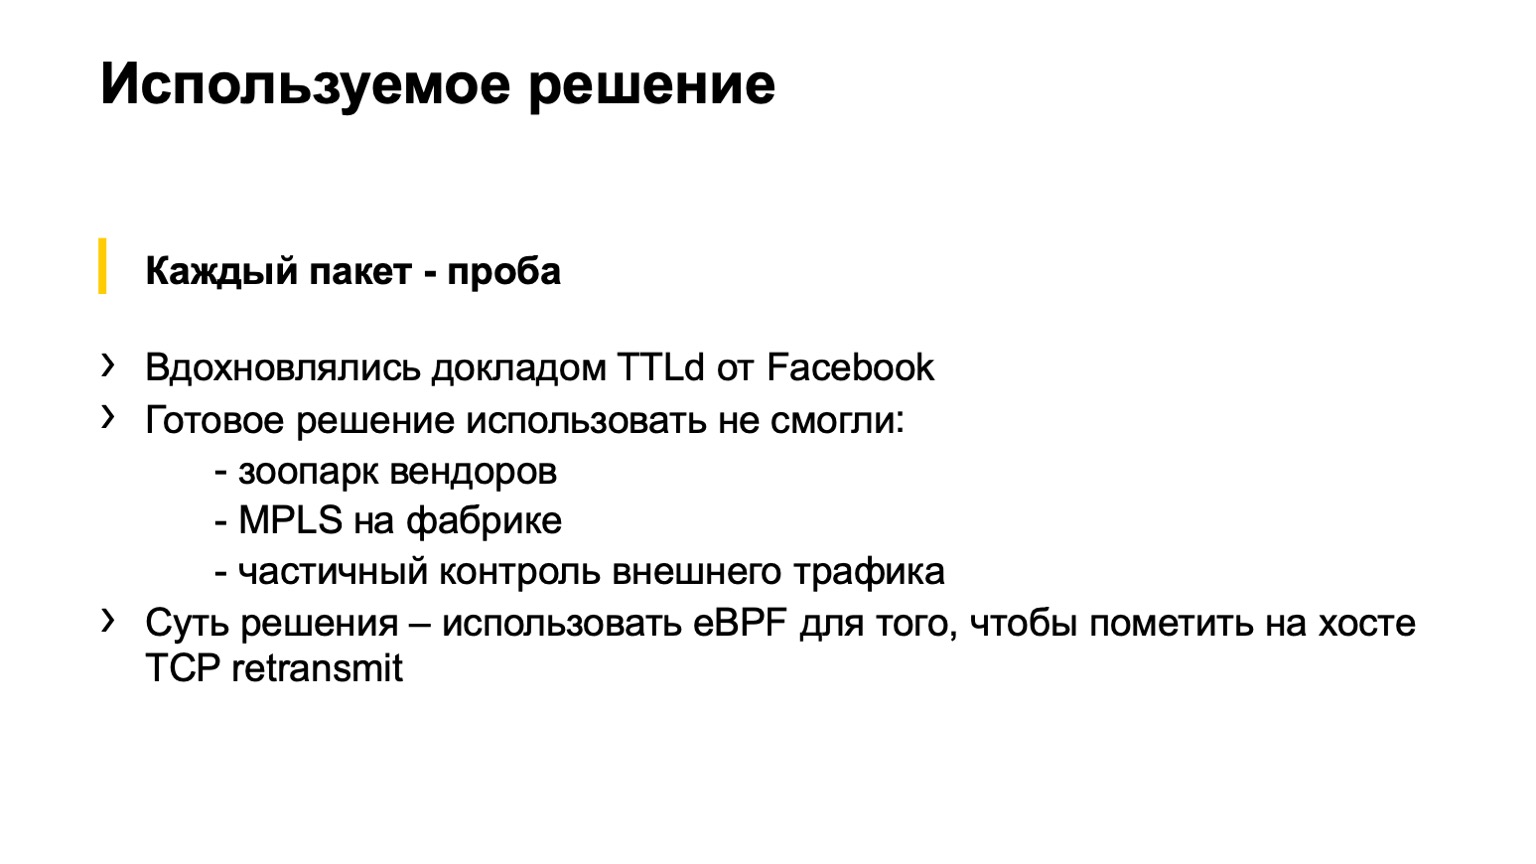
Then we came across an interesting presentation made by Facebook. We liked the idea that Facebook suggested, we decided to try to do something similar.
What was the main idea? Use an eBPF program on the host to color the TCP retransmit and then calculate the number of such packets. Unfortunately, we couldn’t do it like on Facebook, we had to invent our own bike. I will now try to tell you about the path of pain and suffering that we have gone through.
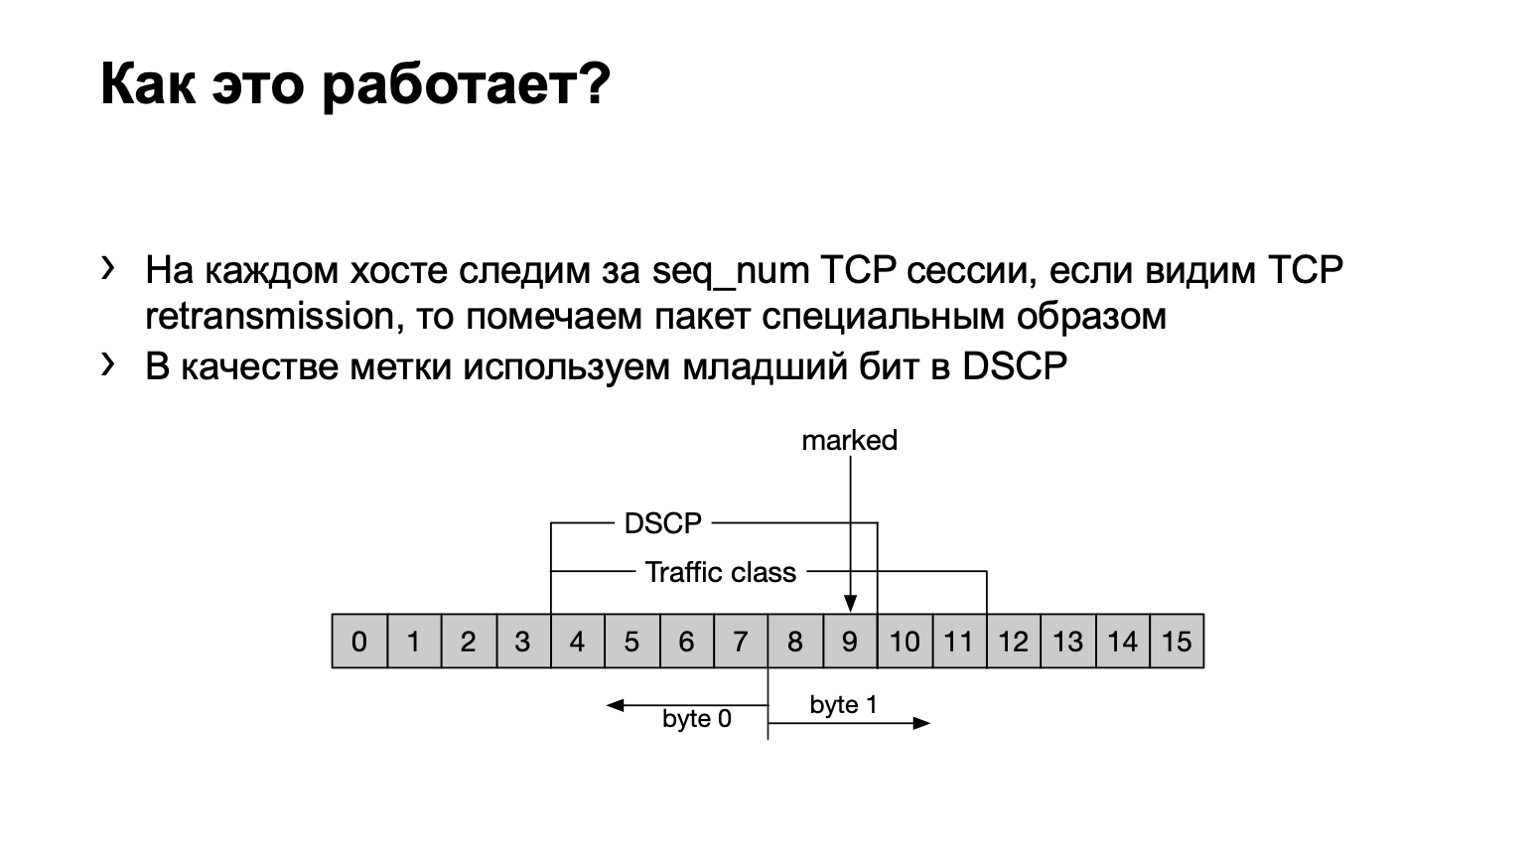
What have we done? Just in case, I’ll point out that TCP retransmit are TCP messages that are repeated several times due to the fact that they were not confirmed. We have an eBPF program installed on the host and looks at whether this TCP message is retransmit or not retransmit. It does it corny - by sequence number. If the same sequence number is transmitted in a TCP session, then this is retransmit.
What do we do with such packages? We set the last bit in the DSCP field to one to further calculate the whole thing.
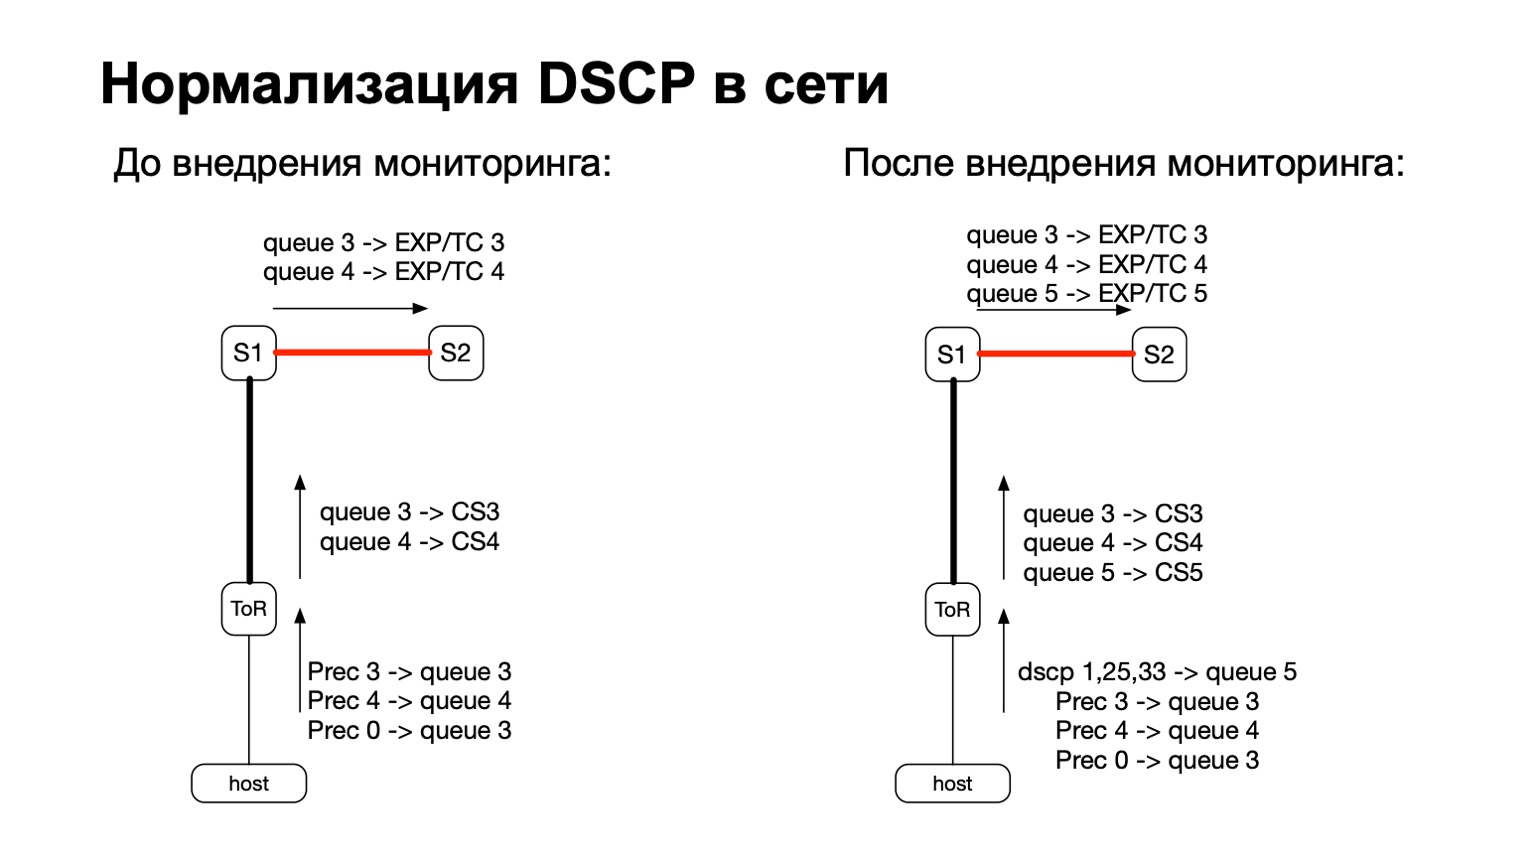
Generally speaking, DSCP is somehow related to QoS, right? And with QoS, the history in our network is quite complicated and long-standing. We have certain policies that are monitored on ToR switches. To these policies, we just added the need to count more and these colored packets.
Thus, for colored packets (read: for TCP retransmit packets from the host), we simply added another QoS queue. This was easy enough to do, because we still had free lines. Plus, this is convenient, because at the stage of transition between IPv6 and MPLS in the factory, that is, at the stage when the packet flies through S1 and leaves to our MPLS part of the factory, it is convenient to take and repaint EXP / TC in the MPLS packet header for each specific queue .
What do we do with this data? We collect them with standard ACL filters, traffic class. That is, it works, in principle, on any vendor. We can collect and count the number of such packages everywhere.
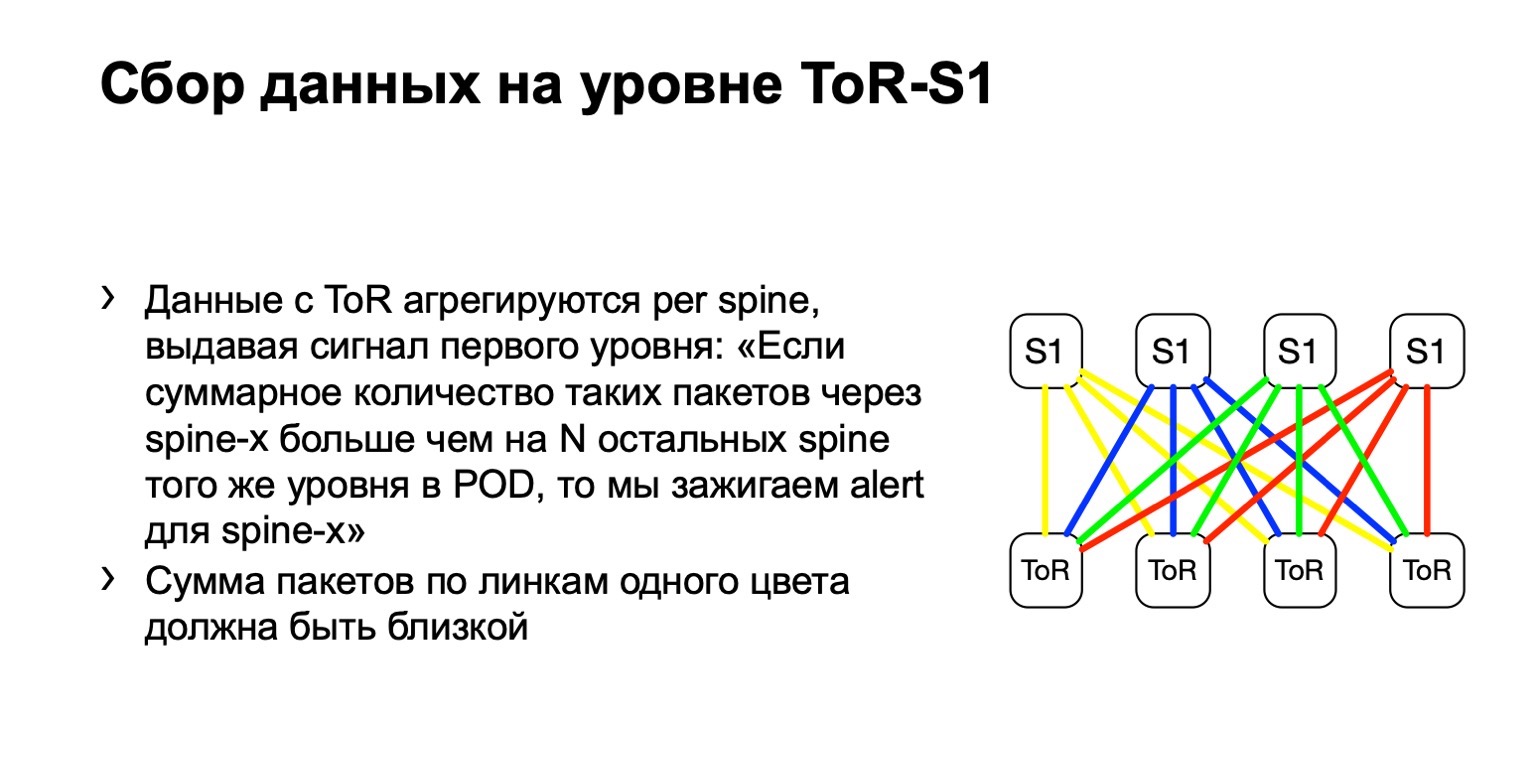
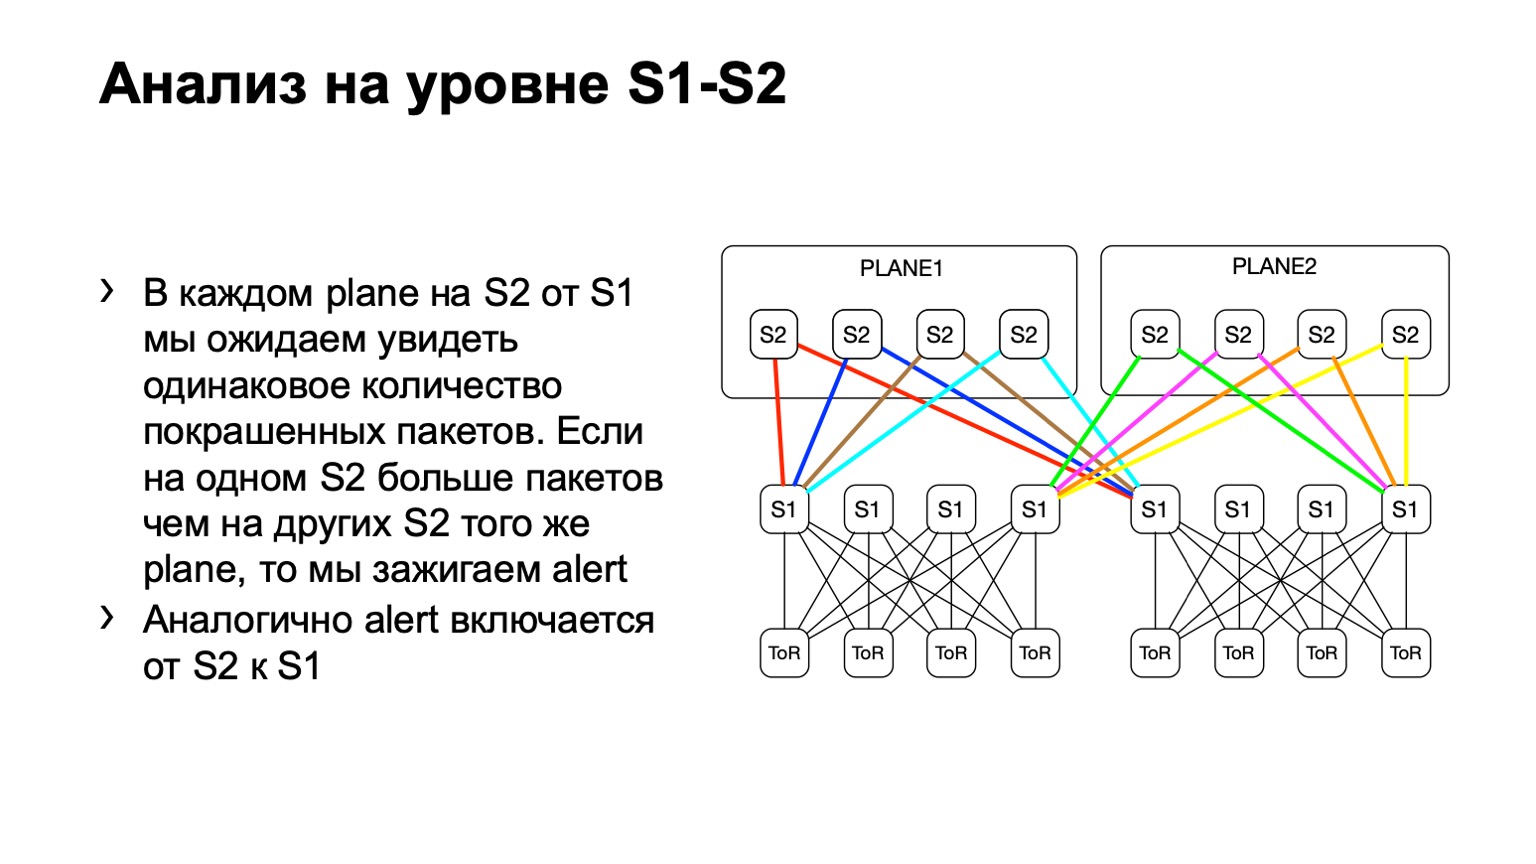
Next, we look at the uneven distribution of such packets on the POD. In it, for example, four spine, as in the picture. If the number of packets on the yellow links, on the blue, on the green and on the red is the same, then we believe that everything is more or less good. If at some point in time we see an increase, say, on the very rightmost spine of the first level, we understand that this device attracts retransmit, something is wrong with it. Then we try either to decommission it, or at least to lease it. At least when we see problems on Netmon, we will know with which device they might arise.
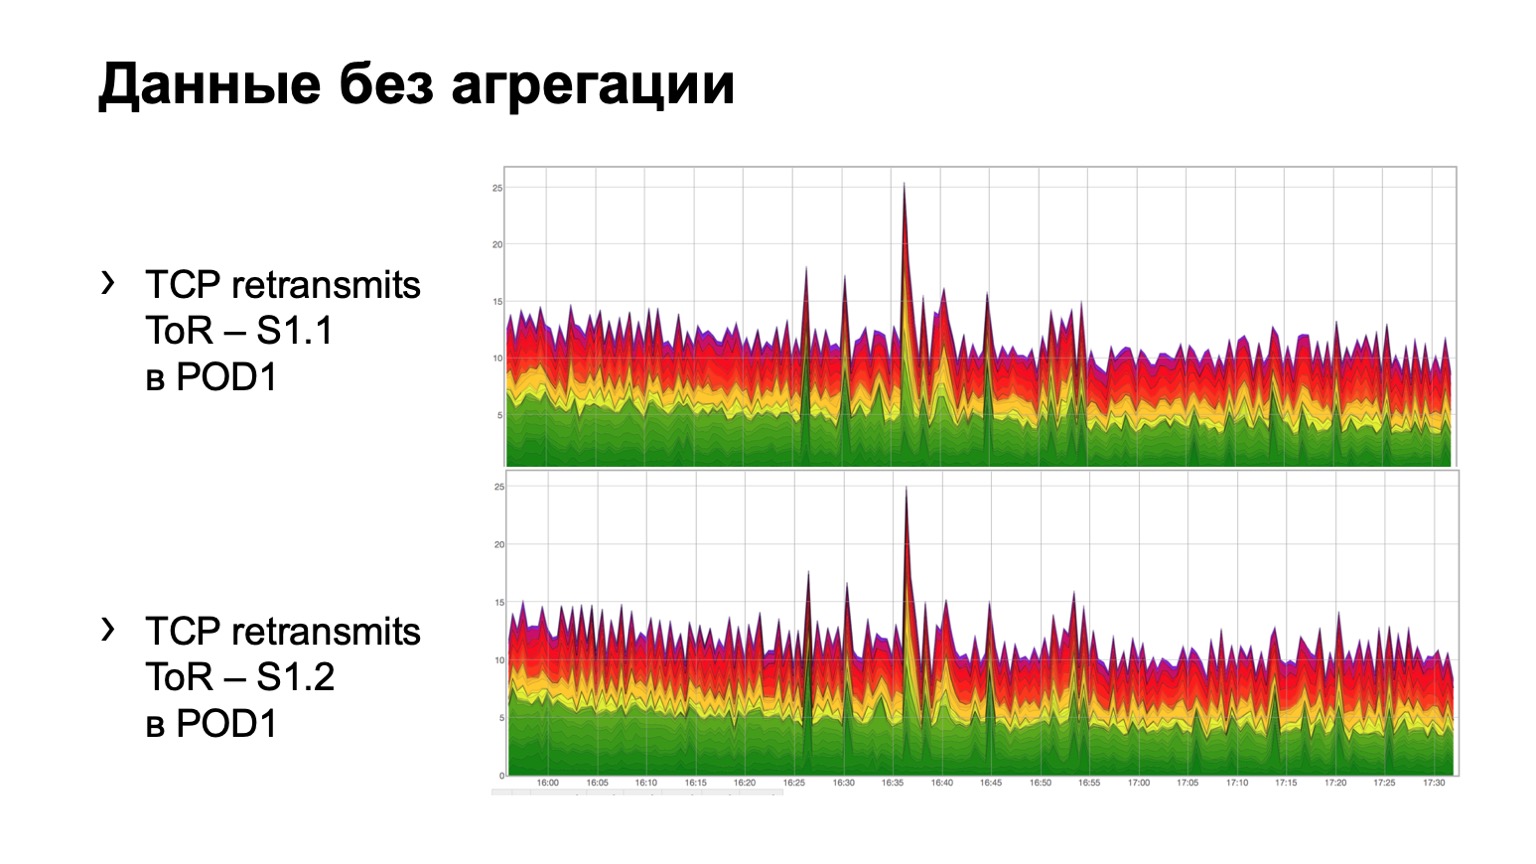
How does it look on simple raw data? Here are two graphs. In fact, these are retransmits charts with ToR towards the first level spine. In the example, two spine in the module. The upper graph is the aggregation of the first spine, the lower graph is the second spine. Watching this in this form is not very convenient, so we have added aggregation of this information.
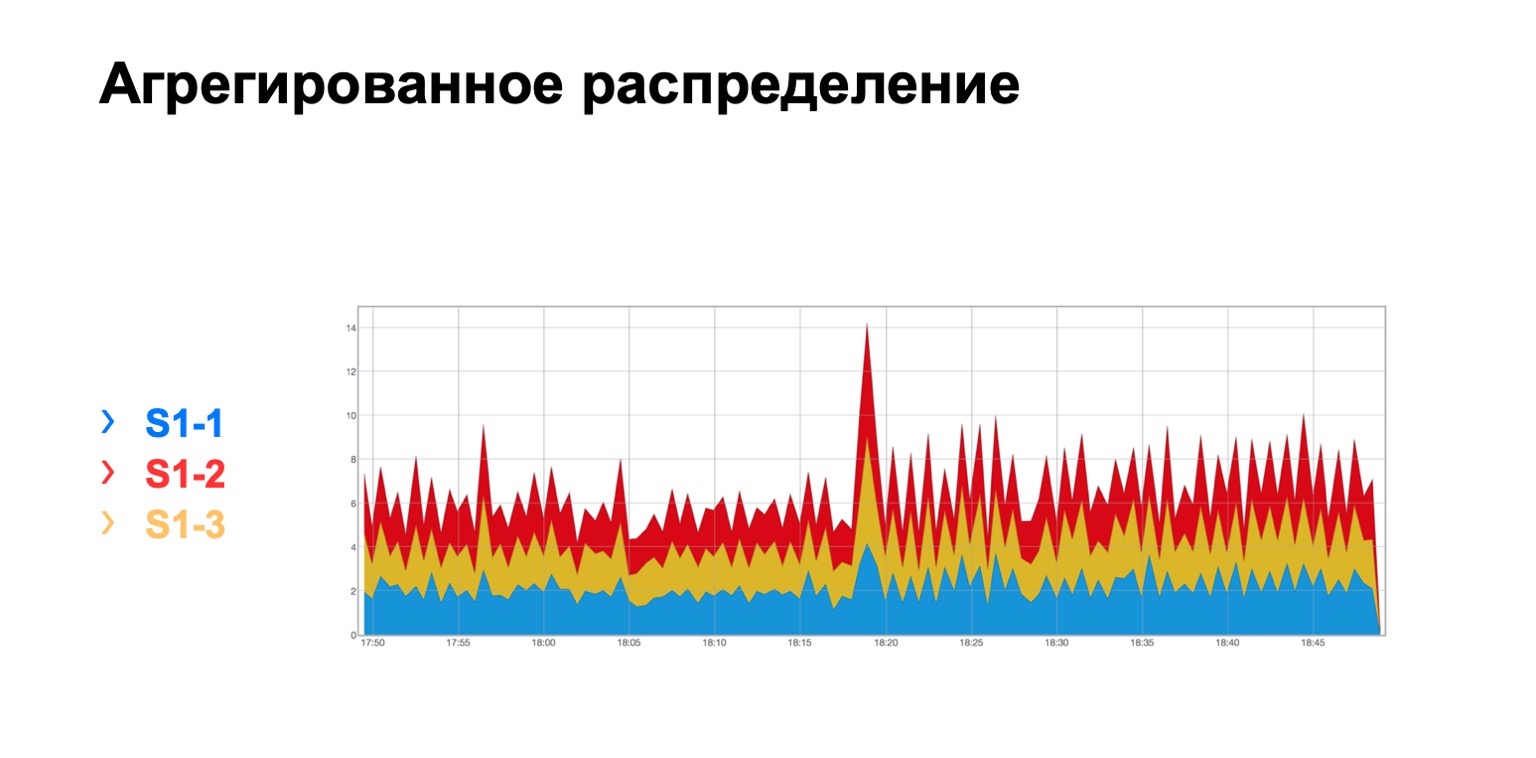
It looks like this. There is a module in which three spines, for some reason, does not matter which one, and we see here such a total distribution of retransmits to three spines. It is, in principle, fairly uniform.
For spine of the second level, we can have various deviations, let's call them that. The topology still remains regular, but depending on the data center, we may or may not use a plate-like architecture. The point here is exactly the same. At one level, we should have approximately the same distribution of colored packages.
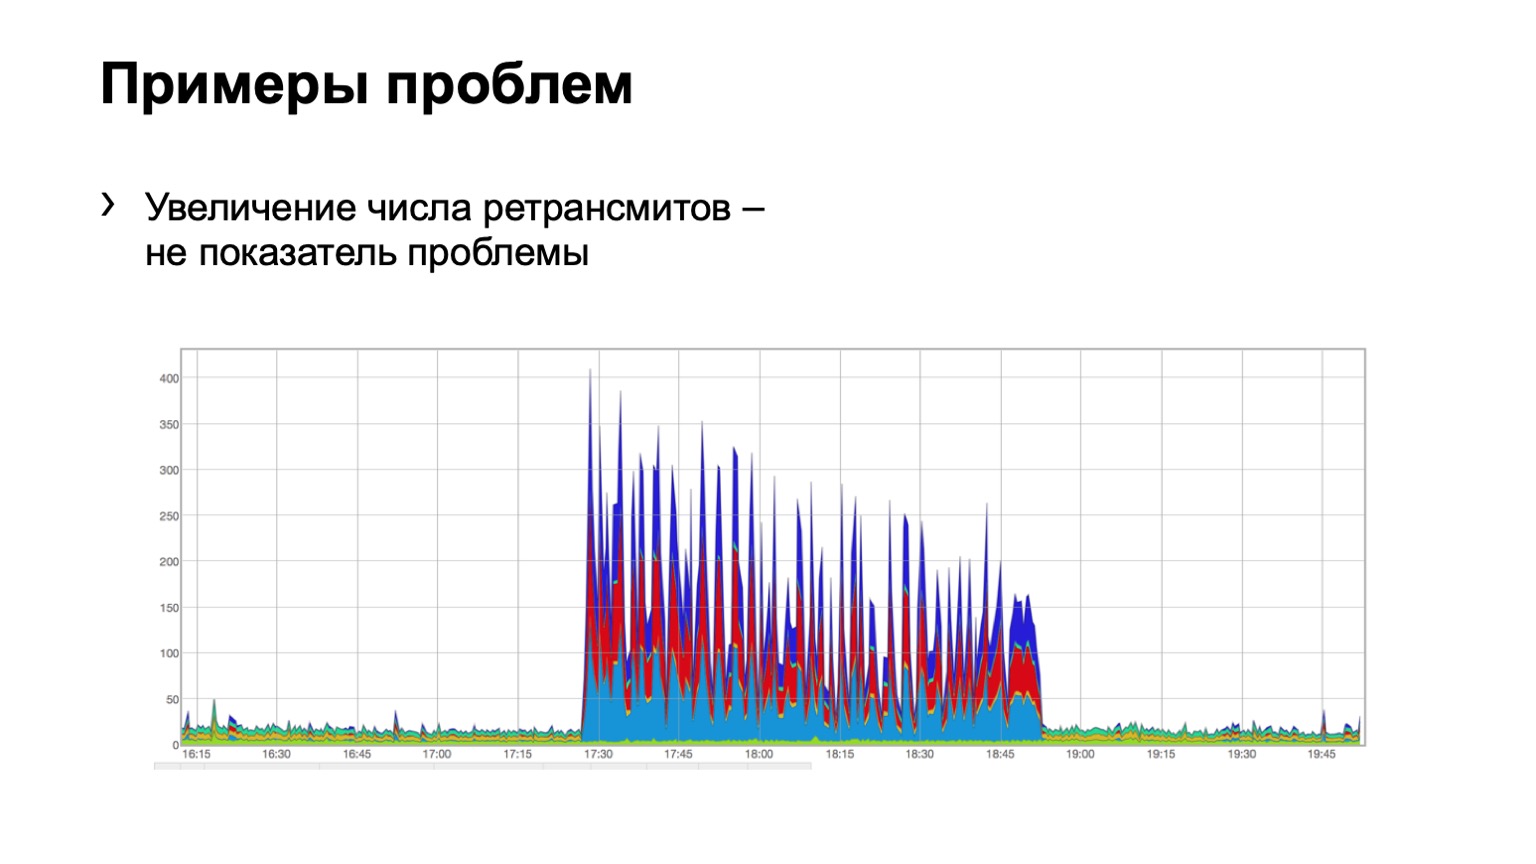
Let's look at examples. Does anyone see a problem on such a chart? There is a problem here, but it is not there at the same time. Yes, this is Schrödinger's problem. Why is she there and not? Because we see an increase in the number of retransmits, it is directly obvious that something happened for us. But at the same time, we see that this growth is quite uniform. That is, three spine blues, reds, blues, even distribution over them. What does this mean? That there was some kind of problem on the network, but it is not related to this level of data aggregation. She is somewhere else.
Maybe someone closed the port on firewalls, disconnected some cluster, that is, something happened. But we are not at all interested in what was there and why. That is, we do not even consider such a problem.
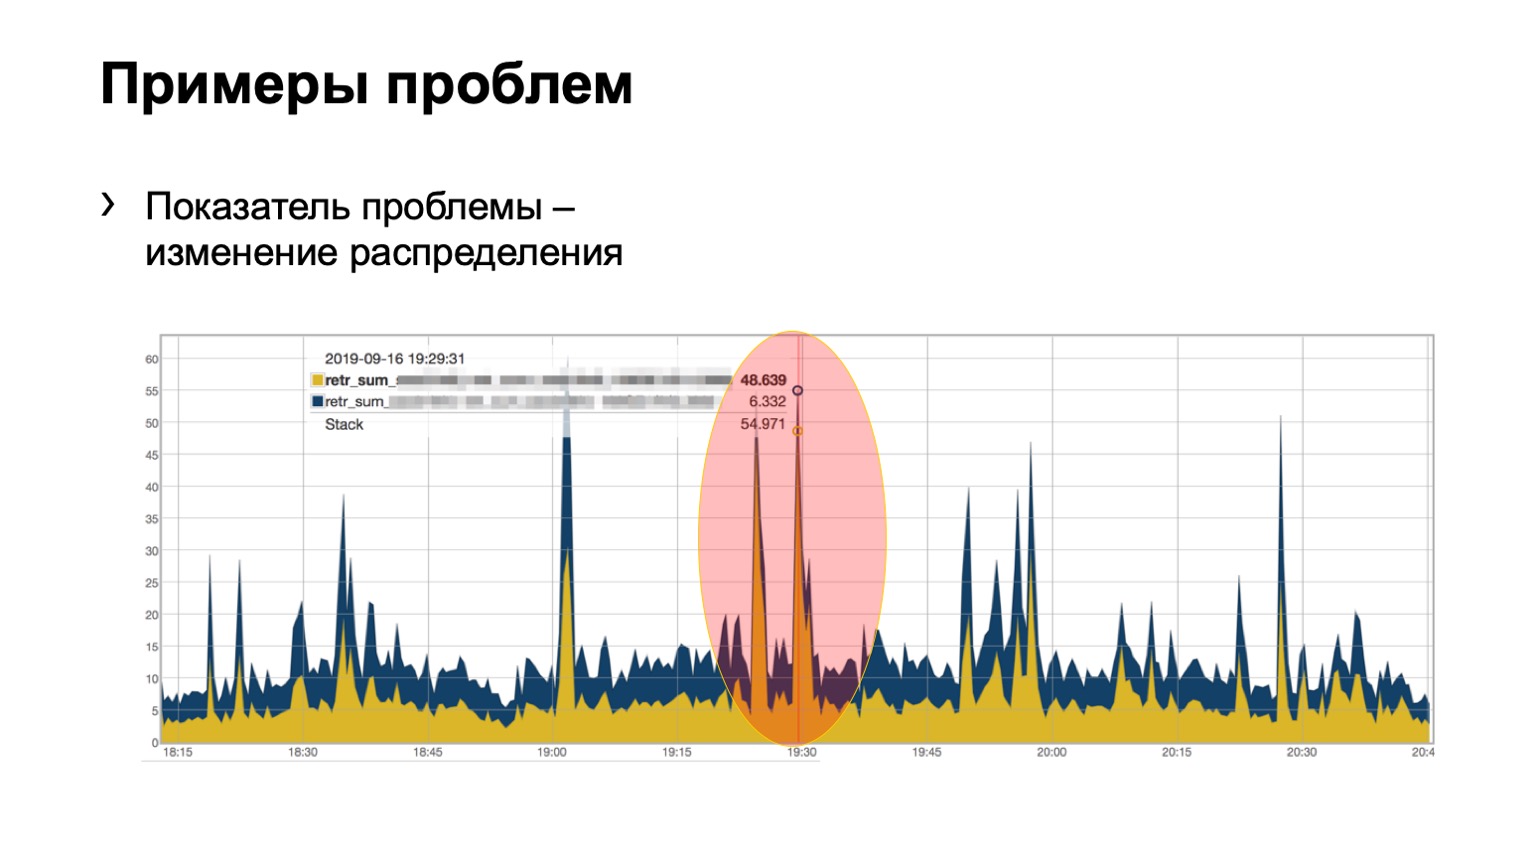
But here, perhaps, not so clearly, but the problem is visible. Two spines in the module, 46 colored packets flew in on one, and just a little bit on the second. We understand that we have a problem with some kind of spine on the network, we have to do something about it.
Why did I first talk about the path of pain and suffering? Because there are a lot of problems with such a solution. The main problem is, of course, the problem of any monitoring, this is false positive. False positive was quite a lot. Mainly due to the fact that we use DSCP and are generally tied to QoS.

We found that other people's packages fly in our paint and alert us to our monitoring. That is, we think that this is a retransmit, and someone else puts their packages there and, in general, spoils the picture for us. Naturally, we began to understand, found a lot of places where we thought it worked, but it actually does not work the way we think. For example, the traffic entering the network should seemingly be repainted, the traffic with the class CS6 and CS7 on the boarders should not get into our network. But in some places there were, say, flaws, and we successfully treated them.
Some manufacturers presented surprises in the form that you count counters in the outgoing direction of such packets, and the chip works in such a way that, in fact, for processing the outgoing access list it wraps traffic through itself again, biting off half of the chip bandwidth . It was 900 gigabits per chip, it became half as much.
And we made some improvement due to the fact that the settings on the host can be different. That is, some host may send retransmits more often, some host may be less likely, some two, some five, and all this alert our monitoring, all this is false positive.
First, we abandoned the idea of painting every TCP retransmit. We realized that, in principle, we do not need every retransmit in order to understand where the problem is. We began to paint only SYN-retransmit. SYN is the first packet in the session, this is enough for us to receive a signal. We paint SYN-ACL too.
All the same, it gave some false positive. We went a little further. We began to paint only the first TCP SYN-retransmit in the session. That is, there are actually several of them sent, we painted each, - only one began to be painted. So we have come to what we have now.
In total, there are Netmon, there are agents on the hosts that color the first SYN-retransmit in the session, and we count these retransmits on every device, on almost every link in our network.

But looking with your eyes at the picture that I used to show was not very convenient. That is, you can’t sell it to a duty officer, because in each section you have to evaluate it all with your eyes. And we came to the fact that I want to have an alert. I want a light to come on: a device such and such is a problem; another device is a problem.
Let's recall some mathematical statistics. The idea with alert is that each device is essentially a basket. We have a probability of success and a probability of failure for four devices. The probability of retransmit getting into the basket, that is success, is ¼. It turns out a binomial distribution.
What is the difficulty of making an alert here? The fact that we cannot make thresholds static, we cannot say: if ten retransmits arrive on one device and nine on another, then there is no problem. And if ten and five, then there is a problem. Because if we scale it to a thousand PPS, then such data will no longer be relevant. 1000 PPS and 800 PPS between different devices is definitely a problem.
We cannot set static thresholds in PPS or bytes, we cannot set them as a percentage - the same problem with them. Therefore, we need a solution that makes this threshold more or less dynamic, depending on the number of packets.
And the charm of the binomial distribution is that at the PPS increase it tends to normal, and for a normal distribution we can already calculate the expectation, variance and calculate the confidence interval, which we did. The confidence interval for us is 3NPQ, that is, it depends on the number of packets through the device. As a result, we have a dynamic shifting threshold.
This is how our signal looks in the picture. If some device is knocked out of the distribution, then we raise a flag on it - something is wrong with it.
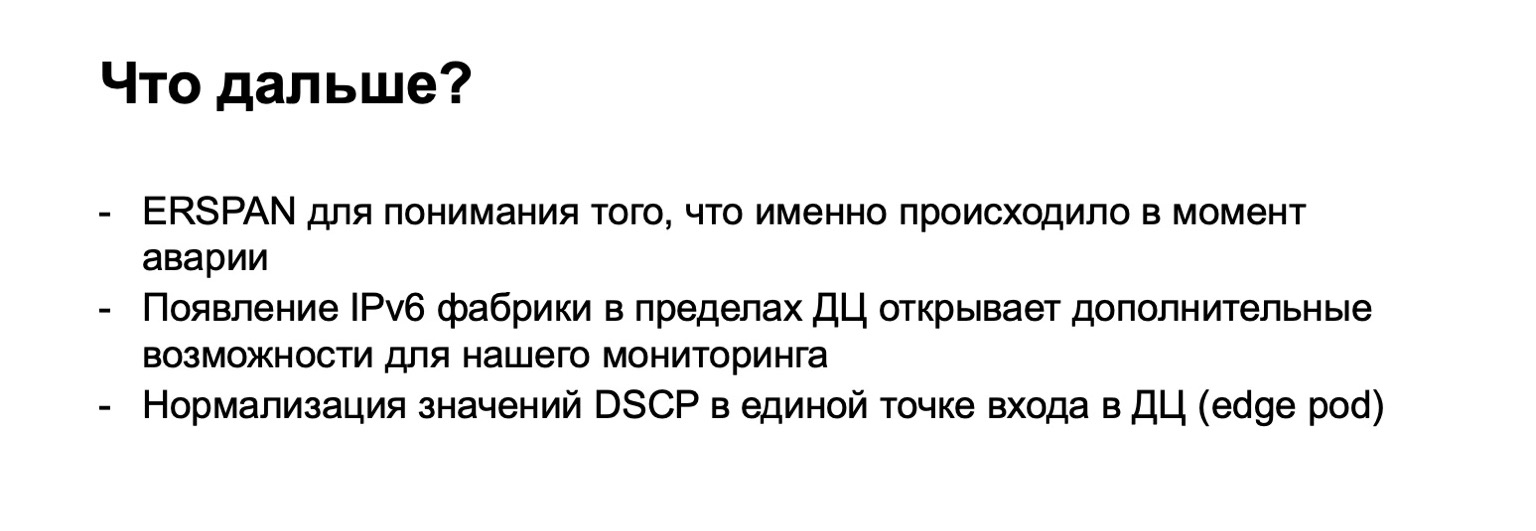
Where do we want to develop further, what do we want to improve here, in addition to, of course, the fight against false positive? First of all, we would be interested to see what was there at the time of the problem? To do this, we have such an option in the agent - Debug. We can upload exactly what was retransmitted, that is, a 5-tuple packet, for example, into a separate collector, and then look at it. But this gives some load on the hosts, so we are sometimes forbidden to do so. We want to fasten ERSPAN and unload such packages onto the collector from the hardware itself, because no one forbids us to do this on the hardware.
Dima Afanasyev told how we will develop our factories, and one of the points was the transition from the MPLS factory to IPv6 only. What does this give us? MPLS has three bits for QoS marking. In IPv6, at least six. Only three bits are actually used in our network right now. That is, we still have three more bits in which we can put, in fact, any information from the host.
For example, now we are painting only the first SYN-retransmit in the session. And we can color the second bit, for example, if the packet goes to an external network. And we can retransmit, that is, highlight another signal, which we will then consider separately.
In addition, the transition to the design with edge pod, when we have the DCI done in some particular place, threatens us with the fact that in this place we can more precisely control our diffserv domain. That is, repainting and doing something with paints to cut off false positive.
As a result, doing all of the above turned out to be rather painful, but interesting. There was nothing to worry about. We, in fact, have developed a solution that everyone can use. It is tested on virtually every vendor, it works, it’s not difficult. And it really shows which device on the network there is a problem. Therefore, my message is - do not be afraid to do the same, and let your monitoring remain green. Thanks for listening.