
Hello! My name is Askhat Nuryev, I am a leading automation engineer at DINS.
I have been working at Dino Systems for the past 7 years. During this time, I had to deal with various tasks: from writing automated functional tests to testing performance and high availability. Gradually, I became more involved in organizing testing and optimizing processes in general.
In this article I will tell:
- What if bugs have already leaked to production?
- How to compete for the quality of the system, if you can’t count the errors with your hands and do not reconsider your eyes?
- What are the pitfalls in automatic error handling?
- What bonuses can I get from analyzing query statistics?
DINS is the development center of RingCentral, a market leader among Unified Communications cloud providers. Ringentral provides everything for business communications from classic telephony, SMS, meetings to the functionality of contact centers and products for complex teamwork (a la Slack). This cloud solution is located in its own data centers, and the client only needs to subscribe to the site.
The system, in the development of which we participate, serves 2 million active users and processes more than 275 million requests per day. The team I'm working on is developing the API.
The system has a rather complicated API. With it, you can send SMS, make calls, collect video conferences, set up accounts, and even send faxes (hello, 2019). In a simplified form, the scheme of interaction of services looks something like this. I am not kidding.

It is clear that such a complex and highly loaded system creates a large number of errors. For example, a year ago we received tens of thousands of errors per week. These are thousandths of a percent relative to the total number of requests, but still so many errors are a mess. We caught them thanks to the developed support service, however, these errors affect users. Moreover, the system is constantly evolving, the number of customers is growing. And the number of mistakes, too.
First, we tried to solve the problem in a classical way.
We gathered, requested logs from production, fixed something, forgot something, created dashboards in Kibana and Sumologic. But overall it did not help. Bugs leaked anyway, users complained. It became clear that something was going wrong.
Automation
Of course, we began to understand and saw that 90% of the time that is spent on fixing the error is spent on collecting information on it. Here's what exactly:
- Get the missing information from other departments.
- Examine server logs.
- Investigate the behavior of our system.
- Understand whether this or that system behavior is erroneous.
And only the remaining 10% we spent directly on development.
We thought - but what if we make a system that itself finds errors, puts them a priority and shows all the data needed to fix it?
I must say that the very idea of such a service caused some concerns.
Someone said: “If we find all the bugs ourselves, then why do we need QA?”
Others said the opposite: "You will drown in this pile of bugs!".
In a word, it was worth making a service if only to understand which of them is right.
spoiler
(both groups of skeptics were mistaken)
Ready-made solutions
First of all, we decided to see which of the similar systems are already on the market. It turned out that there are a lot of them. You can highlight Raygun, Sentry, Airbrake, there are other services.
But not one of them suited us, and here's why:
- Some services required us to make too large changes to the existing infrastructure, including changes on the server. Airbrake.io would have to refine dozens, hundreds of system components.
- Others collected data about our own mistakes and sent them somewhere to the side. Our security policy does not allow this - user and error data should remain with us.
- Well, they are also quite expensive.
We do our
It became obvious that we should make our service, especially since we had already built a very good infrastructure for it:
- All services have already written logs to a single repository - Elastic. In logs uniform identifiers of requests through all services were thrown.
- Performance statistics were additionally recorded in Hadoop. We worked with logs using Impala and Metabase.
Of all server errors ( according to the classification of HTTP status codes ), 500 code is the most promising in terms of error analysis. In response to errors 502, 503 and 504, in some cases you can simply repeat the request after some time without even showing the answer to the user. And according to the recommendations of the RC Platform API, users should contact support if they receive the status code 500 in response to a call.
The first version of the system collected query execution logs, all the stack traces that arose, user data and put the bug into the tracker, in our case it was JIRA.
Right after the test run, we noticed that the system creates a significant number of duplicate errors. However, among these duplicates, many had almost the same stack traces.
It was necessary to change the method for identifying the same errors. From analyzing purely statistical data, proceed to finding the root cause of the error. Stack traces characterize the problem well, but they are rather difficult to compare with each other - line numbers change from version to version, user data and other noise get into them. In addition, they do not always get into the log - for some dropped requests, they simply do not exist.
In its purest form, stack traces are inconvenient to use for tracking errors.
It was necessary to select patterns, templates of stack traces, and clear them of information that often changed. After a series of experiments, we decided to use regular expressions to clear the data.
As a result, we released a new version, in it errors were identified by these unique templates, if stack traces were available. And if they weren’t available, then in the old way, by the http method and the API group.
And after that there were practically no duplicates. However, many unique errors were found.
The next step is to understand how to prioritize errors, which of them need to be fixed earlier. We prioritized by:
- The frequency of the error.
- The number of users she touches.
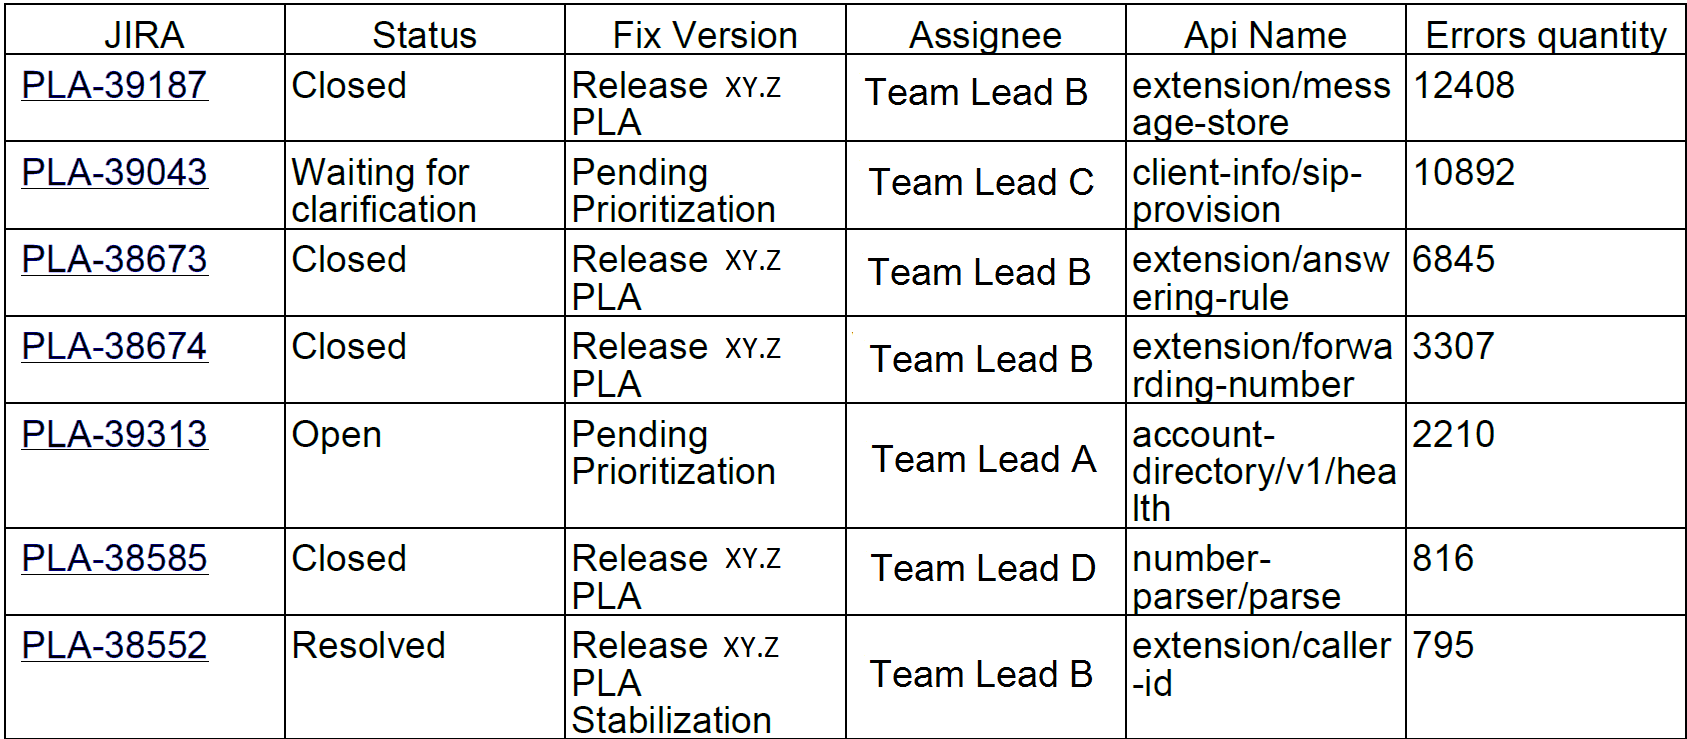
Based on the collected statistics, we began to publish weekly reports. They look like this:
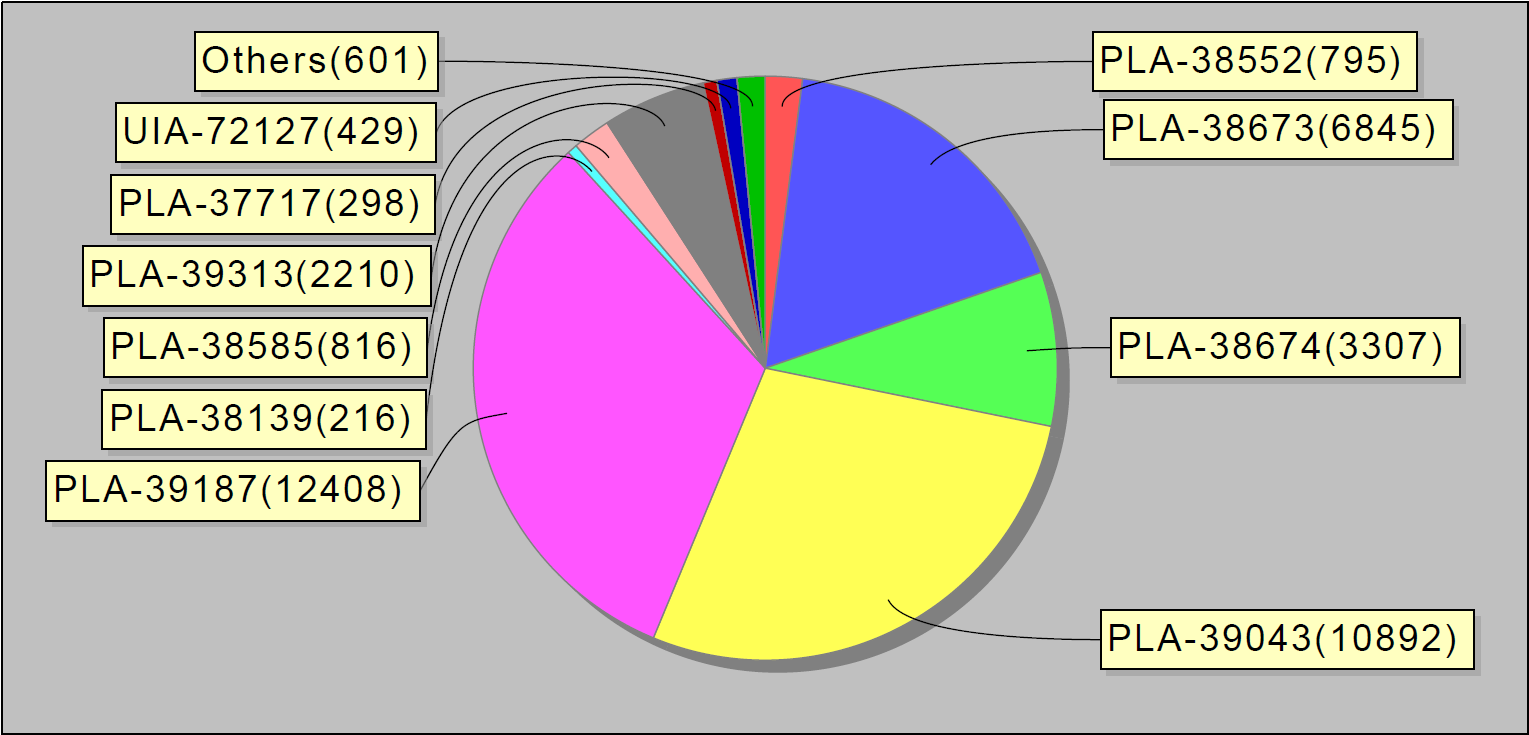
Or, for example, the top 10 mistakes per week. Interestingly, these 10 bugs in jira accounted for 90% of service errors:
We sent such reports to developers and team leaders.
A couple of months after we launched the system, the number of problems became noticeably less. Even our small MVP (minimally viable product) helped to better sort out errors.
Problem
Perhaps we would stop here if it were not for a coincidence.
Once I came to work and noticed that the system rivets bugs like hot cakes: one by one. After a short investigation, it became clear that dozens of these errors came from one service. To find out what’s the matter, I went to the deployment team chat room. There were guys in it who were involved in installing new versions of services on production and making sure that they worked as expected.
I asked: “Guys, what is what happened with this service?”.
And they answer: "An hour ago we installed a new version there."
Step by step, we identified the problem and found a temporary solution, in other words, restarted the server.
It became clear that the "erroneous" system is needed not only by developers and engineers responsible for quality. The engineers who are responsible for the state of the servers on production, as well as the guys who install new versions on the servers, are also interested in it. The service we are developing will show exactly what errors occur in production during system changes, such as installing servers, applying a new configuration, and so on.
And we decided to do another iteration of development.
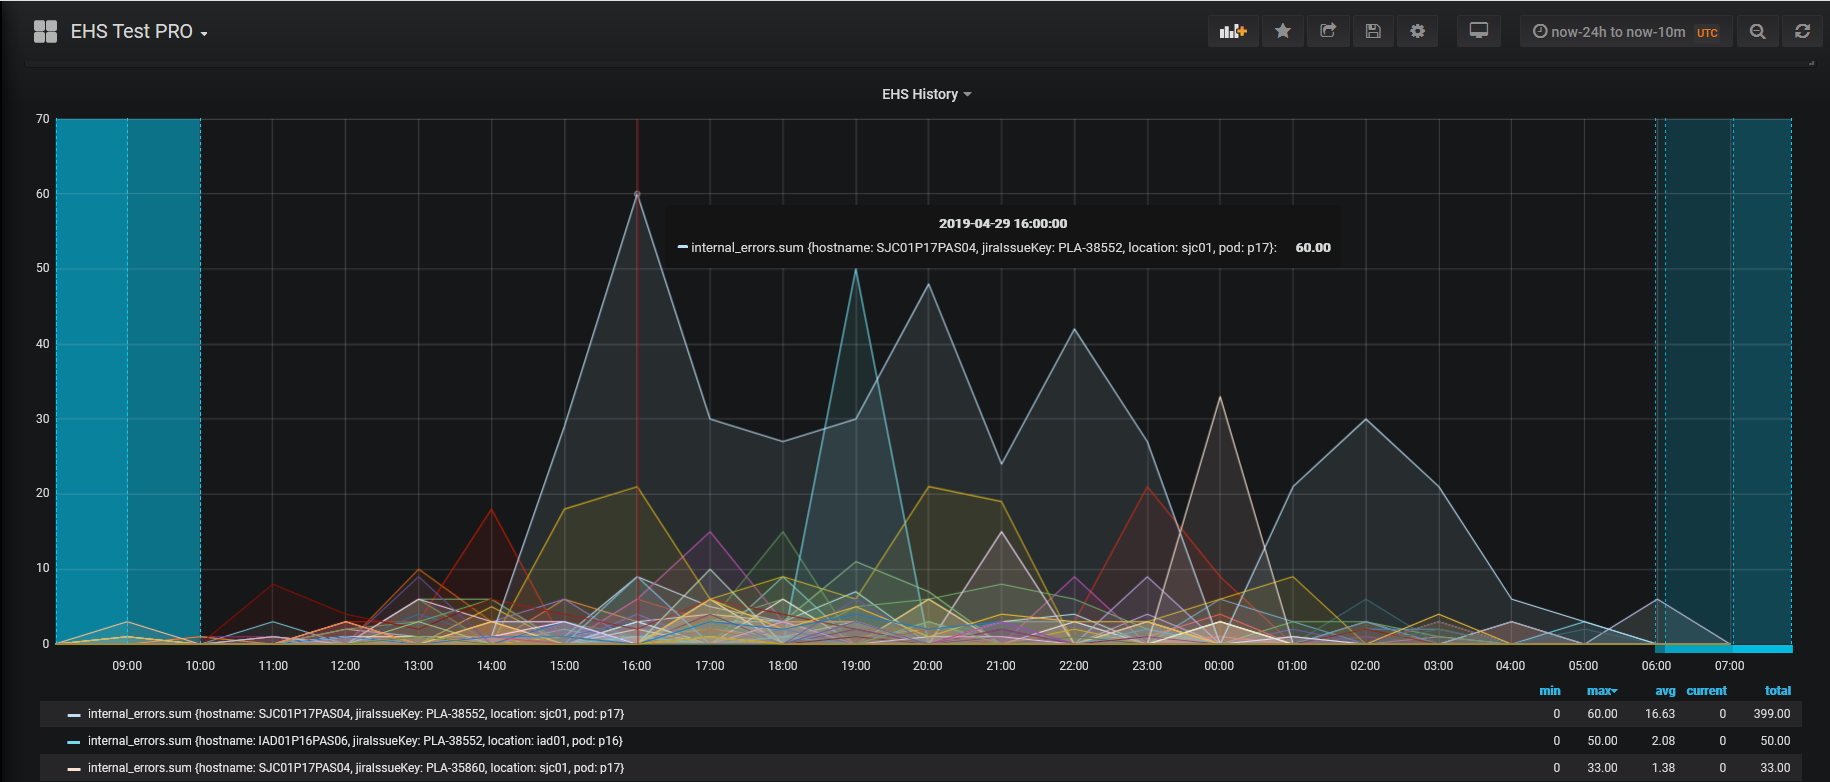
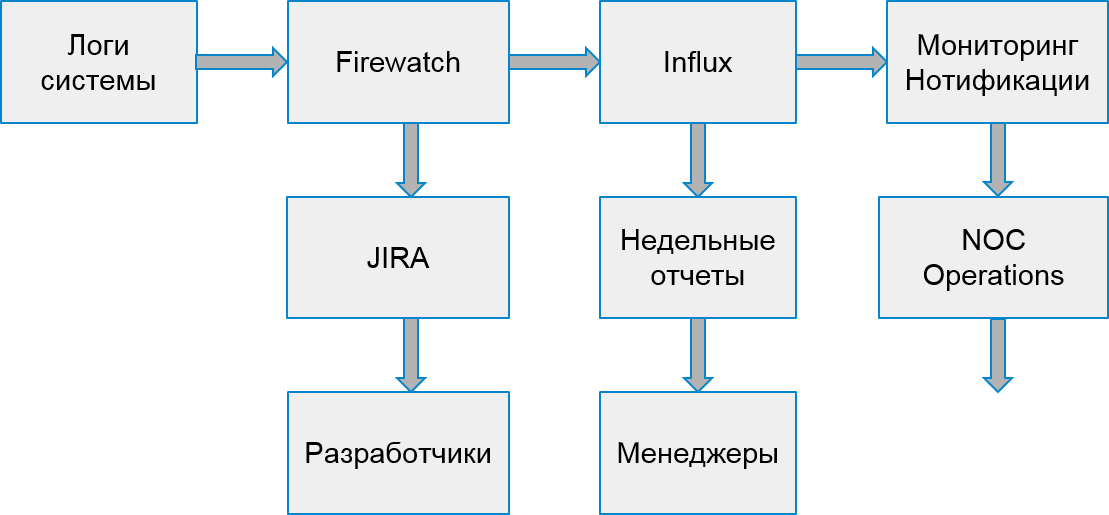
In the error handling process, we added a record of problem playback statistics to the database and dashboards in Grafana. This is how the graphical distribution of errors per day throughout the system looks like:
And so - errors in individual services.
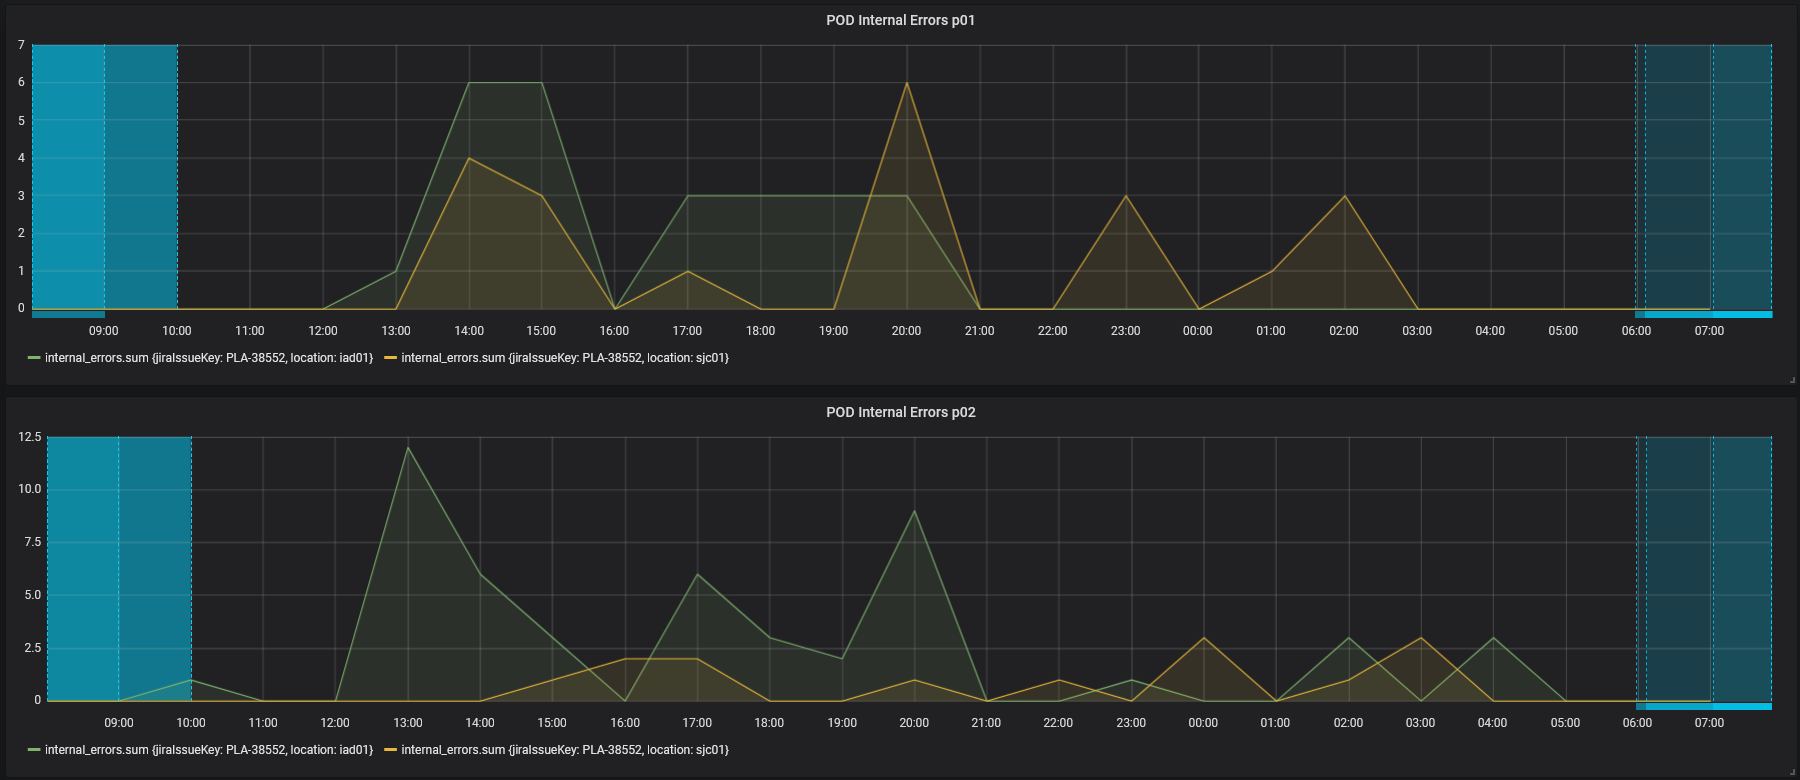
We also screwed triggers with escalations to the responsible teams of engineers - in case there are a lot of errors. We also set up data collection once every 30 minutes (instead of once a day, as before).
The process of our system began to look like this:
Customer Mistakes
However, users suffered not only from server errors. It also happened that the error occurred due to the implementation of client applications.
To handle client errors, we decided to build another search and analysis process. To do this, we chose 2 types of errors that affect companies: authorization errors and throttling errors.
Throttling is a way to protect the system from overload. If the application or user exceeds their quota of requests, the system returns an error code 429 and a Retry-After header, the value of the header indicates the time after which the request must be repeated for successful execution.
Applications can remain throttled indefinitely if they stop sending new requests. End users cannot distinguish these errors from others. As a result, this causes complaints to the support service.
Fortunately, the infrastructure and statistics system make it possible to track even client errors. We can do this because developers of applications that use our API must pre-register and receive their unique key. Each request from the client must contain an authorization token, otherwise the client will receive an error. Using this token, we calculate the application.
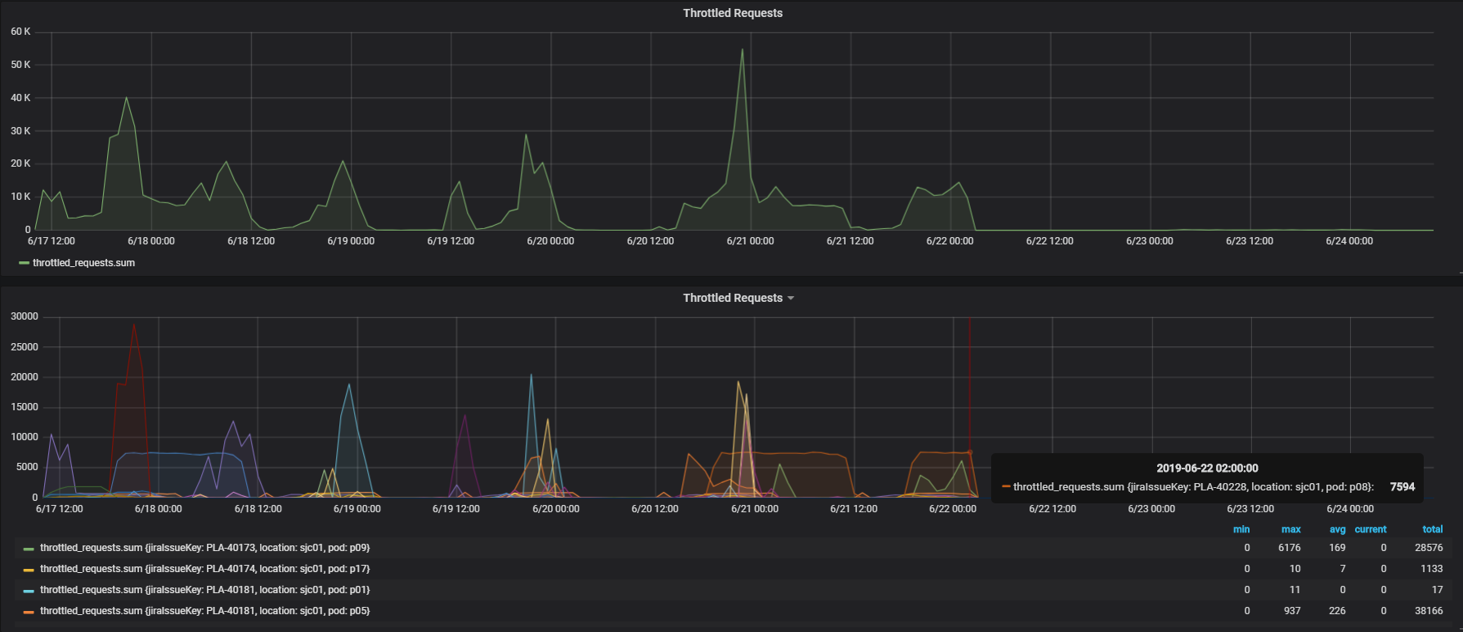
This is what throttling error monitoring looks like. Peaks of errors correspond to weekdays, and on weekends - on the contrary, there are no errors:
In the same way as in the case of internal errors, based on statistics from Hadoop, we found suspicious applications. First, in relation to the number of successful requests to the number of requests that completed with code 429. If we received more than half of such requests, we thought that the application was not working correctly.
Later we began to analyze the behavior of individual applications with specific users. Among the suspicious applications, we found the specific device on which the application is running and watched how often it executes requests after receiving the first throttling error. If the request frequency did not decrease, the application did not handle the error as expected.
Part of the applications was developed in our company. Therefore, we were able to immediately find responsible engineers and quickly correct errors. And we decided to send the remaining errors to a team that contacted external developers and helped them fix their application.
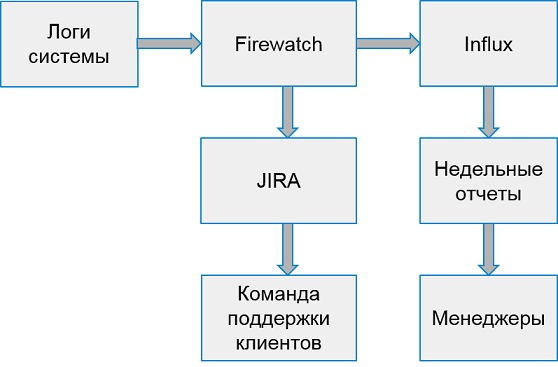
For each such application, we:
- We create a task in JIRA.
- We record statistics in Influx.
- We are preparing triggers for surgical intervention in the event of a sharp increase in the number of errors.
The system for working with client errors looks like this:
Once a week we collect reports from the top 10 worst applications by the number of errors.
Do not catch, but warn
So, we learned how to find errors in the production system, learned how to work with both server errors and client errors. Everything seems to be fine, but ...
But in fact, we respond too late - bugs already affect users!
Why not try to find errors earlier?
Of course, it would be cool to find everything in test environments. But test environments are spaces of white noise. They are under active development, every day several different versions of servers work. Catching errors centrally on them is too early. There are too many errors in them, too often everything changes.
However, the company has special environments where all stable assemblies are integrated to check performance, centralized manual regression and high availability testing. As a rule, such environments are still not stable enough. However, there are teams interested in parsing problems with these environments.
But there is one more obstacle - Hadoop does not collect data from these environments! We cannot use the same method to detect errors; we need to look for a different data source.
After a short search, we decided to process the statistics streaming, reading data from the queue into which our services write for transfer to Hadoop. It was enough to accumulate unique errors and process in batches, for example, once every 30 minutes. It’s easy to establish a queuing system that delivers data - all that was left was to refine the receipt and processing.
We began to observe how the errors found behave after detection. It turned out that most of the errors found and not fixed appear later on in production. So, we find them correctly.
Thus, we built a prototype of the system, institutions and error tracking. Already in its current form, it allows you to improve the quality of the system, notice and correct errors before users know about them. If before we processed tens of thousands of erroneous requests per week, now it is only 2-3 thousand. And we correct them much faster.
What's next
Of course, we will not stop there and will continue to improve the system for searching and tracking errors. We have plans:
- Analysis of more API errors.
- Integration with functional tests.
- Additional features for investigating incidents in our system.
But more about that next time.