In addition, Gantt charts are suitable when there is a preliminary plan for the entire content of the project (at least high-level), while Kanban boards are more suitable for cases when the whole plan arises and is finalized as the project develops.
Kanban boards are better suited for repetitive work (work with similar steps), and Gantt charts are for combining different types of work.
Finally, these tools imply different perspectives on work, which should correspond to your approach to work and your approach to development (Agile or predictive).
Now let's take a few more minutes to figure out the details.
These are more than just different ways to visualize data.
Gantt charts and Kanban boards look very different, right?
Both the Gantt chart and the Kanban board by default offer their own ways of visualizing data. Although a visualization method can be important and has practical implications, the concepts and methods that underlie it are more important, so let's take a quick look at them.
The concepts behind Kanban boards
First, it’s important to note that Kanban Board is different from Kanban, which is a method, and also different from Kanban Development, which is an alternative to Scrum (and is largely inspired by Scrum).
The Kanban method has been used in production for some time. The method has several rules, and one of them is to visualize the work. This visualization is done on Kanban boards.
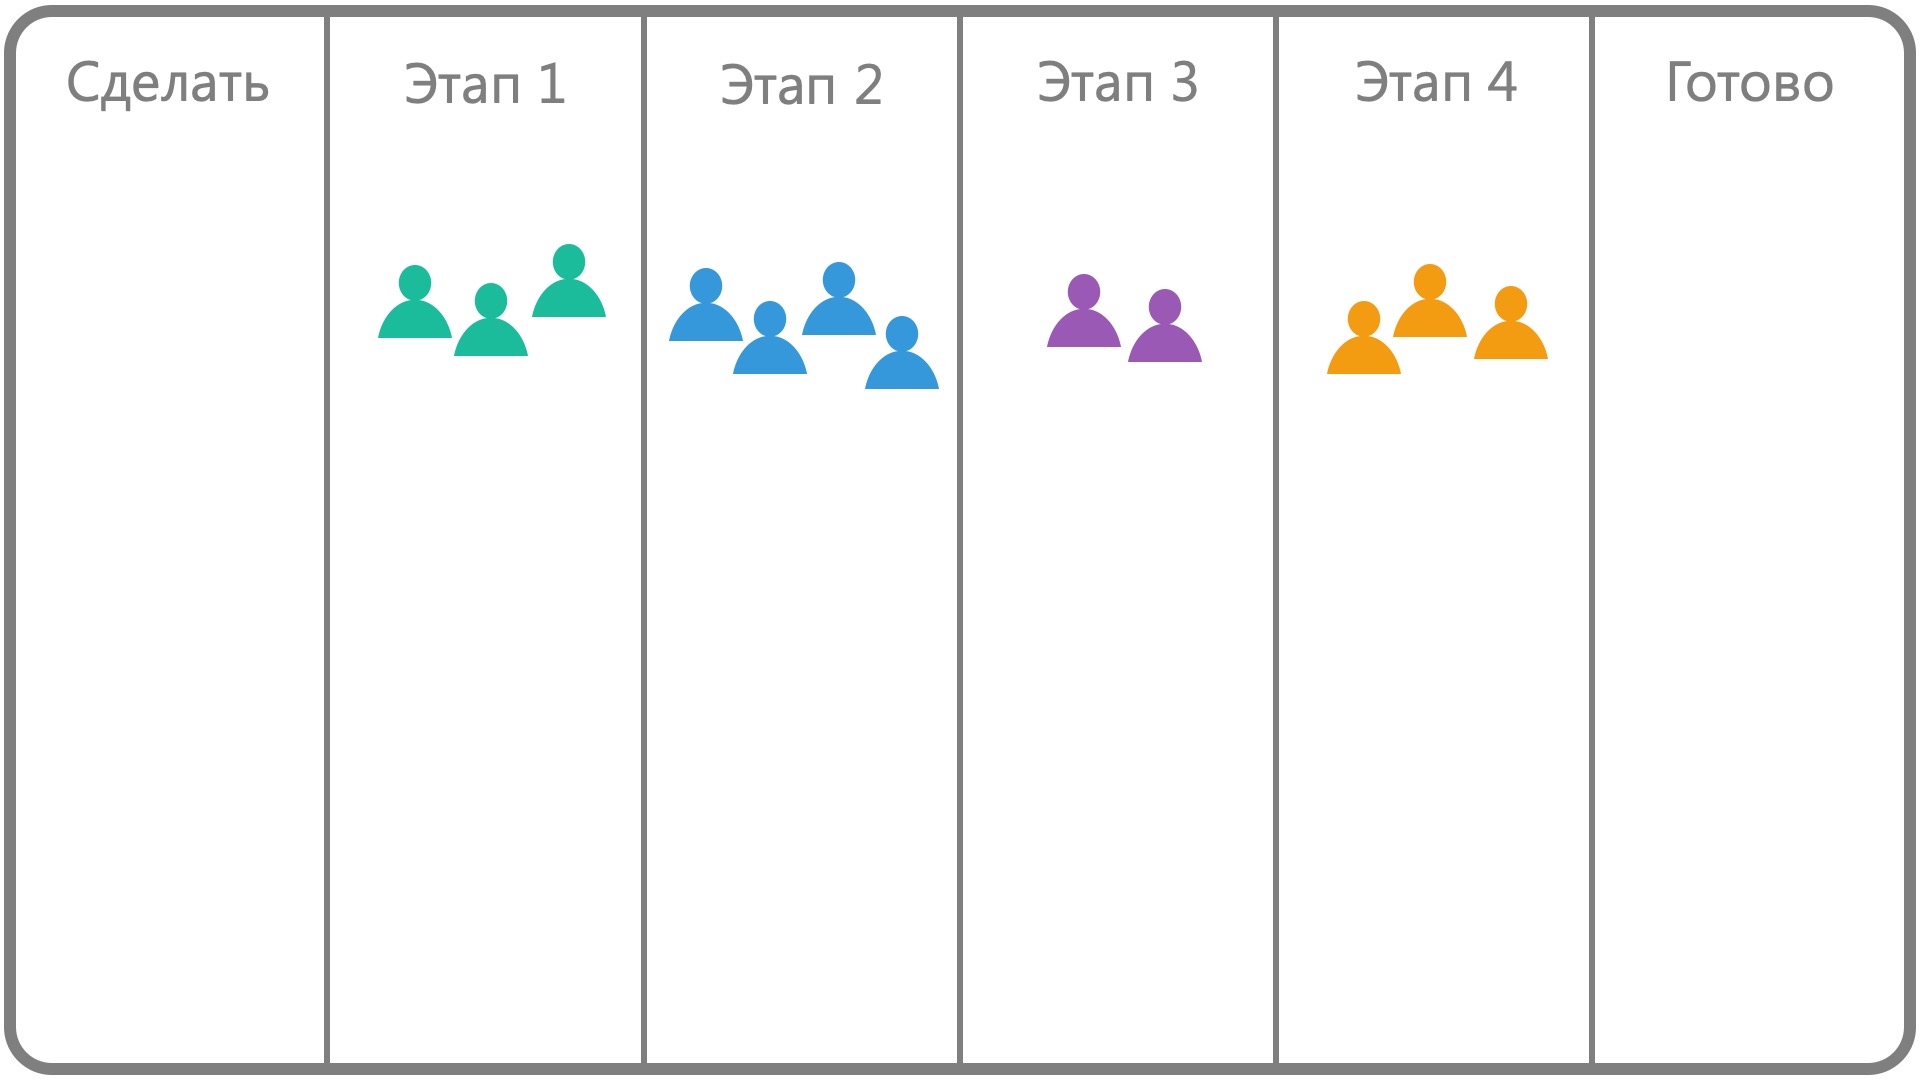
In the Kanban method, we determine the stages in the work and create columns for them on the board.

At each stage, several people work. Let's add them to the board too.
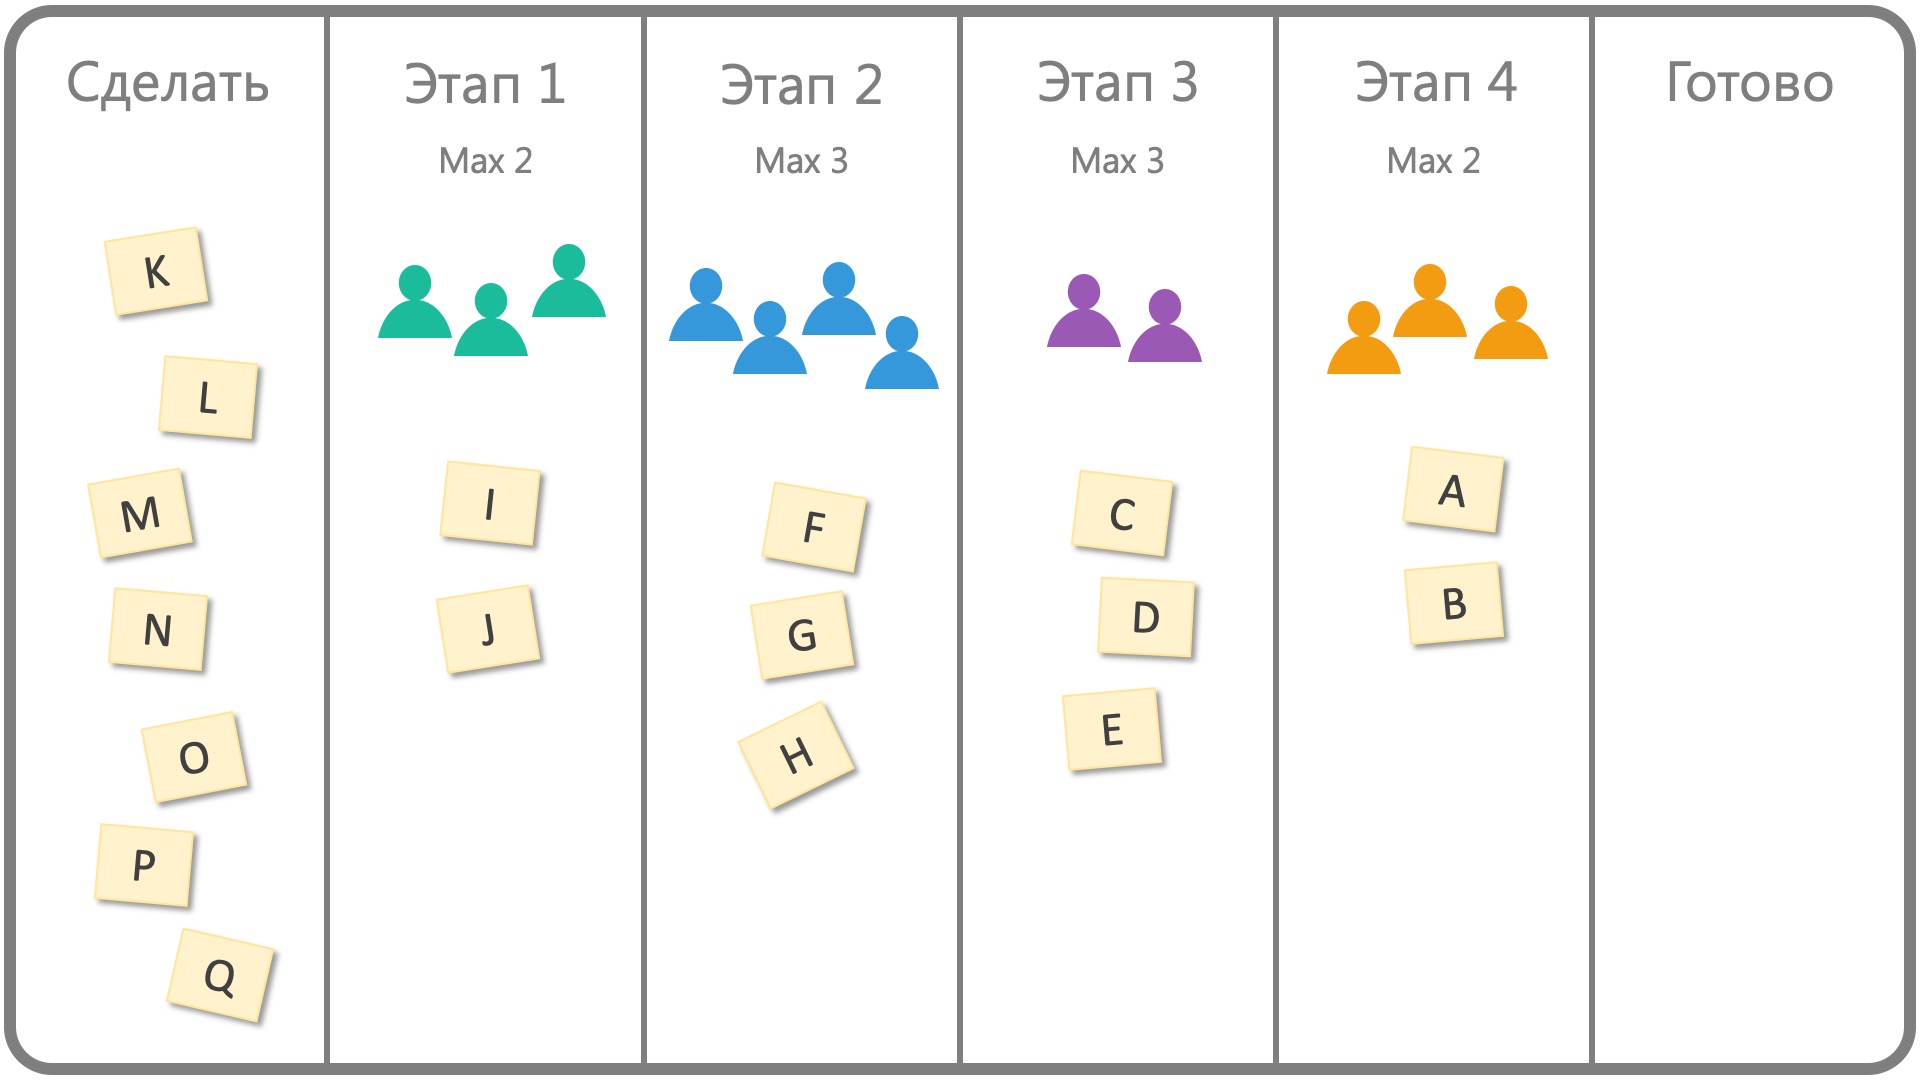
Another fundamental rule in Kanban (in addition to visualization) is that each stage of work should have a limit on incomplete work so that you can focus on completing tasks.
There is no formula for calculating the ideal limit of work in progress for each stage. As a rule, people set the initial value on the basis of their own experience, and then look for the optimum by trial and error.
So, let's add work in progress limits to the board.

Let's imagine that they are already working on several elements.
Usually in such cases, we send the element to the next stage, that is, “push” it. Kanban offers another solution: it is a “pulling” system, that is, we cannot send work to the next stage; it remains there until the next stage requires another work item and it will not “pull” it into its column.
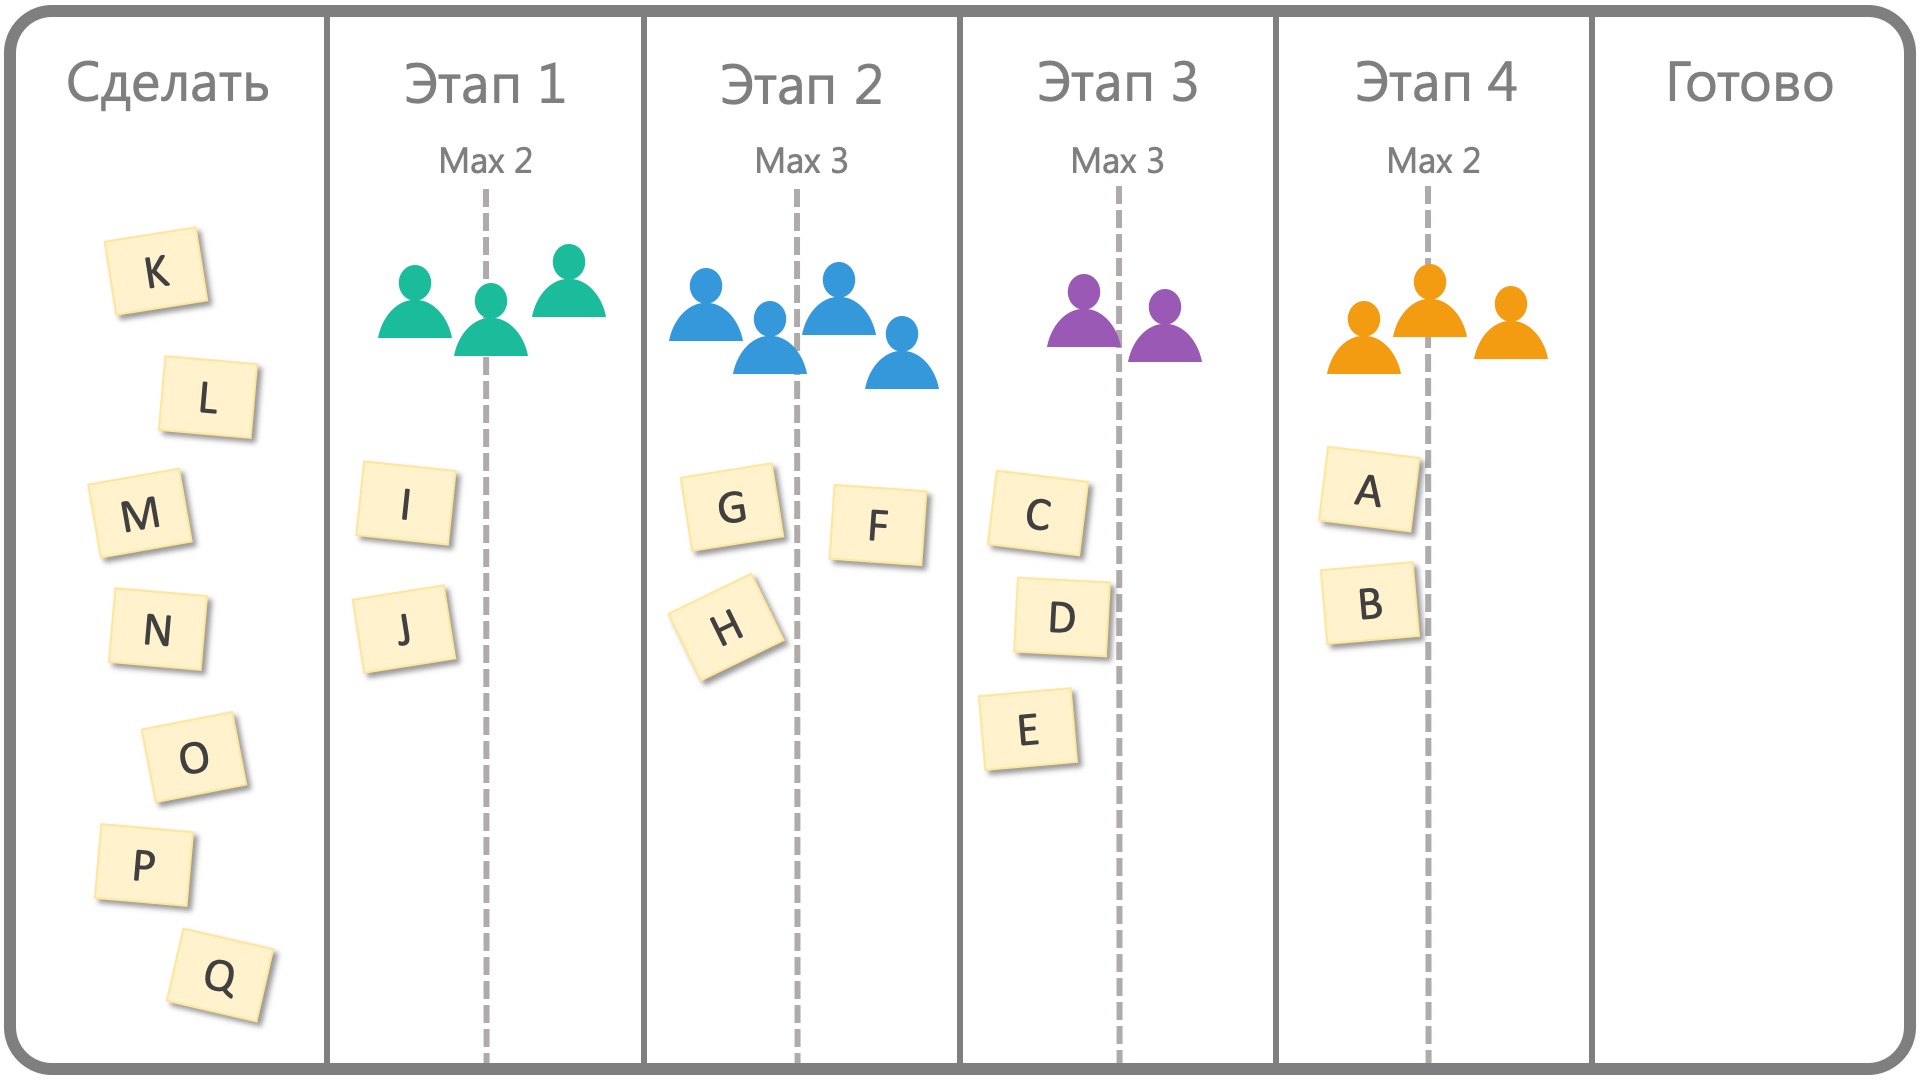
Sounds weird? Have you thought about the practical differences between the approaches? I'll talk about them in a minute, but first, let's update our board to better visualize it by dividing each column into two sections: one for the elements in this column that still need work, and one for those that are finished.

Now, instead of moving (F) to the next column, we put it on the right side of the same column.
So, you asked about the practical difference, and here it is: imagine that (G), (H), (I) and (C) are finished.
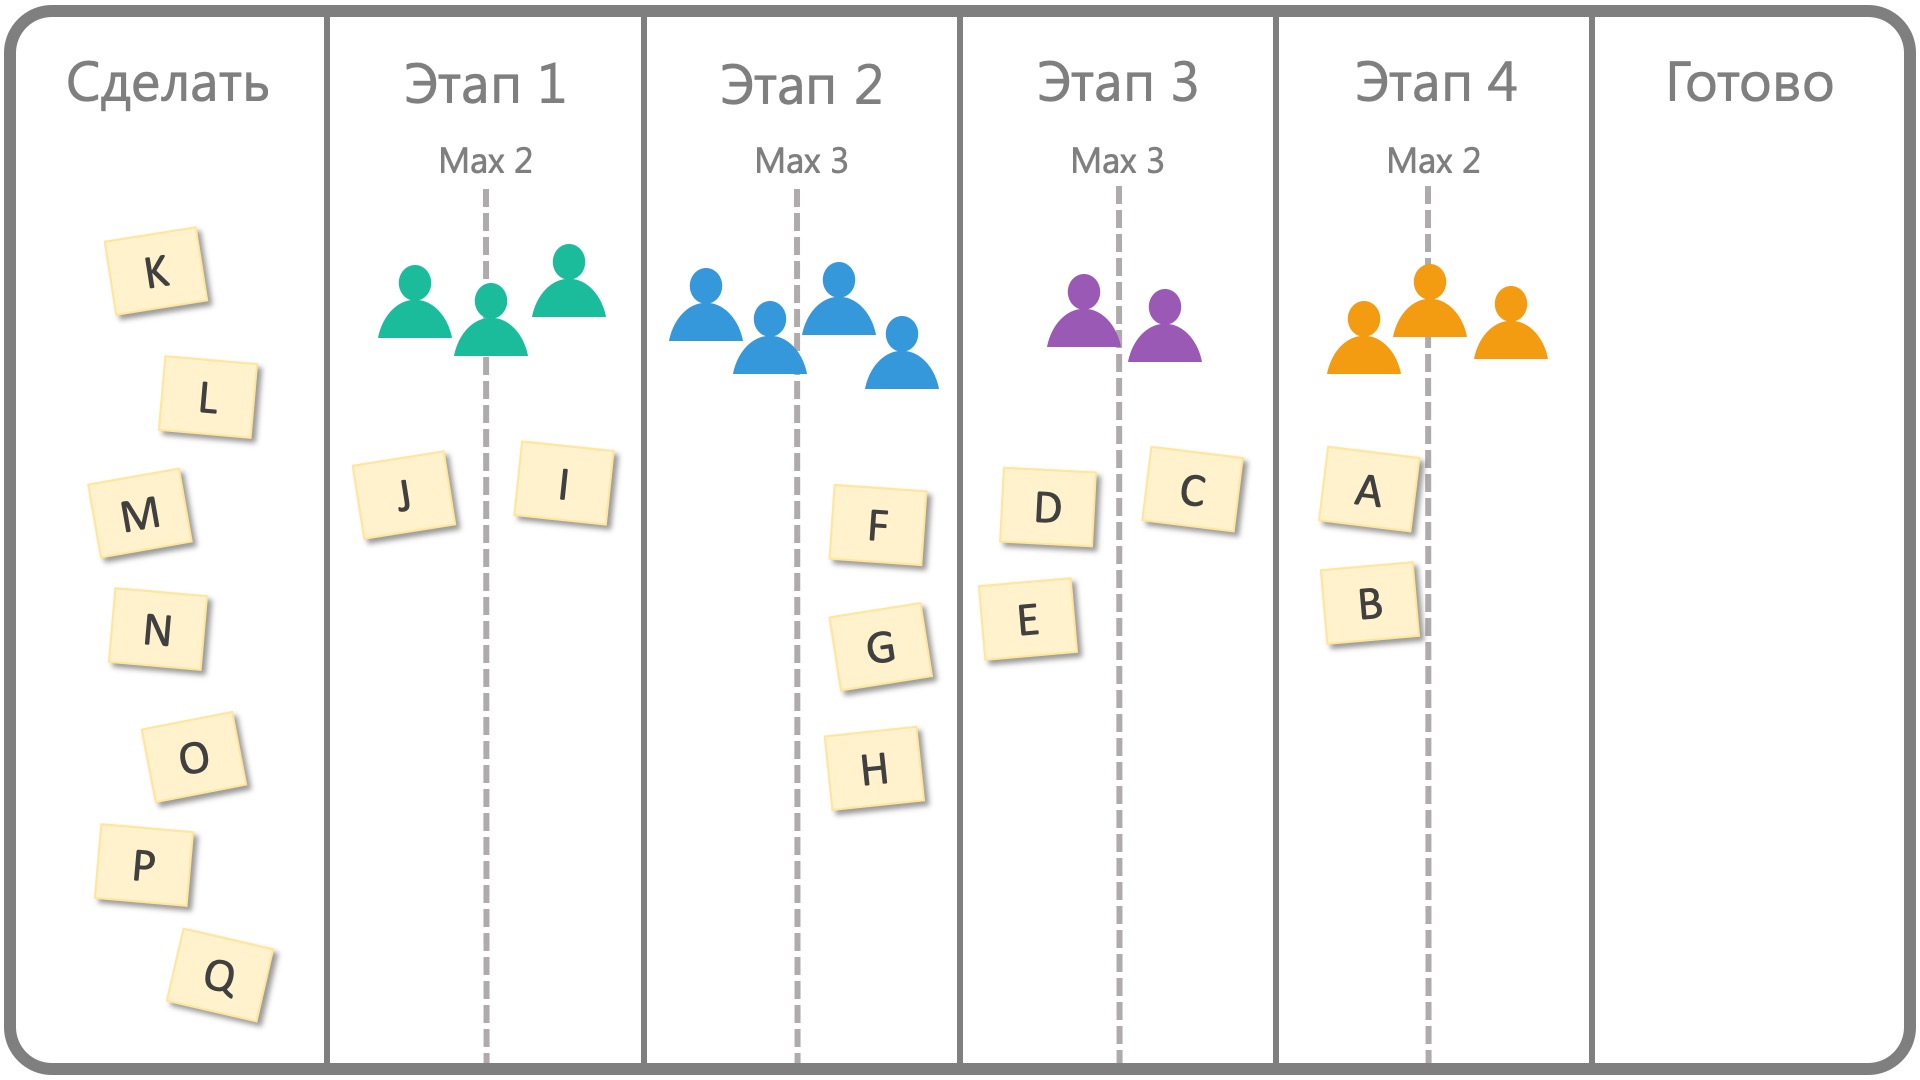
What will you do if you are in Stage 2?
Usually the answer is this: you take element (I) from the previous column and start working on it. But wait - your work in progress limit is three, and you already have three elements! Yes - (F), (G) and (H), which are on the right side of the column, are still counted. It is also a pull system, and you need to wait for people in step 3 to stretch (F), rather than pushing it into their column.
The problem is that you are not allowed to take a new work item, but you have nothing more to do; so what is happening now?
This restriction is critical in Kanban. At this point, the people in Stage 2 cannot start working on a new element and they need to go and help people who are dealing with a bottleneck - Stage 3 in our example:

This may extend to other columns: when (J) is executed in Stage 1 and (A) and (B) are performed in Stage 4, they should also join Stage 3 and try to solve the problem together.
This is the idea of the Kanban method: everyone is focused on the whole process, and not on one of its stages, and the highest priority is given to the early completion of work items, instead of completing a large number of tasks and creating unfinished work.
So, then, Kanban board is the way we visualize this work option. I usually emphasize this because most people use whiteboards, such as Trello, as a simple free visualization method for their tasks, regardless of the Kanban method. (I must admit, sometimes I do it too!)
So, let's now look at the concepts underlying Gantt charts, and then we can compare them.
Gantt Chart Concepts
Here is a typical Gantt chart:
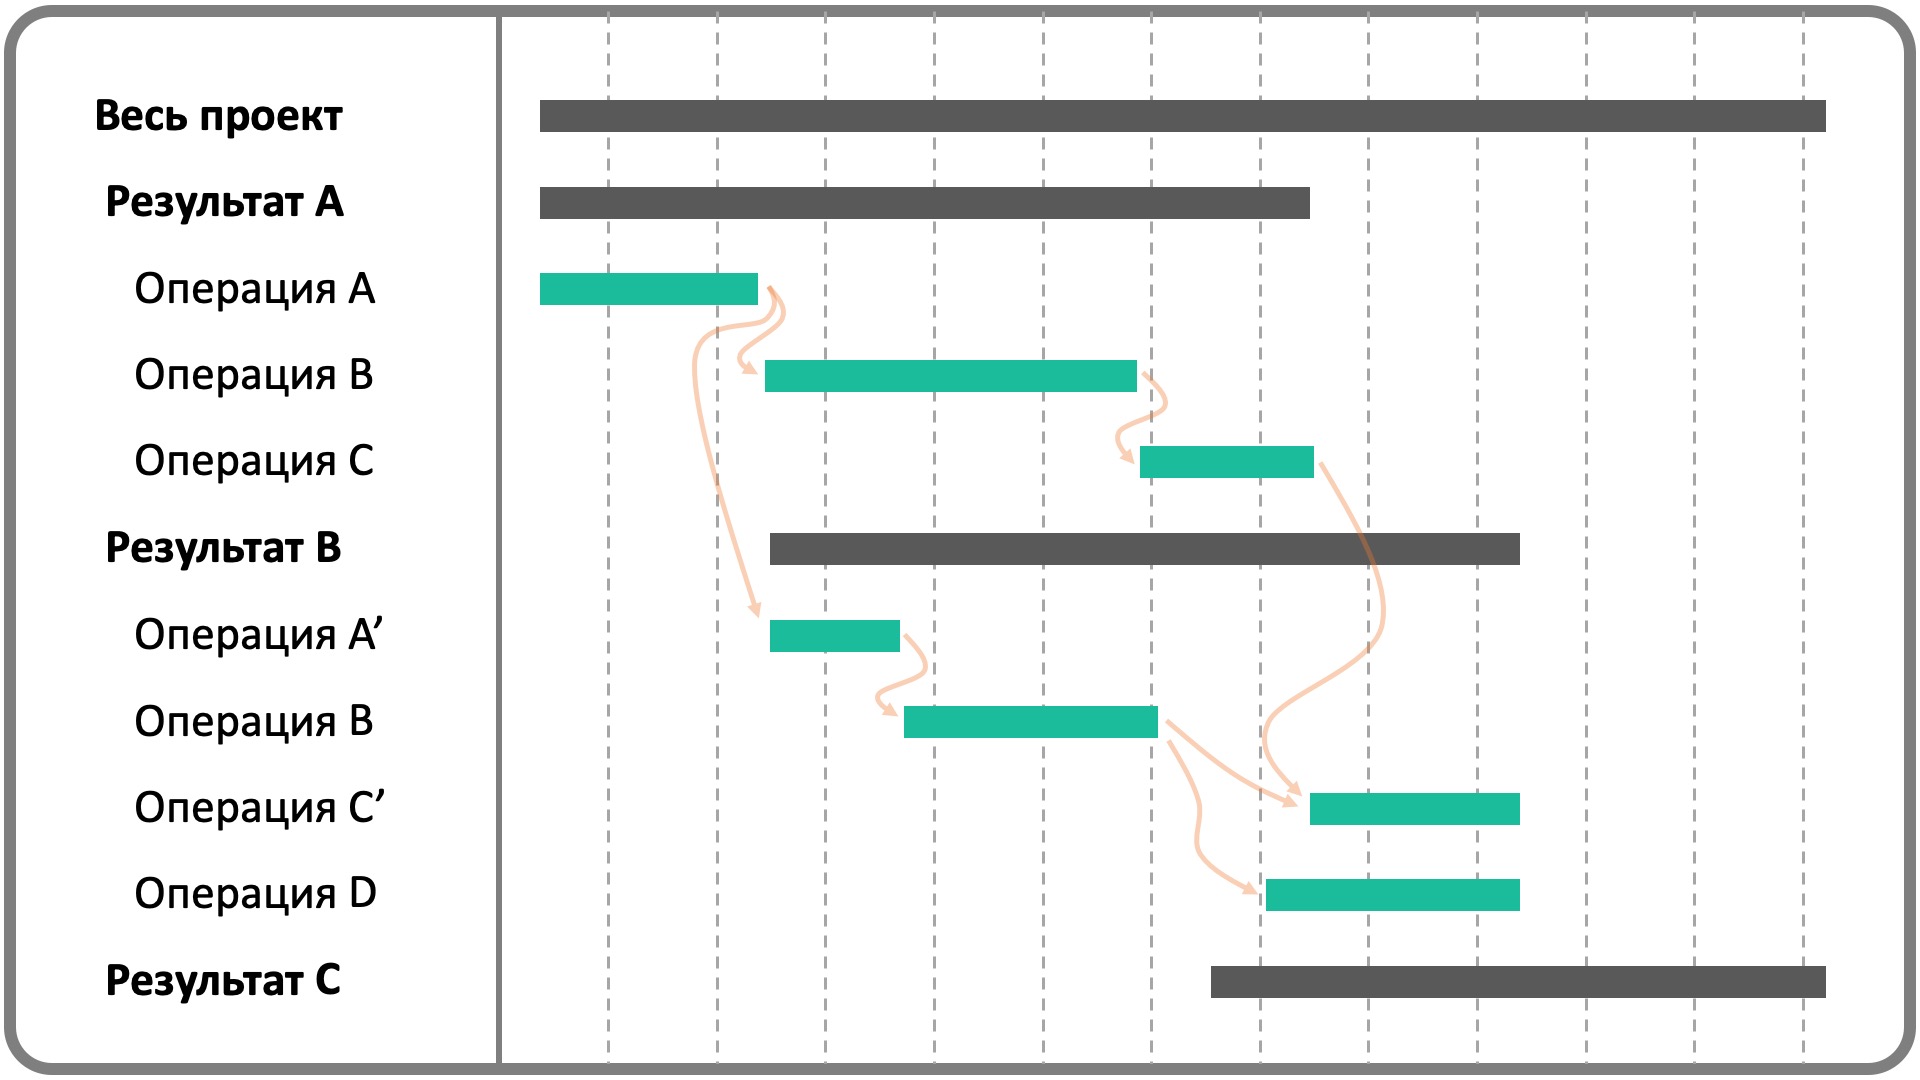
As you can see, the start and end dates of operations are shown here, there is the date of completion of the project as a whole. Where do the dates come from?
A normal Gantt chart is entirely based on dependencies between operations. For example, operation A 'of Result B cannot begin before the completion of operation A of Result A.
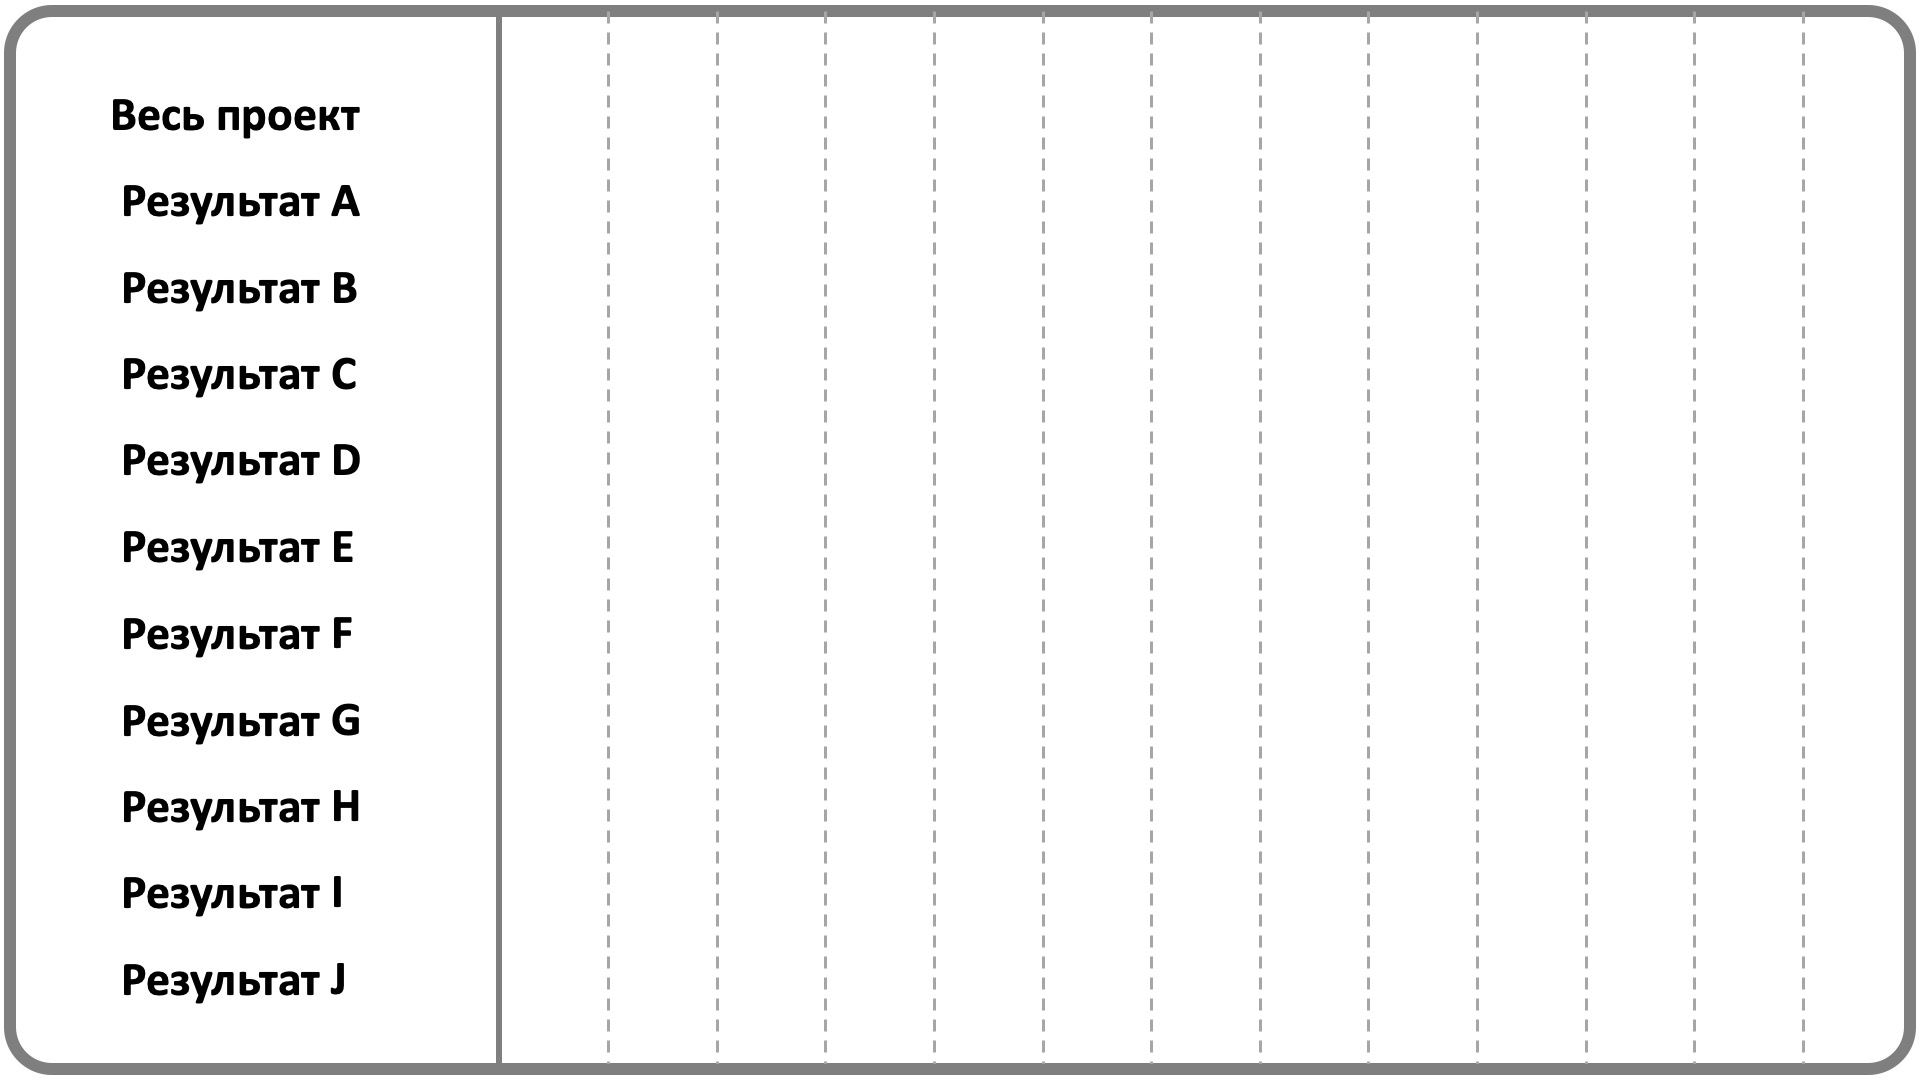
So, in order to create a Gantt chart, we first create the SRI, which means “hierarchical structure of work”, although in fact it is not about work, but about the hierarchy of results / products. (At least it should be.)
Then we check what operations must be performed to obtain each result and add them to the list. These actions are somewhat similar to the columns on the Kanban board, except that we are not limited to a fixed set of steps, and each result may be different.
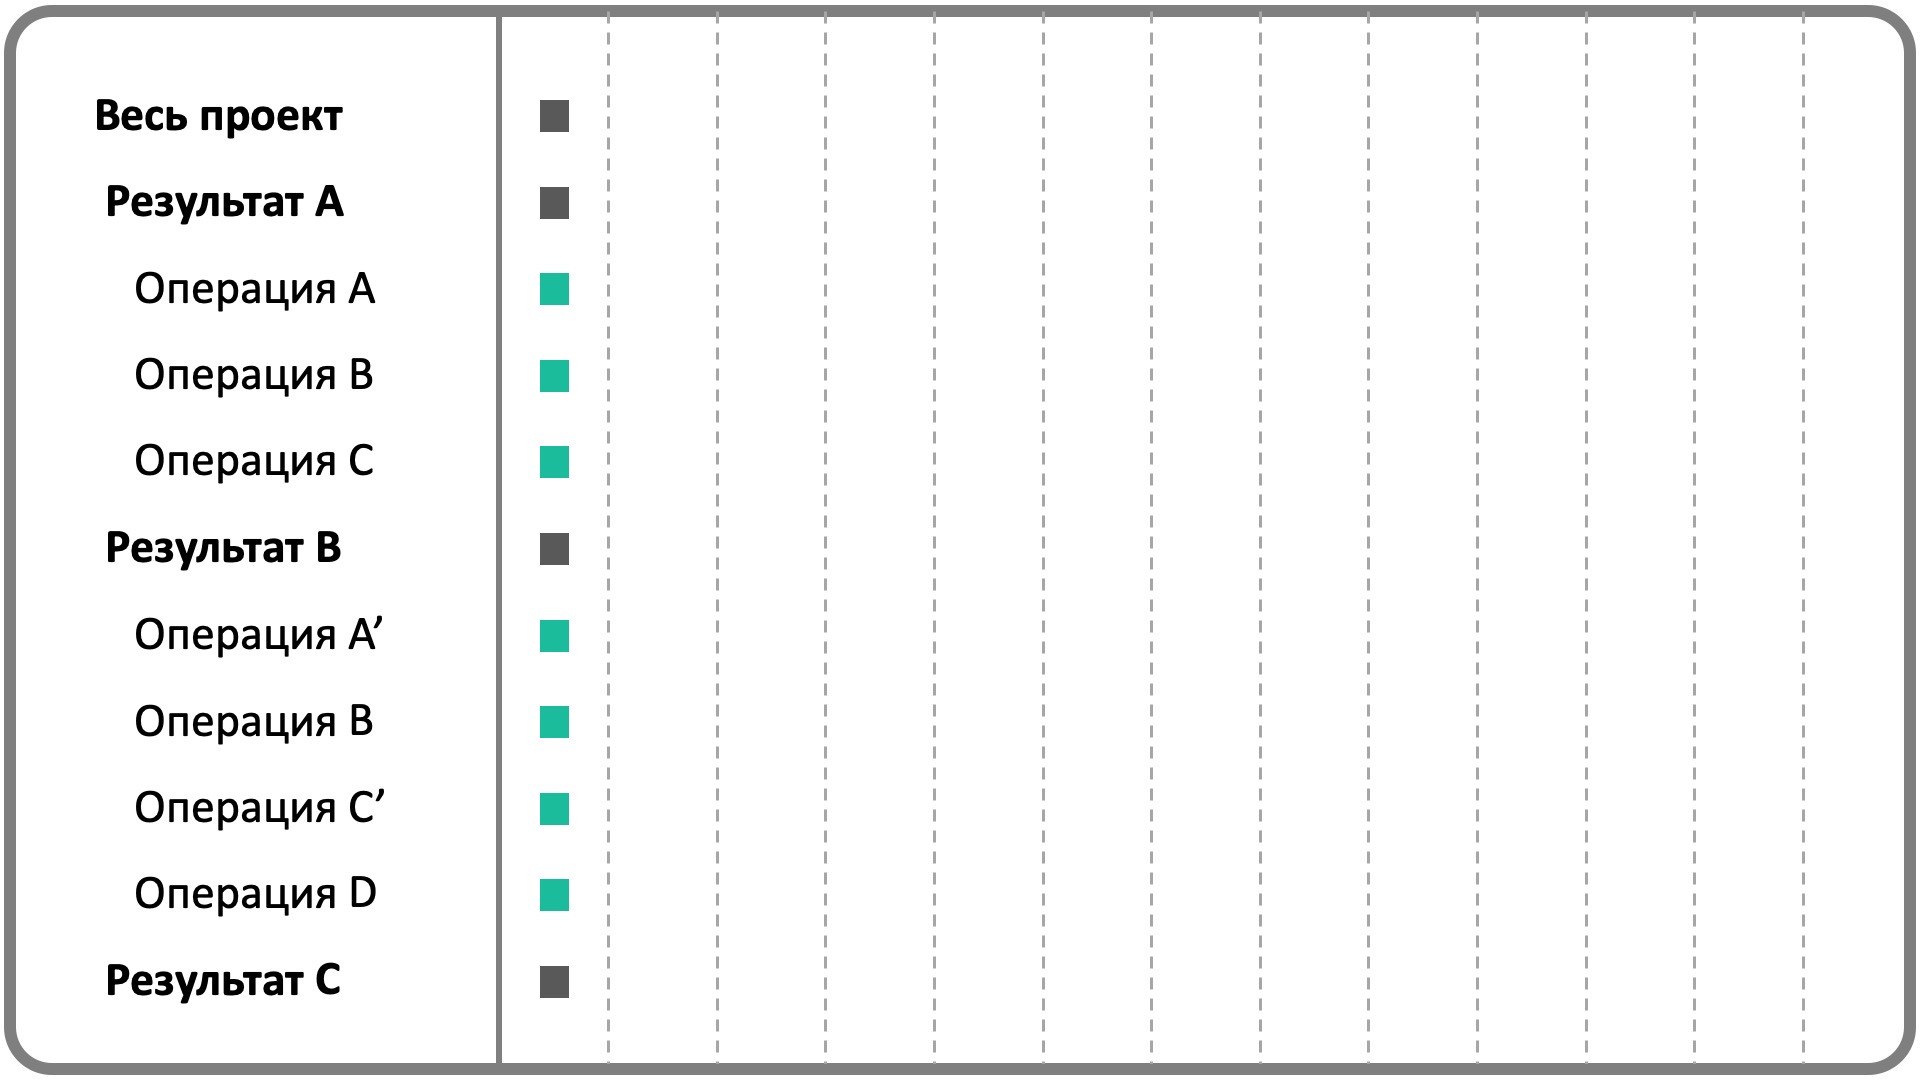
Then we evaluate the duration of the operations.
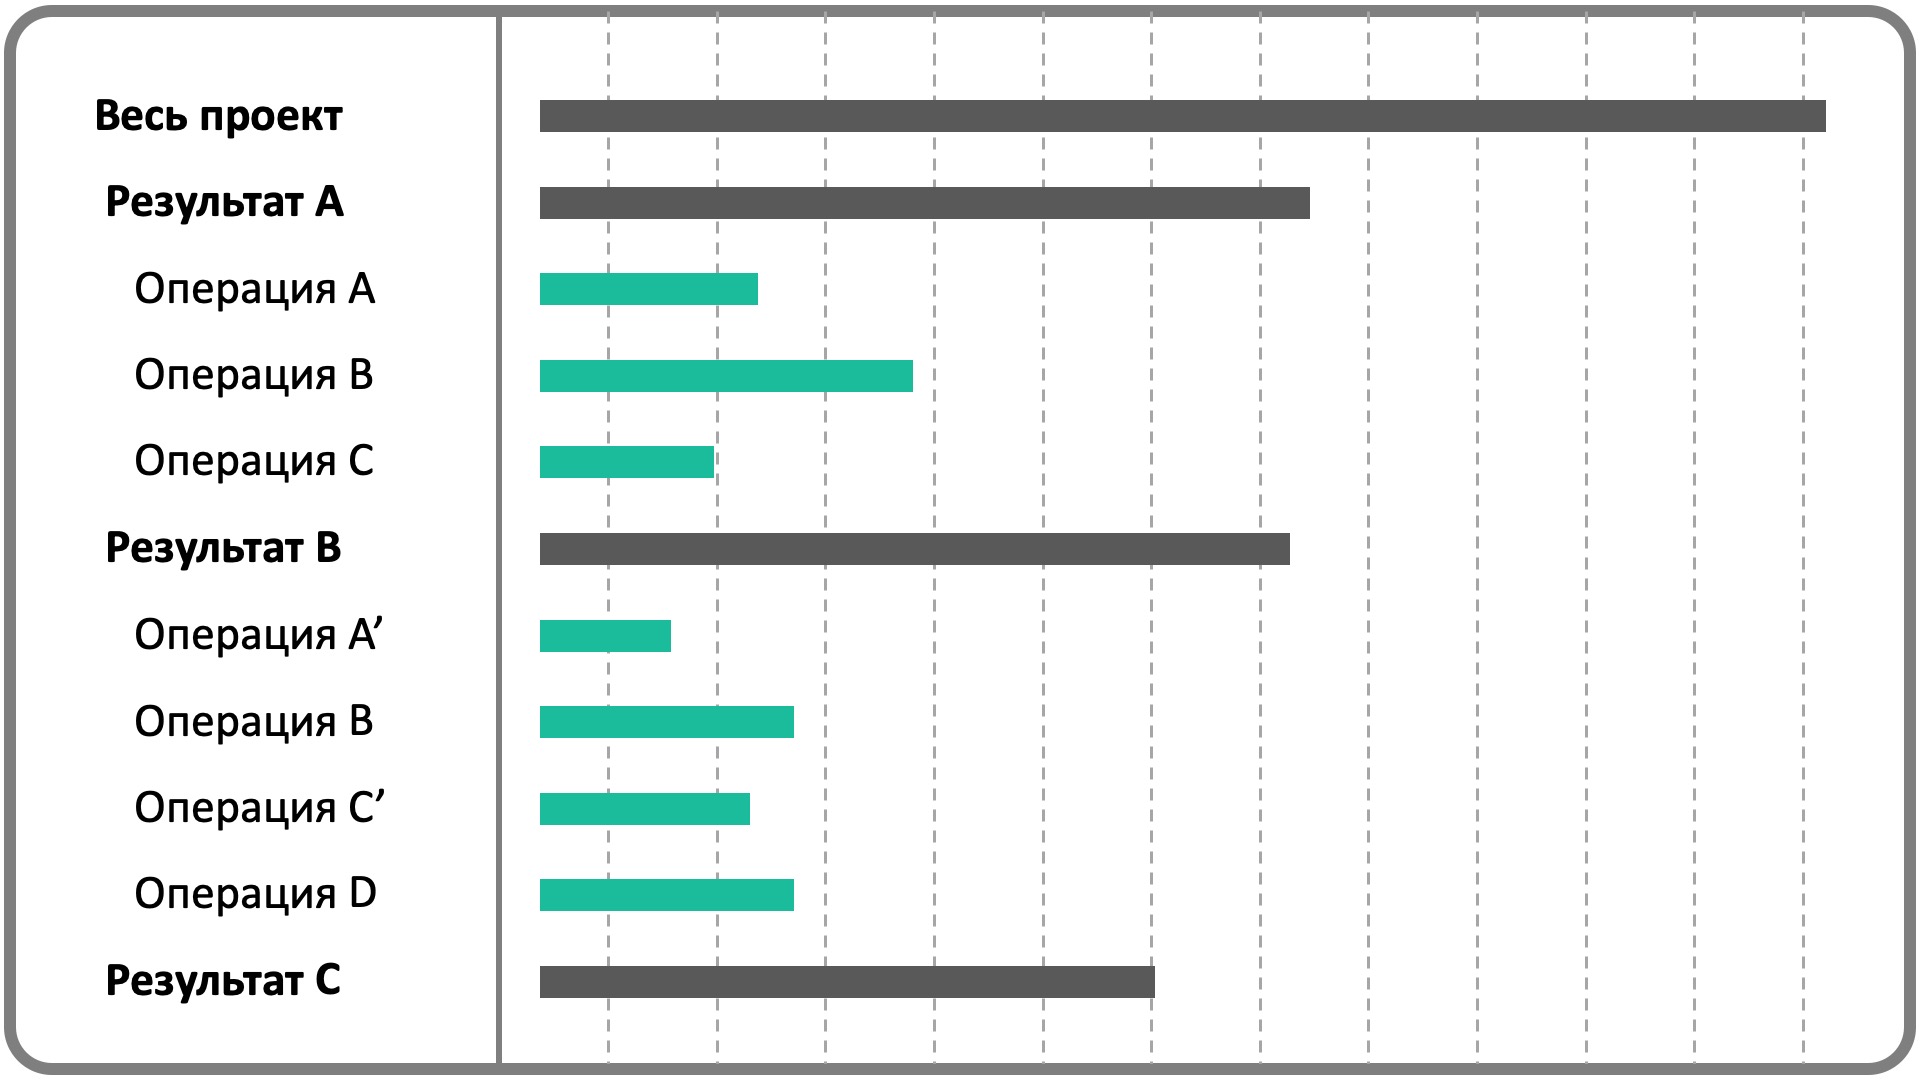
Then we determine the dependencies between operations, which in turn will affect the start and end dates of operations. Dates are usually calculated using the critical path method (CPM).
And voila, we have a schedule!
Well, this is the simplest form of schedule, you can also take into account resources, restrictions, different working hours for various operations and resources, etc.
So, the first result of using this CPM / Gantt combination is that we will have a bottom-up calculation that will give us the project completion date. But that is not all ... we can learn much more.
Here are some examples:
We can check different scenarios
Suppose we are concerned that one of the suppliers may complete the work 30 days later. How will this affect the project? This is not easy to determine in a non-linear system, but when we have the right schedule model, we can simply change the duration of this element and see how it affects everything else.
We can analyze the delays
Suppose we completed our project three months later than we should. However, some parts of the project were delayed due to the customer, and now we need to analyze the delays and see what part of the delay is our responsibility. In this case, we can add client delays to the chart elements, see what delay they create for the entire project, and then the difference between this and the actual delay will be our responsibility.
We can find the most important operations
Not all operations are equivalent. Some may be delayed for a reasonable time without delaying the entire project, while others have a greater impact, which means that each day of delay in these operations will add one day of delay to the entire project. Is it not worth knowing which operations are critical, and therefore be more careful with them? The critical path method helps us find these actions.
So, we examined the concepts and methods that underlie the Gantt and Kanban diagrams of boards. Now we can really compare them.
Differences in Context
Gantt charts are intended for projects, and not for production and other types of daily activities (that is, ordinary business or OSes). I have seen many people view their daily affairs as projects and try to use tools and methods such as the Gantt chart and CPM, but it doesn’t work very well. I also saw people who claim that everything is a project (which usually encourages me to start a very long discussion with them;)
Kanban, on the other hand, was originally (and maybe primarily) intended for production, but people have long used it in projects.
Differences in Work Item Types
The columns are fixed on the Kanban board, which makes it useful when the elements have very similar stages of work on them. This is not always the case, which limits the use of Kanban. We can always force ourselves to make the columns as general as possible, applicable to each element, but this makes the Kanban system ineffective.
Thus, if the elements in your project are very different from each other (for example, in a construction project), the Kanban board may not work.
Dependency Differences
A Gantt chart is almost meaningless without dependencies. I still remember one of the Microsoft Project releases many years ago, when they first introduced “manual planning” and it was possible to create diagrams without dependencies. Many considered this blasphemy!
Despite this, you can consider CPM / Gantt as a tool for managing dependencies, but this is not so with the Kanban board, which is used when the elements themselves do not have any interdependencies, and the only dependency is the work stages, which are visualized in the form of columns on blackboard.
For projects, the concept of dependencies is a bit controversial. The general explanation is that there are dependencies in predictive projects (some people call this a “waterfall,” which I don't like), and therefore the Gantt chart is a good option; while in Agile projects there are no dependencies, hence the proposal to use Kanban boards.
I even heard some people who are not big fans of Agile doubt Agile because "it does not take into account addiction." The fact is that Agile does not ignore dependencies, but the idea is to approach the project and form elements in such a way that dependencies are not created. If done correctly, there will be no (or at least not many) dependencies.
Differences in Planning Methods
A Gantt chart works when there is a preliminary plan that covers the entire project scope, and works best when the plan is relatively detailed. This is due to the fact that if only elements of a very high level are present in the plan, the dependencies between them will be very inaccurate and rather arbitrary, since real dependencies are formed on the basis of relatively small operations, and then are reflected at higher levels of the plan.
Thus, if there is no complete plan at the beginning of the project, the Gantt chart will not work. On the other hand, there are no such restrictions in the Kanban method. You can always add new elements to the first column and arrange the column again; then you go on and add more elements as they appear. To better understand this, imagine a team that supports a live software application, fixing bugs and adding minor features (which is a daily routine, not a project).
Because of this, the Gantt chart is not suitable for typical Agile projects in which there are no preliminary plans. However, some Agile projects (such as DSDM) have a high-level preliminary plan.
When to use Kanban boards
Since Agile projects can have elements without dependencies, you can use Kanban boards in them. It can be either a Kanban board only for visualization, as is usually the case in most Scrum projects, or a Kanban technique with its own board, which is often found in the Kanban development method.
On the other hand, a typical Agile project at first may not have a clear content, but allows it to appear and develop throughout the entire project. It is very well maintained by Kanban.
In fact, it is neither possible to remove dependencies in predictive projects, nor to launch a project without specific content. Although you can always start a project without a plan, it will not become a predictive or adaptive project; it will be just chaos. Thus, already for these two reasons, Kanban will not be a good solution for predictive projects.
When to Use Gantt Charts
A predictive project has many dependencies and certain content, which is determined in advance. The Gantt chart is designed specifically to support this type of project - it's simple!
Since Agile projects have no dependencies (or at least should not have them), a Gantt chart will not be useful to them. Although some Agile projects (such as DSDM) have a high-level preliminary plan that can be managed using the Gantt chart, most Agile projects that use Scrum or its other variations do not necessarily have any preliminary plan, which makes using the Gantt chart practically impossible.
Combination
Then how about combining two tools?
Each of them is more useful for one of the approaches; so this will not help if we try to mix the two tools at the project level. However, perhaps a useful scenario is to have a Gantt chart for the project as a whole (predictive project) and use the Kanban boards for the stages of the project where appropriate. For example, in a construction project, we can use Kanban boards for work stages that have fewer dependencies and similar results. Some design steps are suitable for this.
Interestingly, some planning tools support both views for the same dataset, which means that you can plan your project with them and visualize it as a Gantt chart and Kanban board. They are very useful for such a mix.