Flash reliability: expected and unexpected. Part 2. XIV conference of the USENIX association. File storage technologies
5.5. Unrecoverable errors and lithography
Interestingly, the effect of lithography on uncorrectable errors is less clear than in the case of RBER, where a smaller lithography, as expected, leads to a higher RBER. For example, Figure 6 shows that the SLC-B model has a faster error correction rate than the SLC-A model, although the SLC-B has a larger lithography (50nm compared to 34nm for the SLC-A model). In addition, models of the MLC series with a smaller working size (MLC-B model), as a rule, do not have higher error correction rates than other models.
In fact, during the first third of its life (the number of PE cycles from 0 to 1000) and in the last third of its life (> 2200 PE cycles), this model has a lower UE frequency than, for example, the MLC-D model. Recall that all MLC and SLC drives use the same ECC mechanism, so these consequences cannot be attributed to differences in ECC.
In general, we find that lithography has a lesser effect than expected and a lesser effect on uncorrectable errors compared to what we observed when studying the effect of RBER.
5.6. The impact of other types of errors compared to uncorrectable errors
Consider whether the presence of other errors increases the likelihood of uncorrectable errors.
Figure 7 shows the probability of a fatal error occurring in a given month of disk operation, depending on whether various types of errors occurred on the disk at some point in the previous period of operation (yellow color of stripes) or in the previous month (green color of stripes), and comparison this probability with the probability of an uncorrectable error (red bars) in the next month.
We see that all types of errors increase the likelihood of uncorrectable errors. In this case, the maximum increase occurs when the previous error was noticed relatively recently (i.e., in the previous month — green bars on the chart are higher than yellow) or if the previous error was also an uncorrectable error. For example, the probability of a fatal error occurring one month after another fatal error is almost 30% compared to the 2% probability of seeing a fatal error in any other month. But final write errors, meta errors and erase errors also increase the likelihood of UEs by more than 5 times.
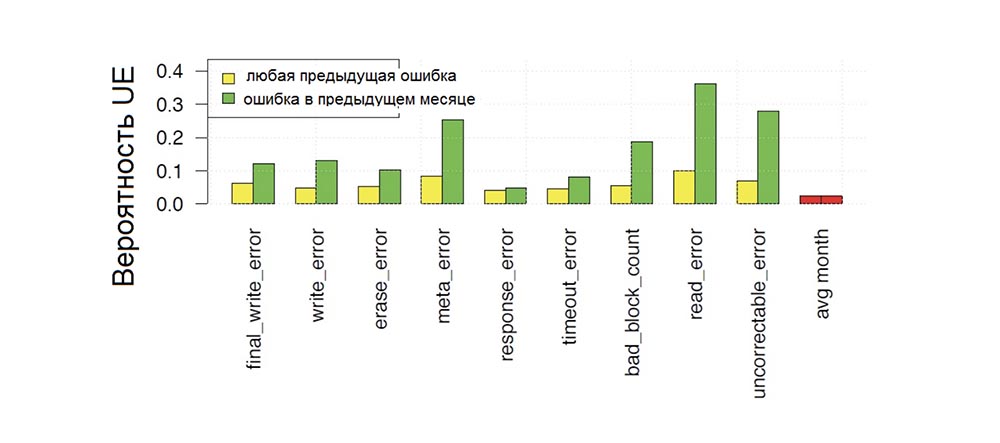
Fig. 7. The monthly probability of occurrence of uncorrectable drive errors as a function of the dependence on the presence of previous errors of various types.
Thus, previous errors, in particular previous uncorrectable errors, increase the chance of the subsequent occurrence of uncorrectable errors by more than an order of magnitude.
6. Hardware Failures
6.1. Damaged blocks
A block is a memory section in which erase operations are performed. In our study, we distinguish between blocks that were damaged in the field and blocks that already had factory damage when the drives were delivered to users.
In our study, the drives declared the block damaged after the final error of reading, writing or erasing, and accordingly reassigned it (that is, the block was excluded from further use and any data that was placed in this block and which could be restored was redirected to another block) .

Tab. 4. Statistics on the presence of damaged blocks arising in the process of field conditions of operation, and the presence of damaged blocks arising in the manufacturing process of a disk in the factory.
The upper half of Table 4 provides statistics on damaged units in drives undergoing field trials. The top line shows the proportion of drives with damaged blocks for each of the 10 drive models, the average shows the average number of damaged blocks for those drives that contain damaged blocks, the bottom line shows the average number of damaged blocks among disks with damaged blocks.
We considered only drives that were put into production at least four years ago, and only those damaged blocks that arose during the first 4 years of field testing. The lower half of the table gives statistics on drives in which there were damaged blocks that arose during factory manufacture.
6.1.1. The occurrence of damaged units in the field
We concluded that damaged blocks are a frequent occurrence: in the field, depending on the model, they are found in 30-80% of disks. The study of cumulative distribution function (CDF) for the number of damaged drive blocks showed that most disks with damaged blocks have only a small number of such blocks: the median number of bad blocks for disks with damaged blocks varies from 2 to 4. Depending on the model, however blocks of a drive is more than a median number, then usually it is much more. This phenomenon is illustrated in Figure 8.

Fig. 8. Figure showing an increase in the number of damaged blocks depending on the number of initially damaged blocks.
Figure 8 shows how the median number of damaged drive blocks develops with an increase in the number of already damaged blocks. The blue line corresponds to the MLC models, the red dotted lines correspond to the SLC models. In particular, for MLC drives, we observe a sharp increase in the number of damaged blocks after the second detected damaged block, while the median number jumps to 200, that is, 50% of disks with 2 damaged blocks are found, over time 200 or more damaged blocks occur.
As long as we don’t have access to error counting at the chip level, the damaged blocks are considered to be hundreds, probably due to failures of the chip itself, so Figure 8 indicates that after the appearance of several damaged blocks, there is a high chance of an entire chip failing. This result can serve as a potential opportunity for predicting chip failures if you rely on previous calculations of bad blocks and take into account other factors such as age, workload, and PE cycles.
In addition to determining the frequency of occurrence of bad blocks, we are also interested in finding out how damaged blocks are detected - during write or erase operations, when a block failure is invisible to the user, or when a final read error occurs that is visible to the user and creates the risk of data loss. Although we do not have data on individual block failures and how they were detected, we can refer to the observed frequencies of various types of errors that indicate a block failure. Returning to Table 2, we see that for all models, the frequency of erasure errors and write errors is lower than for final read errors, that is, most of the damaged blocks are detected as a result of the occurrence of opaque errors, namely during read operations.
6.1.2. Damaged units in the factory
Above, we examined the dynamics of the occurrence of bad blocks in the field. Here we note that almost all disks (> 99% for most models) contained factory defects in the form of damaged blocks, and their number varies greatly between models, starting from the median number less than 100 for 2 SLC models, and ending with a more typical value of more than 800 for other models. The distribution of factory damaged blocks corresponds to the normal distribution, while the average and median values are close in value. Interestingly, the number of factory damaged units to some extent predicts the appearance of other drive problems in the field. For example, we noticed that for all drive models, except for one, 95% of drives with factory bad blocks have a higher proportion of new damaged blocks in the field and a higher proportion of final write errors than the average disk of the same models. They also have a higher share of the development of certain types of reading errors (either final or non-final). Disks in the 5% percentile have a share of timeout errors below the average. Thus, we came to the following conclusions regarding bad blocks: block damage is a fairly common occurrence observed in 30-80% of drives that have at least one such block. In this case, there is a strong dependence: if the disk contains at least 2-4 damaged blocks, there is a 50% chance that hundreds of damaged blocks will follow. Almost all disks come with factory damaged blocks, which gives reason to predict their development in the field, as well as the development of some other types of errors.
6.2. Damaged memory chips
In our study, it is believed that the disk chip failed if more than 5% of the blocks failed, or if the number of disk errors during the last time interval exceeded the limit value. Some factory flash drives contain a spare chip, so if one chip fails, the drive uses the second. In our study, drives had the same function. Instead of working on a spare chip, damaged memory chips were excluded from further use, and the drive continued to work with reduced performance on the remaining chips.
The first line of Table 5 shows the prevalence of damaged chips. We see that 2-7% of drives have chip failures during the first four years of operation. Those drives that do not have a mechanism for mapping damaged chips require repair and are returned to the manufacturer.

Tab. 5. The share of various models of disks with faulty chips that require repair and are replaced during the first 4 years of field trials.
We also examined the symptoms that cause the chip to be marked as faulty: in all models, about two-thirds of the chips are marked damaged after 5% of the damaged blocks are formed, and one-third of the chips are marked failed after reaching the limit of days with errors.
We noticed that suppliers of all flash memory chips for these drives gave a guarantee that the number of damaged blocks per chip would not exceed 2% until the limit of PE cycles was reached. Consequently, two-thirds of faulty chips, in which more than 5% of the blocks failed, do not meet the manufacturer's warranty.
6.3. Repair and replacement of drives
The drive must be replaced or repaired if problems arise that require the intervention of technical personnel. The second row of Table 5 shows the percentage of disks that required repair at some point in time during the first 4 years of operation. We observe significant differences in the repair needs of discs of various models. While for most models only 6–9% need repair at some point in time, some drive models, such as SLC-B and SLC-C, require repair in 30% and 26% of cases, respectively. Looking at the relative frequency of repairs, that is, the ratio of the days of operation of the drive to the number of repair cases, the third row of Table 5), we observe a range from a couple of thousand days between repair events for the worst models to 15,000 days between repairs for the best models.
We also examined the frequency of repeated repairs: during the entire period of operation, 96% of disks undergo only 1 repair. A study of the fleet of operating disks showed that approximately 5% of the drives were constantly replaced within 4 years from the date of commissioning (fourth row of Table 5), while among the worst models (MLC-B and SLC-B), about 10% of drives. Among the replaced disks, about half went for repair, and it was understood that at least half of all repairs would be successful.
7. Comparison of MLC, eMLC and SLC - drives
Actuators like eMLC and SLC attract the consumer market at a higher price. Besides the fact that they are characterized by the highest endurance, that is, a high number of rewriting cycles, customers consider that such products of the highest segment of SSD are characterized by general reliability and durability. In this section of the article, we tried to evaluate the fairness of this opinion.
Returning to Table 3, we see that this opinion is true in relation to SLC disks relative to RBER, since this coefficient is an order of magnitude lower than that of MLC and eMLC technology drives. However, tables 2 and 5 show that SLC disks do not have the best reliability: the frequency of their replacement and repair, as well as the frequency of opaque errors are not lower than similar indicators of drives made using other technologies.
EMLC drives show higher RBERs than MLCs, even though the lower RBERs for MLC drives can be up to 16 times higher in the worst case. However, it is possible that these differences occur due to less lithography than other technological differences. Based on the above observations, we conclude that SLC drives are usually no more reliable than MLC drives.
8. Comparison with HDD
The obvious question is how the reliability of flash drives compares with the reliability of their main competitors - HDDs.
We find that when it comes to the frequency of replacing disks, flash drives win. According to previous studies conducted in 2007, about 2-9% of the total number of HDDs is replaced annually, which is significantly more than 4-10% of SSDs replaced over 4 years after the start of operation. However, flash drives are less attractive when it comes to error rates. More than 20% of flash drives develop unrecoverable errors during 4 years of operation, damaged blocks appear in 30-80%, and chips fail in 2-7%. Data from one of the 2007 research papers indicate the emergence of damaged sectors in only 3.5% of HDDs over 32 months. This is a fairly low number, but given that the total number of HDD sectors is an order of magnitude greater than the number of blocks or chips of SSDs, and these sectors are smaller than blocks, the worst characteristics of SSDs do not seem so serious.
In general, we came to the conclusion that flash drives require replacement much less frequently within their normal service life than hard drives. On the other hand, compared to HDDs, SSDs have more uncorrectable errors.
9. Other studies in this area
There is a large amount of research on the reliability of flash chips based on controlled laboratory experiments with a small number of chips, aimed at identifying trends in the occurrence of errors and their sources. For example, some of the early works of 2002-2006 studied the preservation, programming, and violation of the read operations of flash chips, and in some recent works, trends in the appearance of errors in the latest MLC chips are studied. We were interested in the behavior of flash drives in the field, so the results of our observations sometimes differ from the results of previously published studies. For example, we believe that RBER is not a reliable indicator of the likelihood of uncorrectable errors and that RBER grows with PE cycles linearly and not exponentially.
There is only one recently published field study of flash memory errors based on data collected on Facebook - “Large-scale study of flash memory failures in the field” (MEZA, J., WU, Q., KUMAR, S., MUTLU, O. “A large-scale study of flash memory failures in the field.” In Proceedings of the 2015 ACM SIGMETRICS International Conference on Measurement and Modeling of Computer Systems, New York, 2015, SIGMETRICS '15, ACM, pp. 177–190 ) This and our research complement each other, since they overlap very little.
The Facebook research data consists of one quick look at the fleet of flash media, consisting of very young (in terms of their use compared to the limit of PE cycle values) disks, and contains information only about fatal errors, while our research is based on time intervals covering the entire disk life cycle and includes detailed information about various types of errors, including correctable errors, various types of hardware failures, as well as drives of various technologies (MLC, eMLC, SLC). As a result, our study covers a wider range of error and failure modes, including the effect of wear on the entire life cycle.
On the other hand, the Facebook study takes into account the role of some factors (temperature, bus power consumption, use of the DRAM buffer) that we did not take into account.
Our studies intersect only in two small points, and in both cases we come to slightly different conclusions:
- a Facebook study examined the frequency of occurrence of uncorrectable errors, and these errors are studied as a function of disk usage. The authors of the study observe a significant “infant mortality” of the drives, which they call “early detection” and “early failure”, while we do not. The differences in the results can be explained both by testing the drives in the two companies, which could affect the picture of “child mortality”, and by the fact that the Facebook research is more focused on the early stage of disk life (without considering key points after a couple of hundred PE cycles for disks whose PE limit is measured in tens of thousands). Our research is more macroscopic in nature and covers the entire life of the drive;
- A Facebook study concludes that reading violation errors do not have a significant impact. Our view of errors of this type is more differentiated, showing that reading disruption does not create uncorrectable errors and that reading disruption errors occur with a high enough frequency to affect the RBER in the field.
10. Conclusions
This article presents a number of interesting findings regarding the reliability of flash memory in the field. Some of them are consistent with generally accepted assumptions and expectations, but most of the conclusions are unexpected. Below we present conclusions based on the results of our study.
- In 20 - 63% of disks, at least one unrecoverable error occurs during the first four years of operation, and the most common non-correctable unrecoverable errors are two to 6 days out of 1000 days of disk operation.
- In most days of disk operation, at least one correctable error occurs, but other types of transparent errors, that is, errors that are not visible to the user, are rare compared to opaque errors.
- We find that the standard RBER metric as an indicator of disk reliability is not a good enough way to predict the failures that occur in practice. In particular, a higher RBER does not necessarily result in a high frequency of uncorrectable errors.
- We believe that the standard metric for measuring UBER fatal errors is not objective enough, since we did not see the relationship between the UE and the number of readings. Because of this, normalization of uncorrectable errors by the number of read bits will artificially increase the error rate for disks with a low number of read operations.
- Both RBER and the number of uncorrectable errors increase with the growth of PE cycles, but growth rates lower than expected occur linearly and not exponentially, while there are no sharp jumps when the disk exceeds the limit of the number of PE cycles established by the manufacturer for operating conditions.
- While wear and tear during disk operation is often the focus of attention, we note that regardless of the age of the drive, time spent in the field affects the reliability of the disk.
- SLC drives that target the corporate market and belong to the higher product segment are no more reliable than MLC drives that belong to the lower segment of SSDs.
- We noticed that chips with a smaller lithography size tend to have higher RBER values, but this is not necessarily related to the highest frequency of opaque errors, for example, uncorrectable errors.
- Although SSDs require a rarer replacement than HDDs, they have a higher incidence of problems that can affect the user, for example, the frequency of uncorrectable errors.
- Previous errors of various types make it possible to predict the occurrence of fatal errors in the future. We are currently conducting a study on how standard machine learning methods can accurately predict the occurrence of uncorrectable errors depending on the age of the disk and the presence of previous errors.
- The spread in the damage frequency of blocks and chips is quite significant: depending on the model, at least one bad block appears in 30-80% of drives and at least one faulty chip is detected in 2-7% in the first four years of operation. The latter circumstance emphasizes the importance of marking (mapping) mechanisms for damaged chips; otherwise, disks with damaged chips will be sent for repair or back to the manufacturer.
- As a rule, disks either have a pair of damaged blocks, or vice versa, there are too many of them, which suggests that the upcoming chip failure can be predicted based on the previous number of damaged blocks (and, possibly, taking into account some other factors). Note that a drive with a large initial number of factory damaged blocks has a higher probability of a larger number of damaged blocks in the field, and is also more prone to certain types of errors.
Thank you for staying with us. Do you like our articles? Want to see more interesting materials? Support us by placing an order or recommending it to your friends, a 30% discount for Habr users on a unique analog entry-level server that we invented for you: The whole truth about VPS (KVM) E5-2650 v4 (6 Cores) 10GB DDR4 240GB SSD 1Gbps from $ 20 or how to divide the server? (options are available with RAID1 and RAID10, up to 24 cores and up to 40GB DDR4).
Dell R730xd 2 times cheaper? Only we have 2 x Intel TetraDeca-Core Xeon 2x E5-2697v3 2.6GHz 14C 64GB DDR4 4x960GB SSD 1Gbps 100 TV from $ 199 in the Netherlands! Dell R420 - 2x E5-2430 2.2Ghz 6C 128GB DDR3 2x960GB SSD 1Gbps 100TB - from $ 99! Read about How to Build Infrastructure Bldg. class c using Dell R730xd E5-2650 v4 servers costing 9,000 euros for a penny?