How not to drown in routine, or Our experience of comparing AWR dumps during stress testing
Hello! My name is Lyudmila, I am engaged in load testing, I want to share how we performed the automation of the comparative analysis of the regression profile of the load testing of the system from the database under the Oracle DBMS together with one of our customers.
The purpose of the article is not to discover a “new” approach to comparing database performance, but to describe our experience and attempt to automate the comparison of the results obtained and
Reduce calls to Oracle DBAs.

Carrying out load testing of any database, we are primarily interested in:
Comparison of AWR reports alone is not enough to achieve your goals.
Centralized storage of AWR dumps is also good practice. AWR dumps retain all historical views (dba_hist).
This practice has already been applied by our client.
After the next session of load testing, we compare the results:
Why is this needed?
The goals are different:
To achieve all these goals, we often solve the problem of comparing different dumps between each other. Dates are usually very tight when they were supposed to be introduced yesterday! The time to fully check each regression test is sorely lacking. And if you run a reliability test for a day, then you can spend a lot of time analyzing the result ...
Of course, you can watch everything online in Enterprise Manager (or with requests to gv $ views) during the test: do not go to smoke, eat and sleep ...

Perhaps you also have your own custom tool, made for yourself? You can share in the comments. And we will share what we use for our tasks.
AWR reports have a lot of useful information:

There is useful information here, for example: how much the query is executing, sql_id, module and abbreviated text. Although the text is there, it is truncated and the full version can be taken from the Complete List of SQL Text paragraph.
As for the minuses: in the AWR report it is not clear when these requests occurred, at what point there were more, and at what less ... After all, to analyze the test results, understanding what happened and at what approximately moment is important: evenly for the whole test or peak / surge as if on a schedule. We will also see only a limited top here. This can be viewed more easily by querying historical tables.
Here you can see what events were during the test. The data in this section is ordered by DB time.
For me in this section the following information is missing:
To compare the two tests, you can use the comparison of AWR reports:
Hooray, here we have wait_class displayed; otherwise the minuses are the same as described above.
Sometimes there is no Enterprise Manager on projects, and you can, for example, use Enterprise Manager Express or ASH Viewer. In Enterprise Manager, many use Top Activity for historical data, but for me, many things are easier to look at with the queries themselves. All of the above should be compared with other tests / workload. We already had a custom comparison in terms of runtime, but there wasn’t any events, and we checked manually with queries on historical tables.
After each regression test, we had to compare the results in historical tables with queries to the database, look at AWR reports, localize the problematic wait (on which module it occurred, what time it happened, on which object it hung), so that as a result a bug was generated for the right development team.
The customer’s database has reached 190 Tb, a huge number of requests are processed in the system: the number of parallel modules is 16237.
And then I had an idea how to simplify the process of comparing AWR dumps. With this idea, I went to Fred . Together, we created a convenient portal.
At first, the statement of the problem from me looked like this:
Then, nevertheless, I decided to systematize for a start what queries to historical tables I most often use ... Fred began to fasten this to the portal and then it started ...
First of all, I was interested in a comparison of events, since a comparison of the speed of query execution in some form already existed. The next step I needed detailed information about each event: for example, if the event is index contention, then you need an understanding of which index we are actually hanging on.
Further, I was interested in what time moments of these events were the most, since in the implementation there were many tasks (jobs) that were carried out according to a schedule and it was necessary to understand at what approximately time moment everything was cracking at the seams.
In general, here is what I wanted to get:
Fred and I made a portal convenient for our use for comparing AWR dumps of load testing, which I will discuss in more detail below.
So, AWR dumps are created in the system, which are poured into the database and compared on the portal.
We used the following stack:
The portal interface looks like this:

On the portal you can choose the types of compared dumps, test test or test-prom.
Each dump has its own unique identifier - DBID.
You can also filter by the following parameters:
You select dumps at the top left, and you can set the necessary filters on the right to immediately select the desired module - this allows you to pinpoint problems in the functionality that has been changed / improved so that there are no problems with degradation in the previous version.
The table in the middle is the result of comparing the dumps. The column headings immediately show what data is being output. The two right columns show the differences between the two dumps:
It’s immediately obvious how well we tested. If the event occurred very often, then most likely:
If we have a new event - yellow - then this indicates some kind of change in the system, and we need to analyze its consequences. Here you can see the distribution of events by snapshots and display detailed information about the wait.
Once there was a case: a new event was discovered that was quite rare and was not included in the top events, but because of it there were slowdowns in the functionality, which had critical SLAs. Analysis of only the top queries in the AWR report could not reveal this.
For each request, you can get more detailed information:
For each entry, you can also see the following information:
The system views of Oracle are involved in comparing the results:
DBA_HIST_ACTIVE_SESS_HISTORY, DBA_HIST_SEG_STAT, DBA_HIST_SNAPSHOT, DBA_HIST_SQLTEXT
+
V_DUMPS_LOADED - its own service table (has already been implemented by the customer), it contains information about the downloaded dumps.
A few queries:
Distribution of events on pictures:
Grouping by module (modules that are a single logical group are combined into it), the object being blocked:
The portal allowed us to save time comparing AWR dumps. The manual comparison took 4-6 hours, and now we spend 2-3 hours. We always have at hand the opportunity to quickly compare the results of different tests both among themselves and with an industrial dump, as well as set the filters we need now. That is, we can conveniently compare historical data among ourselves, and not just watch the current result online.
Previously, after each regression, it was necessary to compare the results in historical tables with queries to the database, view AWR reports, localize the problematic expectation (on which module it occurs, what times it happened, what object it hung on), so that in the end it could lead to a defect on the right development team. And now just select the dumps for comparison, set the filters - and the results of the comparison are immediately ready. You can also send developers a link to the portal indicating the DBID of the test dump, and they themselves will be filtered by their module.
It took only two weeks to create the portal, because one part of it was already ready: loading dumps into the database. Of course, such a portal solution is not needed for any project with an Oracle base. It is useful for products that are divided into numerous modules with different names. For simple systems or for systems in which they did not attach importance to filling in the module, the portal will be redundant.
Since the portal analyzes images that are taken once in a certain period, the portal does not completely exempt from online monitoring of the database, as some events may not be able to get into the image.
This is a convenient tool for analyzing historical data based on testing results, but it can be useful in other situations when a lot of pictures are created and large volumes of data need to be checked. Thanks to the combination of filters and graphs, you can immediately see bursts of events that in normal AWR reports (not to be confused with dumps) will be hidden in the grouped information. It is enough to select dumps for comparison, set filters - and the comparison results are immediately ready, or you can send a link to the developers on the portal with the DBID of the test dump, they themselves will be filtered by their module.
If you decide to develop a similar portal for your project, then select the set of filters that is right for you. If you filter according to different conditions each time, then it will be much easier to make an appropriate filter for this.
The resulting solution can still be finalized, for example:
Or, in general, tell the portal to connect to the tested database so that it builds online similar pictures using in-memory views, and not just historical data. And save them to your database.
We have been using the portal for more than a year. Fred, thank you very much!
Posted by Lyudmila Matskus,
Jet Infosystems
The purpose of the article is not to discover a “new” approach to comparing database performance, but to describe our experience and attempt to automate the comparison of the results obtained and
Reduce calls to Oracle DBAs.
Carrying out load testing of any database, we are primarily interested in:
- Did something break after installing a new assembly?
- The dynamics of the database during the test.
Comparison of AWR reports alone is not enough to achieve your goals.
Centralized storage of AWR dumps is also good practice. AWR dumps retain all historical views (dba_hist).
This practice has already been applied by our client.
After the next session of load testing, we compare the results:
- current test dump with industrial dump;
- the current test dump with the previous test dump.
Why is this needed?
The goals are different:
- Sometimes, filling the base itself in a test environment is different from the operational one, which means there will be differences that interfere with the analysis ("interference" to answer the main question, "have something broken?"). I want to identify these differences;
- Comparison of the current test with the work of the industrial base helps to understand how correct the current load tests are (somewhere we load too much, but we forgot about something at all);
- Comparing the current test with the previous test helps to understand whether the current system behavior is normal. Has anything changed in the behavior of the system compared to the previous test.
To achieve all these goals, we often solve the problem of comparing different dumps between each other. Dates are usually very tight when they were supposed to be introduced yesterday! The time to fully check each regression test is sorely lacking. And if you run a reliability test for a day, then you can spend a lot of time analyzing the result ...
Of course, you can watch everything online in Enterprise Manager (or with requests to gv $ views) during the test: do not go to smoke, eat and sleep ...
Perhaps you also have your own custom tool, made for yourself? You can share in the comments. And we will share what we use for our tasks.
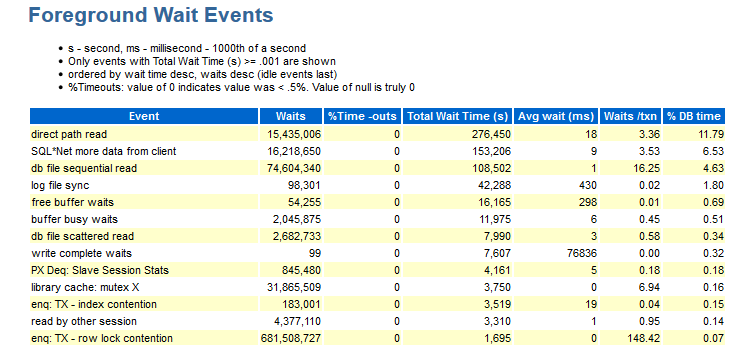
AWR reports have a lot of useful information:
There is useful information here, for example: how much the query is executing, sql_id, module and abbreviated text. Although the text is there, it is truncated and the full version can be taken from the Complete List of SQL Text paragraph.
As for the minuses: in the AWR report it is not clear when these requests occurred, at what point there were more, and at what less ... After all, to analyze the test results, understanding what happened and at what approximately moment is important: evenly for the whole test or peak / surge as if on a schedule. We will also see only a limited top here. This can be viewed more easily by querying historical tables.
Here you can see what events were during the test. The data in this section is ordered by DB time.
For me in this section the following information is missing:
- Wait_class (yes, you remember with experience what type of expectations this event belongs to).
- Distributions by modules (if I see, for example, waiting for enq: TX - row lock contention: information is needed, under which module this happened).
There are jobes in which there are numbers that do not carry a semantic part, that is, you need to group the same modules and get an answer for the group, for example: module_A_1, module_A_2, module_A_3 and module_B_1, module_ B_2, module_ B_3. That is, there were two semantic modules, but they all have different names.
- The object to which we are referring (CURRENT_OBJ # - if, for example, an event occurs enq: TX - index contention, it would be nice to know which index is to blame).
- Sql_id - which request the text of this request tried to execute.
- Information on the distribution of quantities per snapshot (as described above ...).
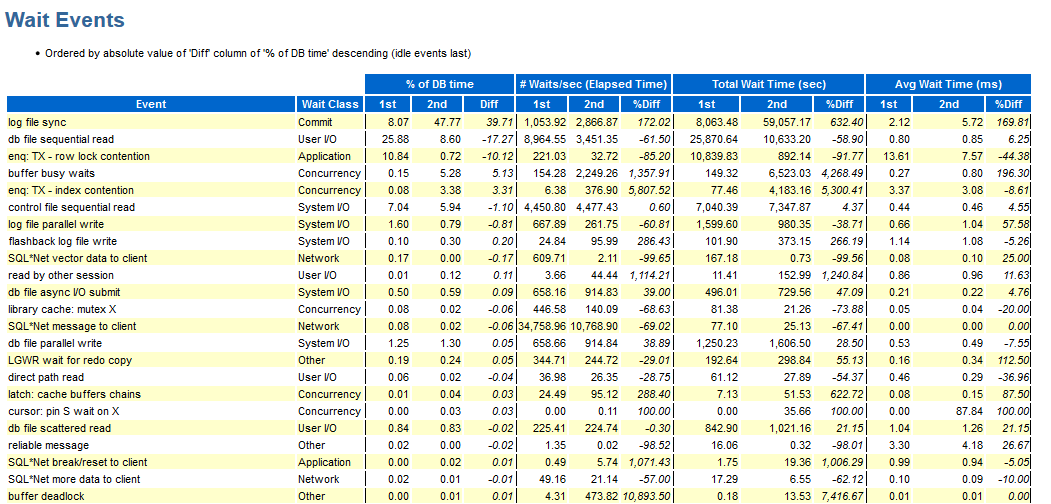
To compare the two tests, you can use the comparison of AWR reports:
Hooray, here we have wait_class displayed; otherwise the minuses are the same as described above.
Sometimes there is no Enterprise Manager on projects, and you can, for example, use Enterprise Manager Express or ASH Viewer. In Enterprise Manager, many use Top Activity for historical data, but for me, many things are easier to look at with the queries themselves. All of the above should be compared with other tests / workload. We already had a custom comparison in terms of runtime, but there wasn’t any events, and we checked manually with queries on historical tables.
After each regression test, we had to compare the results in historical tables with queries to the database, look at AWR reports, localize the problematic wait (on which module it occurred, what time it happened, on which object it hung), so that as a result a bug was generated for the right development team.
The customer’s database has reached 190 Tb, a huge number of requests are processed in the system: the number of parallel modules is 16237.
And then I had an idea how to simplify the process of comparing AWR dumps. With this idea, I went to Fred . Together, we created a convenient portal.
At first, the statement of the problem from me looked like this:
Then, nevertheless, I decided to systematize for a start what queries to historical tables I most often use ... Fred began to fasten this to the portal and then it started ...
First of all, I was interested in a comparison of events, since a comparison of the speed of query execution in some form already existed. The next step I needed detailed information about each event: for example, if the event is index contention, then you need an understanding of which index we are actually hanging on.
Further, I was interested in what time moments of these events were the most, since in the implementation there were many tasks (jobs) that were carried out according to a schedule and it was necessary to understand at what approximately time moment everything was cracking at the seams.
In general, here is what I wanted to get:
- quantitative comparison of events between different tests (without additional squats);
- all the related information I need for analysis: sql_id, query text, distribution during the test, which object the sessions referred to, module;
- convenient filters for yourself to see what they changed;
- GUI GUI, everything is so colorful that it is immediately visible (you can screen interested parties from the development side)
- grouping of modules: as previously described, 16237 modules, but, from the point of view of the functions performed, many times less.
Fred and I made a portal convenient for our use for comparing AWR dumps of load testing, which I will discuss in more detail below.
About the portal
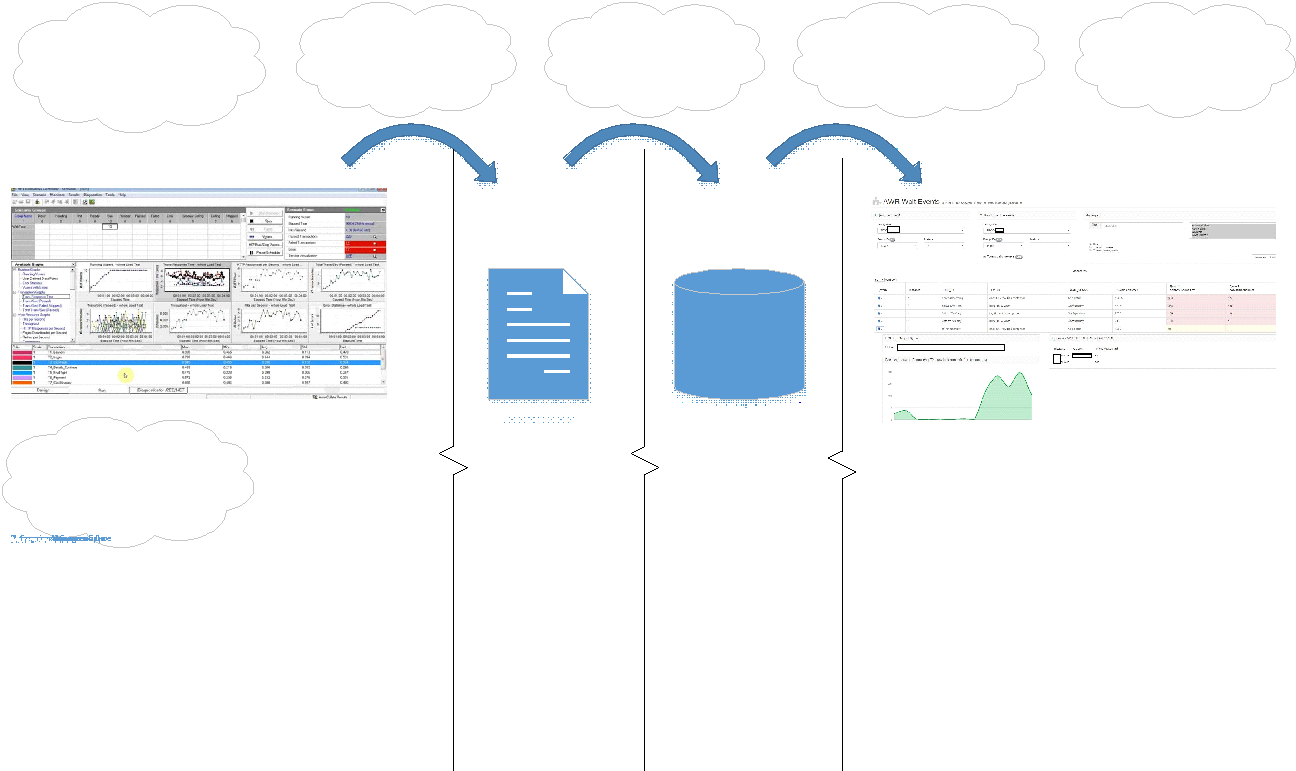
So, AWR dumps are created in the system, which are poured into the database and compared on the portal.
We used the following stack:
- Oracle DB - for storing AWR dumps
- Python 2+
The portal interface looks like this:
On the portal you can choose the types of compared dumps, test test or test-prom.
Each dump has its own unique identifier - DBID.
You can also filter by the following parameters:
- Instance (instance) - we had a cluster database;
- Request (Sql_id);
- Type of wait (Wait_Class);
- Event
You select dumps at the top left, and you can set the necessary filters on the right to immediately select the desired module - this allows you to pinpoint problems in the functionality that has been changed / improved so that there are no problems with degradation in the previous version.
The table in the middle is the result of comparing the dumps. The column headings immediately show what data is being output. The two right columns show the differences between the two dumps:
- events highlighted in red are more than in comparison with a comparative dump for snapshot;
- yellow - new events;
- green - events that were already in the original dump.
It’s immediately obvious how well we tested. If the event occurred very often, then most likely:
- overloaded the system;
- or the conditions for the execution of background jobs changed and the event began to play more often. Once in this way an error was found in the code: the event occurred constantly, and not on the desired condition branch.
If we have a new event - yellow - then this indicates some kind of change in the system, and we need to analyze its consequences. Here you can see the distribution of events by snapshots and display detailed information about the wait.
Once there was a case: a new event was discovered that was quite rare and was not included in the top events, but because of it there were slowdowns in the functionality, which had critical SLAs. Analysis of only the top queries in the AWR report could not reveal this.
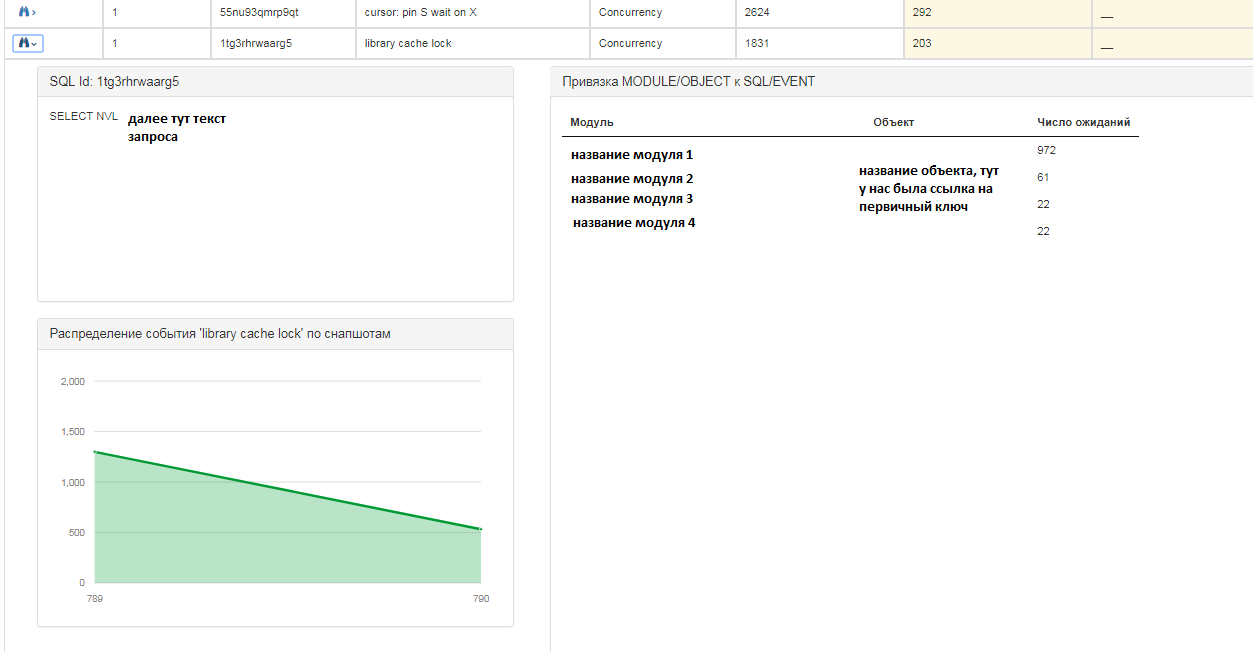
For each request, you can get more detailed information:
For each entry, you can also see the following information:
- query sql text;
- the distribution of events on a snapshot in a quantitative ratio, i.e. at what point in time there were more / less events;
- on which modules and objects waiting hung.
The system views of Oracle are involved in comparing the results:
DBA_HIST_ACTIVE_SESS_HISTORY, DBA_HIST_SEG_STAT, DBA_HIST_SNAPSHOT, DBA_HIST_SQLTEXT
+
V_DUMPS_LOADED - its own service table (has already been implemented by the customer), it contains information about the downloaded dumps.
A few queries:
Distribution of events on pictures:
SELECT S.SNAP_ID, COUNT(*) RCOUNT FROM DBA_HIST_ACTIVE_SESS_HISTORY S, V_DUMPS_LOADED V. WHERE V.ID = :1 AND S.DBID = V.DBID AND S.INSTANCE_NUMBER = :2 AND S.SQL_ID = :3 AND S.EVENT_ID = :4 GROUP BY S.SNAP_ID ORDER BY S.SNAP_ID ASC
Grouping by module (modules that are a single logical group are combined into it), the object being blocked:
SELECT MODULE, OBJECT_NAME, COUNT(*) RCOUNT (SELECT CASE (WHEN INSTR(S.MODULE, ' 1')>0 THEN ' 1' WHEN INSTR(S.MODULE, ' 2')>0 THEN ' 2' … ELSE S.MODULE END) MODULE, O.OBJECT_NAME FROM DBA_HIST_ACTIVE_SESS_HISTORY S, V_DUMPS_LOADED V, DBA_HIST_SEG_STAT O WHERE V.ID = :1 AND S.DBID = V.DBID AND S.INSTANCE_NUMBER = :2 AND S.SQL_ID = :3 AND S.EVENT_ID = :4 AND S.CURRENT_OBJ# = O. OBJ# (+) AND V. DBID = O.DBID ) GROUP BY MODULE, OBJECT_NAME ORDER BY RCOUNT DESC
What did you get in the end?
The portal allowed us to save time comparing AWR dumps. The manual comparison took 4-6 hours, and now we spend 2-3 hours. We always have at hand the opportunity to quickly compare the results of different tests both among themselves and with an industrial dump, as well as set the filters we need now. That is, we can conveniently compare historical data among ourselves, and not just watch the current result online.
Previously, after each regression, it was necessary to compare the results in historical tables with queries to the database, view AWR reports, localize the problematic expectation (on which module it occurs, what times it happened, what object it hung on), so that in the end it could lead to a defect on the right development team. And now just select the dumps for comparison, set the filters - and the results of the comparison are immediately ready. You can also send developers a link to the portal indicating the DBID of the test dump, and they themselves will be filtered by their module.
It took only two weeks to create the portal, because one part of it was already ready: loading dumps into the database. Of course, such a portal solution is not needed for any project with an Oracle base. It is useful for products that are divided into numerous modules with different names. For simple systems or for systems in which they did not attach importance to filling in the module, the portal will be redundant.
Since the portal analyzes images that are taken once in a certain period, the portal does not completely exempt from online monitoring of the database, as some events may not be able to get into the image.
This is a convenient tool for analyzing historical data based on testing results, but it can be useful in other situations when a lot of pictures are created and large volumes of data need to be checked. Thanks to the combination of filters and graphs, you can immediately see bursts of events that in normal AWR reports (not to be confused with dumps) will be hidden in the grouped information. It is enough to select dumps for comparison, set filters - and the comparison results are immediately ready, or you can send a link to the developers on the portal with the DBID of the test dump, they themselves will be filtered by their module.
If you decide to develop a similar portal for your project, then select the set of filters that is right for you. If you filter according to different conditions each time, then it will be much easier to make an appropriate filter for this.
The resulting solution can still be finalized, for example:
- comparing the duration of the request;
- comparing query plans;
- comparing requests with the same plan, but with different text;
- unloading into test reports (execution as a Word / Exel document).
Or, in general, tell the portal to connect to the tested database so that it builds online similar pictures using in-memory views, and not just historical data. And save them to your database.
We have been using the portal for more than a year. Fred, thank you very much!
Posted by Lyudmila Matskus,
Jet Infosystems
All Articles