The first three days of the life of a post on Habré
Each author is worried about the life of his publication, after the publication he looks at statistics, waits and worries for comments, wants the publication to gain at least an average number of views. At Habr, these tools are cumulative and therefore it is rather difficult to imagine how the author’s publication begins its life against the background of other publications.
As you know, the bulk of publications gaining views in the first three days. To imagine how the publication lives, I tracked the statistics and introduced a monitoring and comparison mechanism. This mechanism will be applied to this publication and everyone will be able to see how it works.
The first stage was statistics on the dynamics of publications for the first three days of the post. To do this, I analyzed the reader’s flows on publications for September 28 during their life from September 28 to October 1, 2019 by fixing the number of views at various time intervals during this period. The first diagram is presented in the figure below, it is obtained by coordinating the dynamics of views over time.
As can be calculated from the diagram, the average number of views of a publication after 72 hours with a power-law approximation function will be approximately 8380 views.
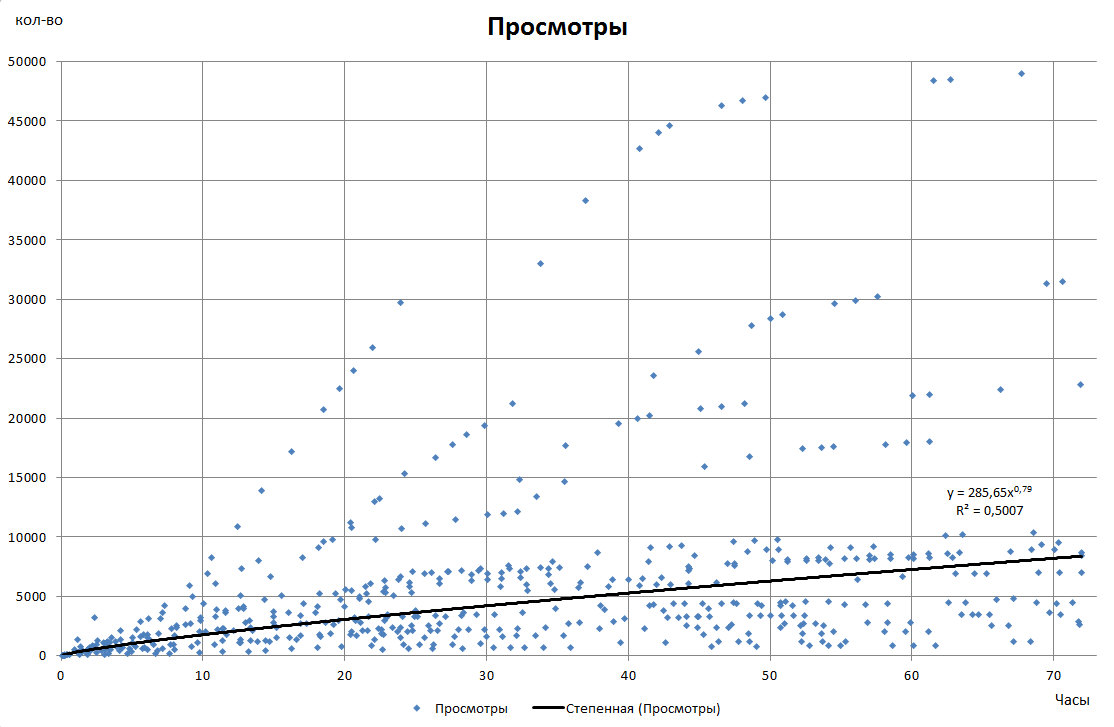
Fig. 1. Distribution of views by time, for all publications.
Since the "stars" are clearly visible, we will present this data without them for standard publication. Clipping will be carried out for those publications that scored more than the average value of views in 3 days - 10225 pcs., Figure 2.
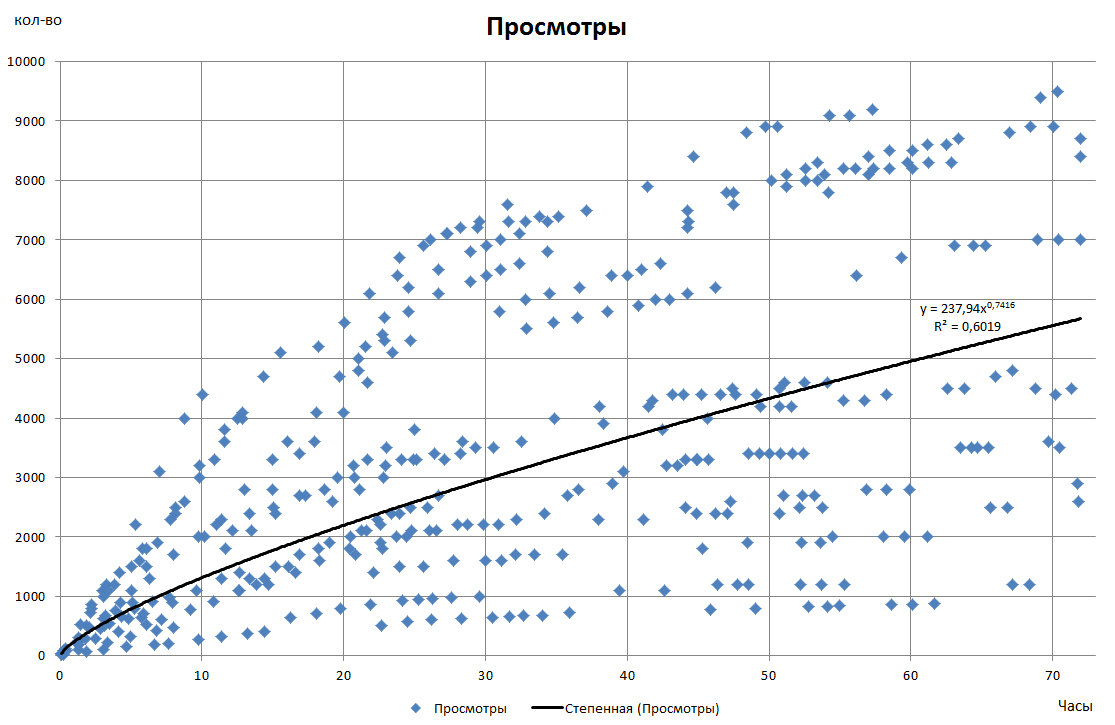
Fig. 2. Distribution of views by time, for average publications, without “stars”.
As can be calculated from the diagram, the average number of views of a publication of average demand after 72 hours is estimated by a power approximation function, approximately 5670 views.
The numbers are entertaining, but there is a tool with greater practical value. This is the average share for each time period. We define them and present them in Figure 3.
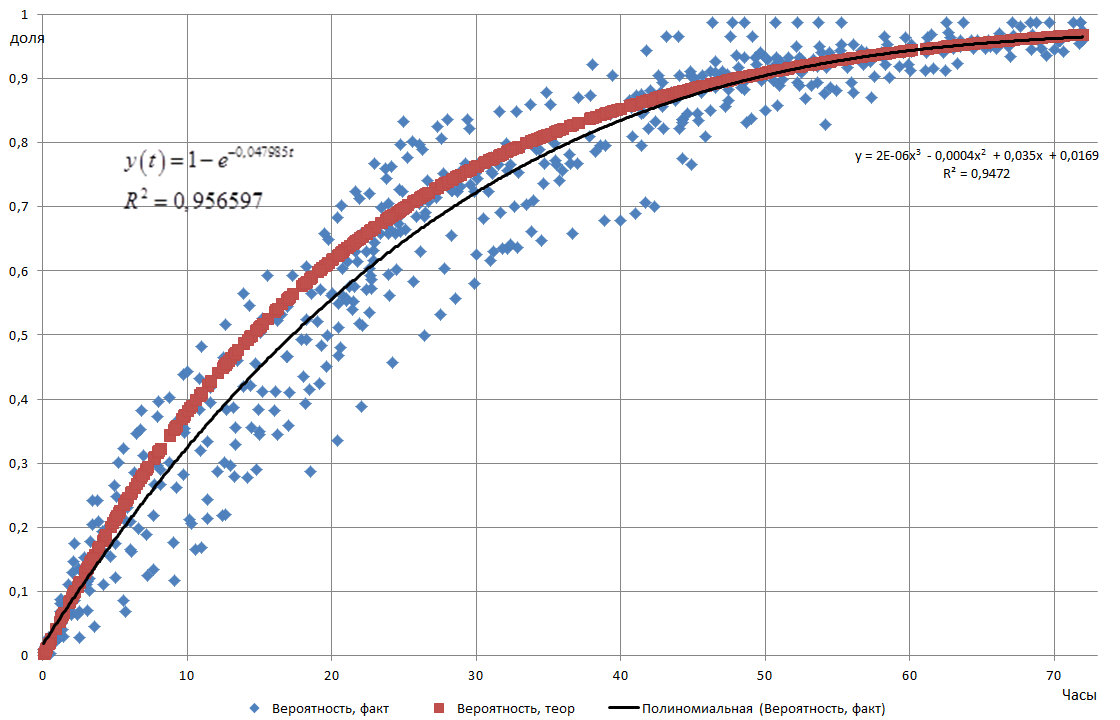
Fig. 3. The actual time distribution of the share of views of the total number of views over three days and the theoretical lines of approximation, the thin Excel polynomial and a bold proprietary solution.
I don’t see much point in conducting a separate analysis of the “star” clusters and the usual publications, since in this solution everything was considered in a standardized coordinate system, in shares.
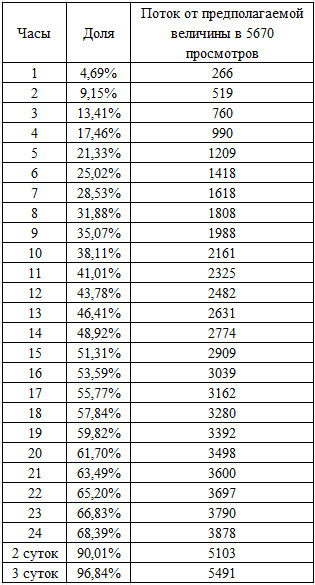
Thus, it is possible to build a table of values with fractions of time and, accordingly, to predict the total volume of views over three days.
We construct the specified table and predict the flow from this publication.
Since I will publish the post at about 0 hours on October 3, everyone can compare the flow with the predicted value. If it is less, then I’m out of luck, if more, then readers are interested.
I will try to present, as I observe, the real flow in the graph below.

Fig. 4. The actual flow of readers of this publication in comparison with the theoretical forecast.
In conclusion, I can say that each author can take for himself a guide to the calculation table, which is presented above. And by dividing the real flow of its publication at a certain moment by the value in the column for this moment, it can predict the number of readers at the end of the 3rd day. And during this period, the authors have the opportunity in one way or another to affect the readability of his material, for example, to respond more actively and in more detail in the comments. You can also compare your publication with others, understand how external publications affect readers' priorities. The only advice, please understand that these figures are based on an analysis of the stream of readers of publications of only one day, September 28, 2019.
As you know, the bulk of publications gaining views in the first three days. To imagine how the publication lives, I tracked the statistics and introduced a monitoring and comparison mechanism. This mechanism will be applied to this publication and everyone will be able to see how it works.
The first stage was statistics on the dynamics of publications for the first three days of the post. To do this, I analyzed the reader’s flows on publications for September 28 during their life from September 28 to October 1, 2019 by fixing the number of views at various time intervals during this period. The first diagram is presented in the figure below, it is obtained by coordinating the dynamics of views over time.
As can be calculated from the diagram, the average number of views of a publication after 72 hours with a power-law approximation function will be approximately 8380 views.
Fig. 1. Distribution of views by time, for all publications.
Since the "stars" are clearly visible, we will present this data without them for standard publication. Clipping will be carried out for those publications that scored more than the average value of views in 3 days - 10225 pcs., Figure 2.
Fig. 2. Distribution of views by time, for average publications, without “stars”.
As can be calculated from the diagram, the average number of views of a publication of average demand after 72 hours is estimated by a power approximation function, approximately 5670 views.
The numbers are entertaining, but there is a tool with greater practical value. This is the average share for each time period. We define them and present them in Figure 3.
Fig. 3. The actual time distribution of the share of views of the total number of views over three days and the theoretical lines of approximation, the thin Excel polynomial and a bold proprietary solution.
I don’t see much point in conducting a separate analysis of the “star” clusters and the usual publications, since in this solution everything was considered in a standardized coordinate system, in shares.
Thus, it is possible to build a table of values with fractions of time and, accordingly, to predict the total volume of views over three days.
We construct the specified table and predict the flow from this publication.
Since I will publish the post at about 0 hours on October 3, everyone can compare the flow with the predicted value. If it is less, then I’m out of luck, if more, then readers are interested.
I will try to present, as I observe, the real flow in the graph below.
Fig. 4. The actual flow of readers of this publication in comparison with the theoretical forecast.
In conclusion, I can say that each author can take for himself a guide to the calculation table, which is presented above. And by dividing the real flow of its publication at a certain moment by the value in the column for this moment, it can predict the number of readers at the end of the 3rd day. And during this period, the authors have the opportunity in one way or another to affect the readability of his material, for example, to respond more actively and in more detail in the comments. You can also compare your publication with others, understand how external publications affect readers' priorities. The only advice, please understand that these figures are based on an analysis of the stream of readers of publications of only one day, September 28, 2019.
All Articles