How we collected data on advertising campaigns from online sites (the thorny path to the product)
It seems that the field of online advertising should be as technological and automated as possible. Indeed, such giants and experts in their field as Yandex, Mail.Ru, Google and Facebook work there. But, as it turned out, there is no limit to perfection and there is always something to automate.

Source
Communication group Dentsu Aegis Network Russia is the largest player in the digital advertising market and actively invests in technology, trying to optimize and automate its business processes. One of the unresolved problems of the online advertising market was the task of collecting statistics on advertising campaigns from different online sites. The solution to this problem ultimately resulted in the creation of the D1.Digital product (read as DiVan), the development of which we want to tell.
1. At the start of the project, there was not a single finished product on the market that solved the task of automating the collection of statistics on advertising campaigns. This means that no one but ourselves will close our needs.
Services such as Improvado, Roistat, Supermetrics, SegmentStream, offer integration with sites, social networks and Google Analitycs, and also provide the ability to build analytical dashboards for convenient analysis and control of advertising campaigns. Before starting to develop our product, we tried to use some of these systems in our work to collect data from sites, but, unfortunately, they could not solve our problems.
The main problem was that the tested products were repelled from data sources, displaying statistics of placements in sections by site, and did not allow the aggregation of statistics on advertising campaigns. This approach did not allow seeing statistics from different sites in one place and analyzing the state of the campaign as a whole.
Another factor was that at the initial stages the products were oriented to the Western market and did not support integration with Russian sites. And for those sites with which the integration was implemented, all the necessary metrics with sufficient detail were not always uploaded, and the integration was not always convenient and transparent, especially when it was necessary to get something that was not in the system interface.
In general, we decided not to adapt to third-party products, but started developing our own ...
2. The online advertising market is growing from year to year, and in 2018, in terms of advertising budgets, it traditionally overtook the largest TV advertising market. So there is a scale .
3. Unlike the TV advertising market, where the sale of commercial advertising is monopolized, the mass of individual owners of advertising equipment of various sizes with their advertising offices work on the Internet. Since the advertising campaign, as a rule, runs on several sites at once, in order to understand the state of the advertising campaign, it is necessary to collect reports from all sites and bring them together into one large report that will show the whole picture. This means that there is potential for optimization.
4. It seemed to us that the owners of advertising inventory on the Internet already had an infrastructure for collecting statistics and displaying them in advertising offices, and they could provide an API for this data. So, there is a technical feasibility. We will say right away that it was not so simple.
In general, all the prerequisites for the implementation of the project were obvious to us, and we ran to implement the project ...
First, we formed a vision of an ideal system:
Considering our commitment to flexible principles of software development (agile, all things), we decided to first develop MVP and then move towards the intended goal iteratively.
We decided to build MVP on the basis of our product DANBo (Dentsu Aegis Network Board) , which is a web application with general information on the advertising campaigns of our customers.
For MVP, the project was simplified as much as possible in terms of implementation. We have selected a limited list of sites for integration. These were the main platforms, such as Yandex.Direct, Yandex.Display, RB.Mail, MyTarget, Adwords, DBM, VK, FB, and the main adserving systems Adriver and Weborama.
To access statistics on the sites through the API, we used a single account. The client group manager, who wanted to use the automatic collection of statistics on the advertising campaign, had to first delegate access to the necessary advertising campaigns on the sites to the platform account.
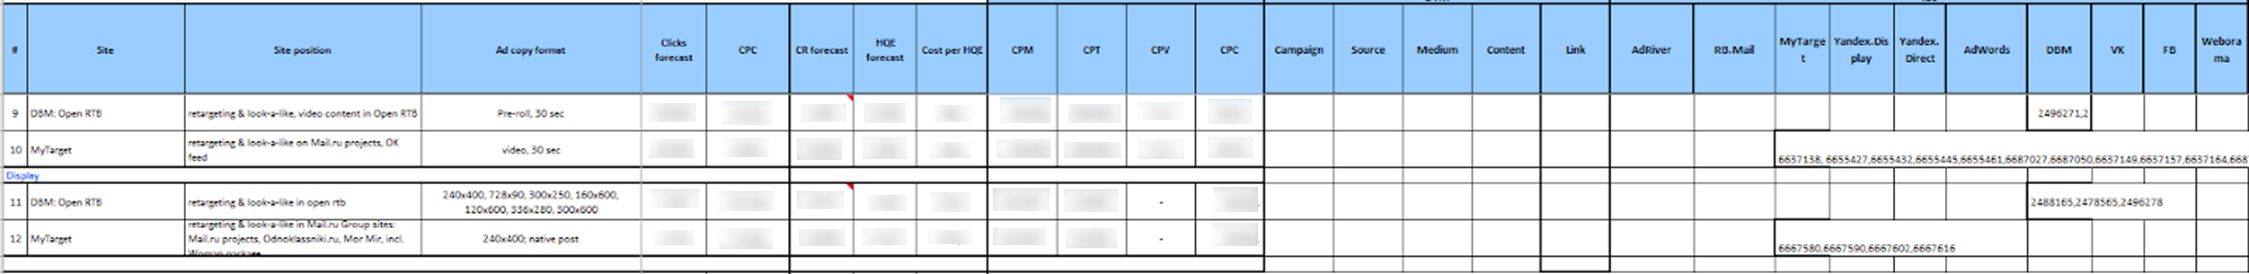
Further, the user of the DANBo system had to upload a file of a certain format to the Excel system, in which all information about the placement (advertising campaign, site, format, placement period, planned indicators, budget, etc.) and the identifiers of the corresponding advertising campaigns on the sites were written and counters in adserving systems.
It looked, frankly, terrifying:
The downloaded data was stored in a database, and then individual services collected campaign identifiers from them from the sites and downloaded statistics on them.
A separate windows service was written for each site, which once a day went under one service account in the site’s API and downloaded statistics on the specified campaign identifiers. The same thing happened with adserving systems.
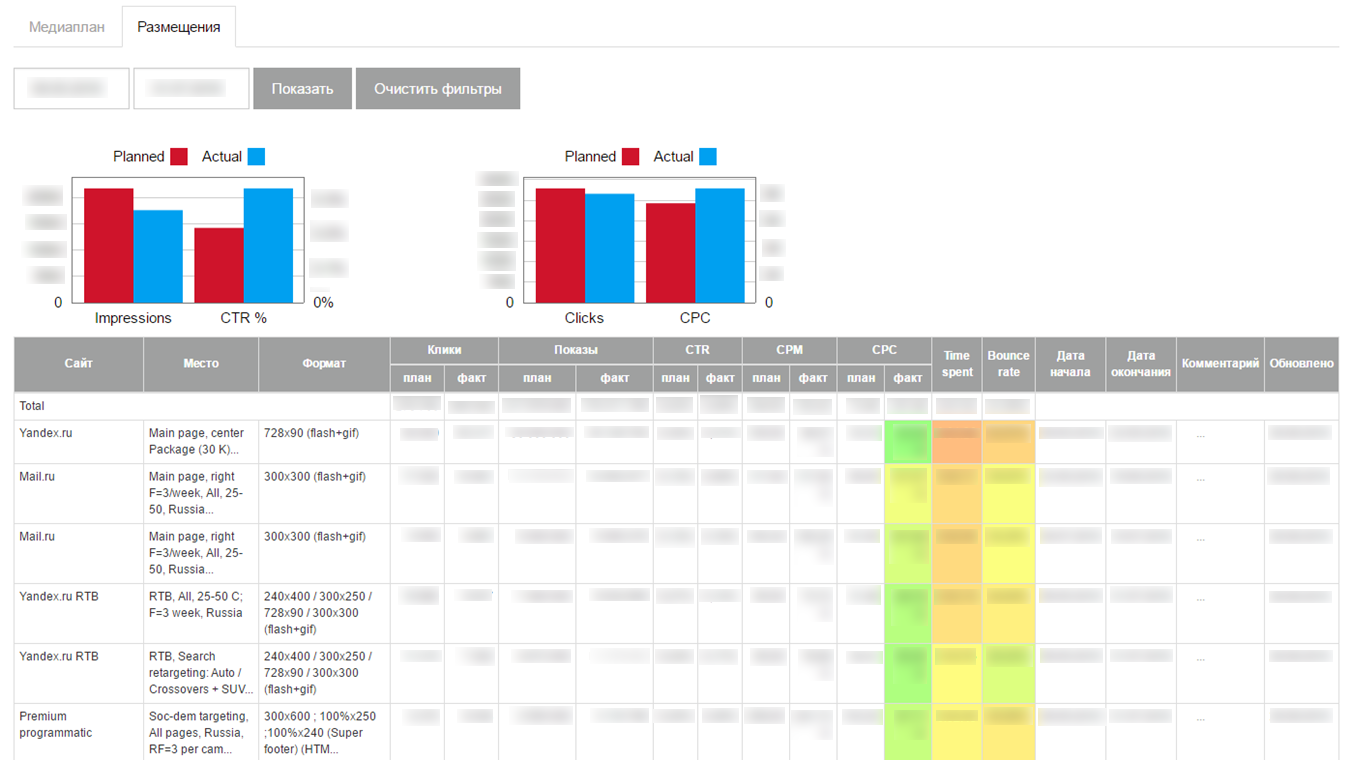
The downloaded data was displayed on the interface in the form of a small self-written dashboard:
Unexpectedly for us, MVP earned and began to download current statistics on advertising campaigns on the Internet. We implemented the system on several clients, but when we tried to scale, we ran into serious problems:
This gave us the idea that the primary source of information about the location should be our 1C system, in which all the data is entered accurately and on time (the point is that based on the 1C data, accounts are formed, therefore, the correct entry of the data in 1C is for everyone in KPI). So a new system concept appeared ...
The first thing we decided to do was to separate the system of collecting statistics on advertising campaigns on the Internet into a separate product - D1.Digital .
In the new concept, we decided to upload information on advertising campaigns and placements inside them from 1C to D1.Digital , and then pull statistics from sites and from AdServing systems to these placements. This was supposed to greatly simplify the lives of users (and, as usual, add work to developers) and reduce the amount of support.
The first problem that we encountered was of an organizational nature and was related to the fact that we could not find a key or attribute by which we could compare entities from different systems with campaigns and placements from 1C. The fact is that the process in our company is arranged in such a way that advertising campaigns are entered into different systems by different people (media players, buying, etc.).
To solve this problem, we had to invent a unique hashed key, DANBoID, which would connect entities in different systems together, and which could be quite easily and unambiguously identified in the loaded datasets. This identifier is generated in the internal 1C system for each individual placement and throws itself into campaigns, placements and counters on all platforms and in all AdServing systems. Implementing the practice of affixing DANBoID to all placements took some time, but we did it :)
Then we found out that not all sites have an API for automatic statistics collection, and even those that have an API do not return all the necessary data.
At this stage, we decided to significantly reduce the list of sites for integration and focus on the main sites that are involved in the vast majority of advertising campaigns. This list includes all the largest players in the advertising market (Google, Yandex, Mail.ru), social networks (VK, Facebook, Twitter), the main AdServing and analytics systems (DCM, Adriver, Weborama, Google Analytics) and other platforms.
The bulk of the sites we selected had an API that gave us the necessary metrics. In those cases when the API was not there, or it did not have the necessary data, to download the data, we used reports that came daily to the office mail (in some systems it is possible to configure such reports, in others we agreed on the development of such reports for us).
When analyzing data from different sites, we found that the hierarchy of entities is not the same in different systems. Moreover, information from different systems must be loaded in different detail.
To solve this problem, the SubDANBoID concept was developed. The idea of SubDANBoID is quite simple, we mark the main essence of the campaign on the site with the generated DANBoID, and we upload all the nested entities with unique identifiers of the site and form the SubDANBoID according to the DANBoID principle + identifier of the nested entity of the first level + identifier of the nested entity of the second level + ... This approach allowed us to associate advertising campaigns in different systems and upload detailed statistics on them.
We also had to solve the problem of access to campaigns at different sites. As we wrote above, the mechanism of delegating access to the campaign to a separate technical account is not always applicable. Therefore, we had to develop an infrastructure for automatic authorization through OAuth using tokens and update mechanisms for these tokens.
Further in the article we will try to describe in more detail the architecture of the solution and the technical details of the implementation.
Starting the implementation of a new product, we understood that it was immediately necessary to provide for the possibility of connecting new sites, so we decided to follow the path of microservice architecture.
When designing the architecture, we singled out in separate services connectors to all external systems - 1C, advertising platforms and adserving systems.
The main idea is that all the connectors to the sites have the same API and are adapters that bring the site APIs to our convenient interface.
At the center of our product is a web application, which is a monolith, which is designed so that it can be easily disassembled into services. This application is responsible for processing downloaded data, comparing statistics from different systems and presenting it to users of the system.
To communicate connectors with a web application, we had to create an additional service, which we called Connector Proxy. It performs the functions of Service Discovery and Task Scheduler. This service runs data collection tasks for each connector every night. Writing a service layer was easier than connecting a message broker, and for us it was important to get the result as quickly as possible.
For simplicity and speed of development, we also decided that all services would be a Web API. This made it possible to quickly assemble a proof-of-concept and verify that the entire design was working.
A separate, rather difficult, task was setting up access to collect data from different cabinets, which, as we decided, should be carried out by users through a web interface. It consists of two separate steps: first, the user through OAuth adds a token to access the account, and then sets up data collection for the client from a specific account. Obtaining a token through OAuth is necessary, because, as we already wrote, it is not always possible to delegate access to the desired cabinet on the site.
To create a universal mechanism for selecting a cabinet from sites, we had to add a method to the connector API that renders JSON Schema, which is rendered into the form using a modified JSONEditor component. So users were able to choose the accounts from which to download data.
To comply with the request limits that exist on the sites, we combine the request for settings within the same token, but we can process different tokens in parallel.
We chose MongoDB as a repository for downloadable data for both a web application and connectors, which allowed us not to bother much about the data structure at the initial stages of development, when the application model changes after a day.
Soon we found out that not all data fits well in MongoDB and, for example, daily statistics are more convenient to store in a relational database. Therefore, for connectors whose data structure is more suitable for a relational database, we started using PostgreSQL or MS SQL Server as storage.
The selected architecture and technology allowed us to relatively quickly build and launch the D1.Digital product. Over the two years of product development, we developed 23 site connectors, gained invaluable experience working with third-party APIs, learned how to bypass the pitfalls of different sites, each of which turned out to be their own, contributed to the development of the API at least 3 sites, automatically downloaded information on almost 15,000 campaigns and over 80,000 placements, collected a lot of feedback from users about the product and managed to change the main process of the product several times, based on this feedback.
Two years have passed since the start of the development of D1.Digital . The constant increase in the load on the system and the emergence of new data sources gradually revealed problems in the existing solution architecture.
The first problem is related to the amount of data downloaded from the sites. We were faced with the fact that collecting and updating all the necessary data from the largest sites began to take too much time. For example, collecting data on the AdRiver adserving system, with which we track statistics for most of the placements, takes about 12 hours.
To solve this problem, we started using all kinds of reports to download data from the sites, we are trying to develop their APIs together with the sites so that its speed meets our needs, and parallelize the loading of data as much as possible.
Another problem is with the processing of downloaded data. Now, with the arrival of new statistics on placement, a multi-stage process of recalculating metrics is launched, which includes loading raw data, calculating aggregated metrics for each site, comparing data from different sources with each other and calculating summary metrics for the campaign. This causes a large load on the web application, which performs all the calculations. Several times, in the process of recounting, the application eats up all the memory on the server, about 10-15 GB, which has the most detrimental effect on the user’s work with the system.
The identified problems and grandiose plans for further product development have led us to the need to review the application architecture.
We started with connectors.
We noticed that all the connectors work according to the same model, so we built a pipeline-conveyor in which to create the connector you only had to program the logic of steps, the rest was universal. If any connector needs to be improved, then we will immediately transfer it to the new framework while finalizing the connector.
In parallel, we started placing connectors in docker and Kubernetes.
We planned to move to Kubernetes for a rather long time, experimented with the CI / CD settings, but started moving only when one connector began to eat up more than 20 GB of memory on the server, almost killing the rest of the processes. During the investigation, the connector was relocated to the Kubernetes cluster, where it eventually remained even when the error was fixed.
Quite quickly, we realized that Kubernetes was convenient, and in six months we moved 7 connectors and Connectors Proxy to the production cluster, which consume the most resources.
Following the connectors, we decided to change the architecture of the rest of the application.
The main problem was that the data comes from connectors to proxies in large bundles, and then they beat on DANBoID and transferred to a central web application for processing. Due to the large number of recalculations of metrics, a large load on the application occurs.
It also turned out to be quite difficult to monitor the status of individual data collection tasks and transfer errors that occur inside the connectors to a central web application so that users can see what is happening and because of which data is not being collected.
To solve these problems, we developed architecture 2.0.
The main difference between the new version of the architecture is that instead of the Web API, we use RabbitMQ and the MassTransit library for exchanging messages between services. To do this, I had to completely rewrite the Connectors Proxy, making it a Connectors Hub. The name was changed because the main role of the service is now not in forwarding requests to and from connectors, but in managing the collection of metrics from connectors.
From the central web application, we allocated information on placements and statistics from sites to separate services, which made it possible to get rid of unnecessary recounts and store only already calculated and aggregated statistics at the level of placements. We also rewrote and optimized the logic for calculating basic statistics based on raw data.
At the same time, we are transferring all services and applications to docker and Kubernetes, so that the solution scales more easily and is convenient to manage.
The Proof-of-concept architecture 2.0 of the D1.Digital product is ready and works in a test environment with a limited set of connectors. The point is small - to rewrite another 20 connectors to a new platform, test that the data is loaded correctly, and all metrics are correctly counted, and roll out the entire structure in production.
In fact, this process will occur gradually and we will have to leave backward compatibility with the old APIs so that everything continues to work.
Our immediate plans include the development of new connectors, integration with new systems and the addition of additional metrics to the data set that are downloaded from connected sites and adserving systems.
We also plan to transfer all applications, including the central web application, to docker and Kubernetes. In combination with the new architecture, this will significantly simplify the deployment, monitoring and control of consumed resources.
There is still an idea to experiment with choosing a database for storing statistics, which is now stored in MongoDB. We have already transferred several new connectors to SQL databases, but there the difference is almost imperceptible, and for aggregated statistics by days, which can be requested for an arbitrary period, the gain can be quite serious.
In general, grandiose plans, move on :)
The authors of the R&D Dentsu Aegis Network Russia article: Georgy Ostapenko ( shmiigaa ), Mikhail Kotsik ( hitexx )
Source
Communication group Dentsu Aegis Network Russia is the largest player in the digital advertising market and actively invests in technology, trying to optimize and automate its business processes. One of the unresolved problems of the online advertising market was the task of collecting statistics on advertising campaigns from different online sites. The solution to this problem ultimately resulted in the creation of the D1.Digital product (read as DiVan), the development of which we want to tell.
What for?
1. At the start of the project, there was not a single finished product on the market that solved the task of automating the collection of statistics on advertising campaigns. This means that no one but ourselves will close our needs.
Services such as Improvado, Roistat, Supermetrics, SegmentStream, offer integration with sites, social networks and Google Analitycs, and also provide the ability to build analytical dashboards for convenient analysis and control of advertising campaigns. Before starting to develop our product, we tried to use some of these systems in our work to collect data from sites, but, unfortunately, they could not solve our problems.
The main problem was that the tested products were repelled from data sources, displaying statistics of placements in sections by site, and did not allow the aggregation of statistics on advertising campaigns. This approach did not allow seeing statistics from different sites in one place and analyzing the state of the campaign as a whole.
Another factor was that at the initial stages the products were oriented to the Western market and did not support integration with Russian sites. And for those sites with which the integration was implemented, all the necessary metrics with sufficient detail were not always uploaded, and the integration was not always convenient and transparent, especially when it was necessary to get something that was not in the system interface.
In general, we decided not to adapt to third-party products, but started developing our own ...
2. The online advertising market is growing from year to year, and in 2018, in terms of advertising budgets, it traditionally overtook the largest TV advertising market. So there is a scale .
3. Unlike the TV advertising market, where the sale of commercial advertising is monopolized, the mass of individual owners of advertising equipment of various sizes with their advertising offices work on the Internet. Since the advertising campaign, as a rule, runs on several sites at once, in order to understand the state of the advertising campaign, it is necessary to collect reports from all sites and bring them together into one large report that will show the whole picture. This means that there is potential for optimization.
4. It seemed to us that the owners of advertising inventory on the Internet already had an infrastructure for collecting statistics and displaying them in advertising offices, and they could provide an API for this data. So, there is a technical feasibility. We will say right away that it was not so simple.
In general, all the prerequisites for the implementation of the project were obvious to us, and we ran to implement the project ...
Grand plan
First, we formed a vision of an ideal system:
- It should automatically load advertising campaigns from the 1C corporate system with their names, periods, budgets and placements on various platforms.
- For each placement inside the advertising campaign, all possible statistics from the sites on which the placement is taking place, such as the number of impressions, clicks, views, etc., should be automatically downloaded.
- Some advertising campaigns are monitored by third-party monitoring by the so-called adserving systems, such as Adriver, Weborama, DCM, etc. There is also an industrial Internet meter in Russia - Mediascope. According to our idea, the data of independent and industrial monitoring should also be automatically uploaded to the corresponding advertising campaigns.
- Most advertising campaigns on the Internet are aimed at certain targeted actions (buying, calling, recording for a test drive, etc.), which are tracked using Google Analytics, and statistics on which are also important for understanding the status of the campaign and should be uploaded to our tool .
The first pancake is lumpy
Considering our commitment to flexible principles of software development (agile, all things), we decided to first develop MVP and then move towards the intended goal iteratively.
We decided to build MVP on the basis of our product DANBo (Dentsu Aegis Network Board) , which is a web application with general information on the advertising campaigns of our customers.
For MVP, the project was simplified as much as possible in terms of implementation. We have selected a limited list of sites for integration. These were the main platforms, such as Yandex.Direct, Yandex.Display, RB.Mail, MyTarget, Adwords, DBM, VK, FB, and the main adserving systems Adriver and Weborama.
To access statistics on the sites through the API, we used a single account. The client group manager, who wanted to use the automatic collection of statistics on the advertising campaign, had to first delegate access to the necessary advertising campaigns on the sites to the platform account.
Further, the user of the DANBo system had to upload a file of a certain format to the Excel system, in which all information about the placement (advertising campaign, site, format, placement period, planned indicators, budget, etc.) and the identifiers of the corresponding advertising campaigns on the sites were written and counters in adserving systems.
It looked, frankly, terrifying:
The downloaded data was stored in a database, and then individual services collected campaign identifiers from them from the sites and downloaded statistics on them.
A separate windows service was written for each site, which once a day went under one service account in the site’s API and downloaded statistics on the specified campaign identifiers. The same thing happened with adserving systems.
The downloaded data was displayed on the interface in the form of a small self-written dashboard:
Unexpectedly for us, MVP earned and began to download current statistics on advertising campaigns on the Internet. We implemented the system on several clients, but when we tried to scale, we ran into serious problems:
- The main problem was the complexity of preparing data for uploading to the system. Also, the placement data had to be reduced to a strictly fixed format before downloading. In the file for downloading, it was necessary to register the identifiers of entities from different sites. We are faced with the fact that it is very difficult for technically untrained users to explain where to find these identifiers on the site and where to put them in the file. Considering the number of employees in the divisions conducting campaigns on the sites, and the turnover, this resulted in a huge amount of support on our side, which categorically did not suit us.
- Another problem was that not all advertising platforms had mechanisms for delegating access to advertising campaigns to other accounts. But even if the delegation mechanism was available, not all advertisers were willing to provide third-party account access to their campaigns.
- An important factor was the indignation, which caused users that all planned indicators and placement details that they already contribute to our 1C accounting system should be re-entered into DANBo .
This gave us the idea that the primary source of information about the location should be our 1C system, in which all the data is entered accurately and on time (the point is that based on the 1C data, accounts are formed, therefore, the correct entry of the data in 1C is for everyone in KPI). So a new system concept appeared ...
Concept
The first thing we decided to do was to separate the system of collecting statistics on advertising campaigns on the Internet into a separate product - D1.Digital .
In the new concept, we decided to upload information on advertising campaigns and placements inside them from 1C to D1.Digital , and then pull statistics from sites and from AdServing systems to these placements. This was supposed to greatly simplify the lives of users (and, as usual, add work to developers) and reduce the amount of support.
The first problem that we encountered was of an organizational nature and was related to the fact that we could not find a key or attribute by which we could compare entities from different systems with campaigns and placements from 1C. The fact is that the process in our company is arranged in such a way that advertising campaigns are entered into different systems by different people (media players, buying, etc.).
To solve this problem, we had to invent a unique hashed key, DANBoID, which would connect entities in different systems together, and which could be quite easily and unambiguously identified in the loaded datasets. This identifier is generated in the internal 1C system for each individual placement and throws itself into campaigns, placements and counters on all platforms and in all AdServing systems. Implementing the practice of affixing DANBoID to all placements took some time, but we did it :)
Then we found out that not all sites have an API for automatic statistics collection, and even those that have an API do not return all the necessary data.
At this stage, we decided to significantly reduce the list of sites for integration and focus on the main sites that are involved in the vast majority of advertising campaigns. This list includes all the largest players in the advertising market (Google, Yandex, Mail.ru), social networks (VK, Facebook, Twitter), the main AdServing and analytics systems (DCM, Adriver, Weborama, Google Analytics) and other platforms.
The bulk of the sites we selected had an API that gave us the necessary metrics. In those cases when the API was not there, or it did not have the necessary data, to download the data, we used reports that came daily to the office mail (in some systems it is possible to configure such reports, in others we agreed on the development of such reports for us).
When analyzing data from different sites, we found that the hierarchy of entities is not the same in different systems. Moreover, information from different systems must be loaded in different detail.
To solve this problem, the SubDANBoID concept was developed. The idea of SubDANBoID is quite simple, we mark the main essence of the campaign on the site with the generated DANBoID, and we upload all the nested entities with unique identifiers of the site and form the SubDANBoID according to the DANBoID principle + identifier of the nested entity of the first level + identifier of the nested entity of the second level + ... This approach allowed us to associate advertising campaigns in different systems and upload detailed statistics on them.
We also had to solve the problem of access to campaigns at different sites. As we wrote above, the mechanism of delegating access to the campaign to a separate technical account is not always applicable. Therefore, we had to develop an infrastructure for automatic authorization through OAuth using tokens and update mechanisms for these tokens.
Further in the article we will try to describe in more detail the architecture of the solution and the technical details of the implementation.
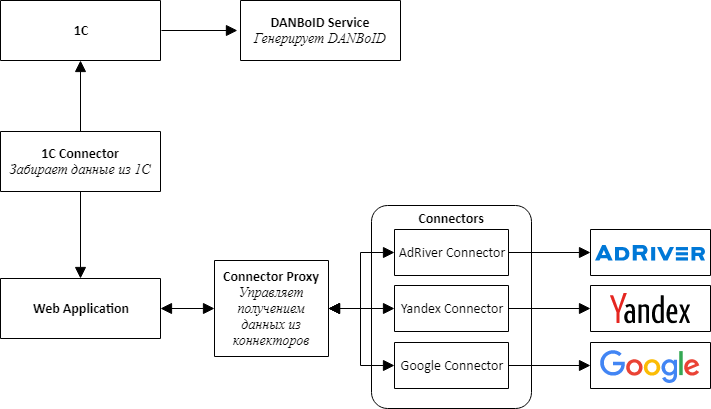
Solution Architecture 1.0
Starting the implementation of a new product, we understood that it was immediately necessary to provide for the possibility of connecting new sites, so we decided to follow the path of microservice architecture.
When designing the architecture, we singled out in separate services connectors to all external systems - 1C, advertising platforms and adserving systems.
The main idea is that all the connectors to the sites have the same API and are adapters that bring the site APIs to our convenient interface.
At the center of our product is a web application, which is a monolith, which is designed so that it can be easily disassembled into services. This application is responsible for processing downloaded data, comparing statistics from different systems and presenting it to users of the system.
To communicate connectors with a web application, we had to create an additional service, which we called Connector Proxy. It performs the functions of Service Discovery and Task Scheduler. This service runs data collection tasks for each connector every night. Writing a service layer was easier than connecting a message broker, and for us it was important to get the result as quickly as possible.
For simplicity and speed of development, we also decided that all services would be a Web API. This made it possible to quickly assemble a proof-of-concept and verify that the entire design was working.
A separate, rather difficult, task was setting up access to collect data from different cabinets, which, as we decided, should be carried out by users through a web interface. It consists of two separate steps: first, the user through OAuth adds a token to access the account, and then sets up data collection for the client from a specific account. Obtaining a token through OAuth is necessary, because, as we already wrote, it is not always possible to delegate access to the desired cabinet on the site.
To create a universal mechanism for selecting a cabinet from sites, we had to add a method to the connector API that renders JSON Schema, which is rendered into the form using a modified JSONEditor component. So users were able to choose the accounts from which to download data.
To comply with the request limits that exist on the sites, we combine the request for settings within the same token, but we can process different tokens in parallel.
We chose MongoDB as a repository for downloadable data for both a web application and connectors, which allowed us not to bother much about the data structure at the initial stages of development, when the application model changes after a day.
Soon we found out that not all data fits well in MongoDB and, for example, daily statistics are more convenient to store in a relational database. Therefore, for connectors whose data structure is more suitable for a relational database, we started using PostgreSQL or MS SQL Server as storage.
The selected architecture and technology allowed us to relatively quickly build and launch the D1.Digital product. Over the two years of product development, we developed 23 site connectors, gained invaluable experience working with third-party APIs, learned how to bypass the pitfalls of different sites, each of which turned out to be their own, contributed to the development of the API at least 3 sites, automatically downloaded information on almost 15,000 campaigns and over 80,000 placements, collected a lot of feedback from users about the product and managed to change the main process of the product several times, based on this feedback.
Solution Architecture 2.0
Two years have passed since the start of the development of D1.Digital . The constant increase in the load on the system and the emergence of new data sources gradually revealed problems in the existing solution architecture.
The first problem is related to the amount of data downloaded from the sites. We were faced with the fact that collecting and updating all the necessary data from the largest sites began to take too much time. For example, collecting data on the AdRiver adserving system, with which we track statistics for most of the placements, takes about 12 hours.
To solve this problem, we started using all kinds of reports to download data from the sites, we are trying to develop their APIs together with the sites so that its speed meets our needs, and parallelize the loading of data as much as possible.
Another problem is with the processing of downloaded data. Now, with the arrival of new statistics on placement, a multi-stage process of recalculating metrics is launched, which includes loading raw data, calculating aggregated metrics for each site, comparing data from different sources with each other and calculating summary metrics for the campaign. This causes a large load on the web application, which performs all the calculations. Several times, in the process of recounting, the application eats up all the memory on the server, about 10-15 GB, which has the most detrimental effect on the user’s work with the system.
The identified problems and grandiose plans for further product development have led us to the need to review the application architecture.
We started with connectors.
We noticed that all the connectors work according to the same model, so we built a pipeline-conveyor in which to create the connector you only had to program the logic of steps, the rest was universal. If any connector needs to be improved, then we will immediately transfer it to the new framework while finalizing the connector.
In parallel, we started placing connectors in docker and Kubernetes.
We planned to move to Kubernetes for a rather long time, experimented with the CI / CD settings, but started moving only when one connector began to eat up more than 20 GB of memory on the server, almost killing the rest of the processes. During the investigation, the connector was relocated to the Kubernetes cluster, where it eventually remained even when the error was fixed.
Quite quickly, we realized that Kubernetes was convenient, and in six months we moved 7 connectors and Connectors Proxy to the production cluster, which consume the most resources.
Following the connectors, we decided to change the architecture of the rest of the application.
The main problem was that the data comes from connectors to proxies in large bundles, and then they beat on DANBoID and transferred to a central web application for processing. Due to the large number of recalculations of metrics, a large load on the application occurs.
It also turned out to be quite difficult to monitor the status of individual data collection tasks and transfer errors that occur inside the connectors to a central web application so that users can see what is happening and because of which data is not being collected.
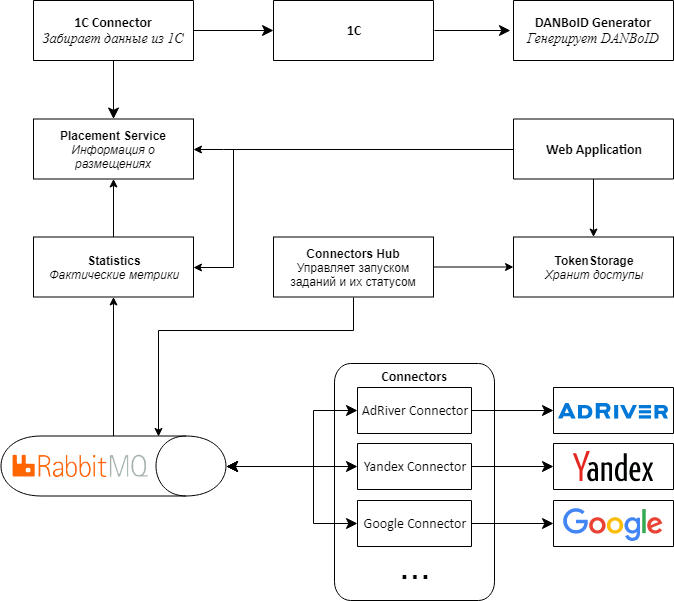
To solve these problems, we developed architecture 2.0.
The main difference between the new version of the architecture is that instead of the Web API, we use RabbitMQ and the MassTransit library for exchanging messages between services. To do this, I had to completely rewrite the Connectors Proxy, making it a Connectors Hub. The name was changed because the main role of the service is now not in forwarding requests to and from connectors, but in managing the collection of metrics from connectors.
From the central web application, we allocated information on placements and statistics from sites to separate services, which made it possible to get rid of unnecessary recounts and store only already calculated and aggregated statistics at the level of placements. We also rewrote and optimized the logic for calculating basic statistics based on raw data.
At the same time, we are transferring all services and applications to docker and Kubernetes, so that the solution scales more easily and is convenient to manage.
Where are we now
The Proof-of-concept architecture 2.0 of the D1.Digital product is ready and works in a test environment with a limited set of connectors. The point is small - to rewrite another 20 connectors to a new platform, test that the data is loaded correctly, and all metrics are correctly counted, and roll out the entire structure in production.
In fact, this process will occur gradually and we will have to leave backward compatibility with the old APIs so that everything continues to work.
Our immediate plans include the development of new connectors, integration with new systems and the addition of additional metrics to the data set that are downloaded from connected sites and adserving systems.
We also plan to transfer all applications, including the central web application, to docker and Kubernetes. In combination with the new architecture, this will significantly simplify the deployment, monitoring and control of consumed resources.
There is still an idea to experiment with choosing a database for storing statistics, which is now stored in MongoDB. We have already transferred several new connectors to SQL databases, but there the difference is almost imperceptible, and for aggregated statistics by days, which can be requested for an arbitrary period, the gain can be quite serious.
In general, grandiose plans, move on :)
The authors of the R&D Dentsu Aegis Network Russia article: Georgy Ostapenko ( shmiigaa ), Mikhail Kotsik ( hitexx )
All Articles