How much are the regional salaries of developers different from Moscow, given the cost of living

In the wake of our general salary survey for the first half of 2019, we continue to clarify certain aspects that are either not included in the survey or that are affected only superficially. Today we look in more detail at the regional features of salaries:
- We’ll find out how much they pay to developers living in Russian million-plus cities and smaller cities.
- For the first time, let’s see how the salaries of regional developers differ from the salaries of Moscow developers, if we also take into account the cost of living.
We take salary data from the “My Circle” salary calculator , in which users indicate salaries that they receive after they deduct all taxes and can also look at any other salaries in IT.
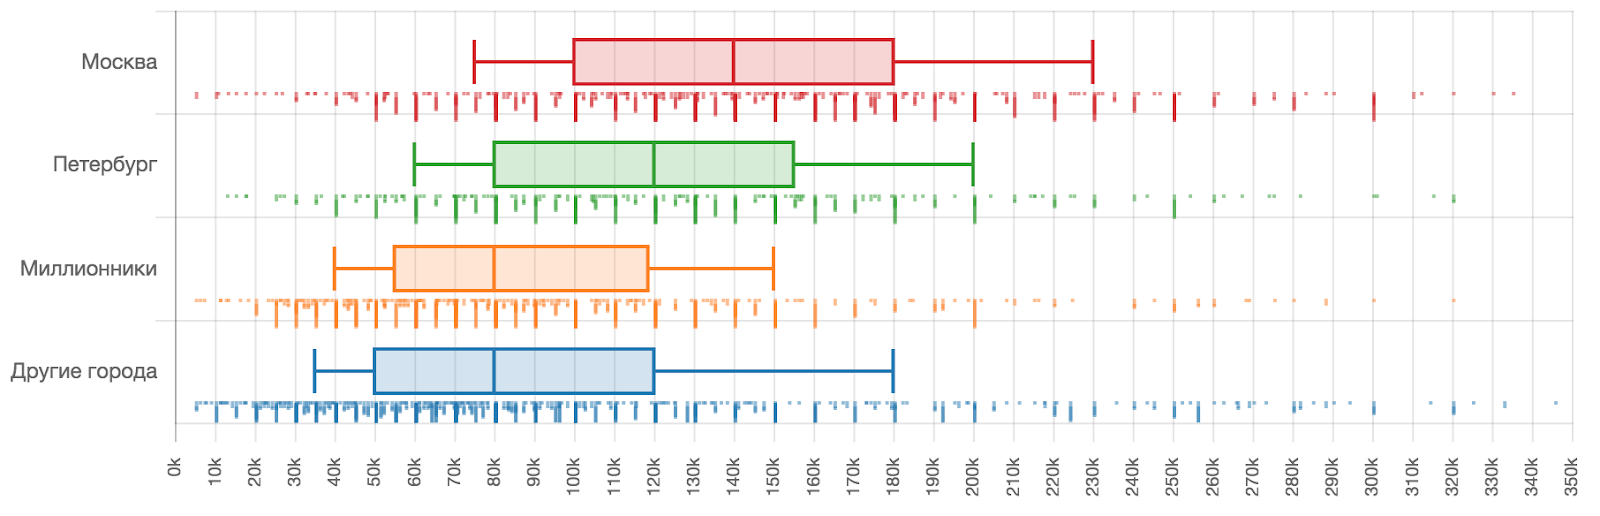
First, let's compare the absolute values of salaries
In Moscow, the developer’s median salary is 140,000 rubles; in St. Petersburg, 120,000 rubles. In million-plus cities and other cities, the median salary is the same - 80,000 rubles. At first glance, in St. Petersburg, wages are 14% less than in Moscow, and in regional cities - 42% less.
If we continue to compare the salaries of developers in individual cities with a million-plus population in the same way, we will see that they are quite different from each other. In Novosibirsk, Nizhny Novgorod and Krasnodar, the median salary of developers is about 90,000 rubles, which is 35% less than in Moscow. In Volgograd, Yekaterinburg, Voronezh, Samara, Kazan and Krasnoyarsk - about 80,000 rubles, which is 43% less. In Perm and Rostov-on-Don - about 70,000 rubles, which is 50% less. In Chelyabinsk and Omsk - about 60,000 rubles, which is 57% less.

That is, at first glance, in a number of cities, developers live 2 or more times poorer than their Moscow counterparts. Can it really be inside one country? But what if we also take into account the cost of living in each city? How much will the real purchasing power of developers differ then?
Now take into account the cost of living
Let's resort to the help of the Numbeo service, which collects statistics on prices for various goods and services in the cities of the world. These prices are compared with the prices of similar goods and services in New York, and the corresponding indices are calculated, for example, such:
- Cost of Living Index (Excl. Rent). The cost of living index (not including rental costs) shows the difference in prices of consumer goods - including food, restaurants, transportation and utilities - in the city compared to New York. The cost of living index does not include living expenses, such as rent or mortgage. If the city has a cost of living index of 120, this means that Numbeo rates it 20% more expensive than New York.
- Rent Index. The rental index is the price difference for renting apartments in a city compared to New York. If the rental index is 80, Numbeo estimates the cost of renting in this city is on average 20% less than in New York.
- Cost of Living Plus Rent Index. The cost of living index plus the rent index - as the name implies, this index is the sum of the other two: the cost of living index and the rent index. This is the price difference for consumer goods and services — including rent — in the city compared to New York.
As you can see, any index in New York will always be 100.
For our purposes, we will use the latest aggregated index containing information on the cost of living and rental housing in the city.
It is more convenient for us to compare our cities not with New York, but with Moscow. To do this, divide the index of each city relative to New York by the Moscow index relative to New York and multiply by 100 to get interest. We will see the following picture: the new Moscow index will become equal to 100, the cost of living and rent in St. Petersburg is 22% lower, in Chelyabinsk - 42%.
At the same time, we add the salary index by dividing the salary in each city by the salary in Moscow. Once again we see that the salary in St. Petersburg is less by 14%, and in Chelyabinsk - by 57%.
Unfortunately, in Numbeo there is no information on some of our million-plus cities.
| City | Developer’s median salary, thousand rubles (My Circle data) | Moscow salary index | New York City Living and Housing Cost Index (Numbeo data) | The cost of living and housing index relative to Moscow |
| Moscow | 140 | 100.00 | 35.65 | 100.00 |
| St. Petersburg | 120 | 85.71 | 27.64 | 77.53
|
| Novosibirsk | 85 | 60.71 | 23.18 | 65.02 |
| Nizhny Novgorod | 92 | 65.71 | 24.14 | 67.71 |
| Krasnodar | 85 | 60.71 | 21.96 | 61.60 |
| Yekaterinburg | 80 | 57.14 | 23.53 | 66.00 |
| Voronezh | 80 | 57.14 | 21.19 | 59.44 |
| Samara | 79 | 56.43 | 22,99 | 64.49 |
| Kazan | 78 | 55.71 | 22.91 | 64.26 |
| Permian | 70 | 50.00 | 21.51 | 60.34 |
| Rostov-on-Don | 70 | 50.00 | 22.64 | 63.51 |
| Chelyabinsk | 60 | 42.86 | 20.74 | 58.18 |
Knowing the salary in each city and the cost of living and housing relative to Moscow, we can compare how many goods and services can be bought in each city in comparison with similar goods and services in Moscow. To do this, divide the salary index by the index of the cost of living and housing and multiply by 100 to get interest.
We call the resulting number the index of security for local goods, services and housing. And we will see the following curious picture: in St. Petersburg, a developer can buy 10% more local goods, services and housing than in Moscow. And in Krasnodar, Nizhny Novgorod and Voronezh - only 1-4% less than in Moscow, that is, almost the same. Chelyabinsk has the lowest indicator - here the developer is provided with goods, services and housing 26% less than in Moscow.
In addition, we look at two indexes: the cost of living and the cost of renting a home. We see that developers from regional cities pay 60-70% less for rental housing, and 20-25% less for local goods and services.
| City | Developer median salary, thousand rubles | Cost of living index relative to Moscow | Housing price index relative to Moscow | Index of Provision of Local Goods, Services, and Housing |
| St. Petersburg | 120 | 89.50 | 58.35 | 110.55 |
| Moscow | 140 | 100.00 | 100.00 | 100.00 |
| Krasnodar | 85 | 77.91 | 34.43 | 98.56 |
| Nizhny Novgorod | 92 | 83,44 | 39.35 | 97.05 |
| Voronezh | 80 | 77.91 | 27.13 | 96.14 |
| Novosibirsk | 85 | 79.90 | 38.51 | 93.38 |
| Samara | 79 | 80.47 | 36.11 | 87.50 |
| Kazan | 78 | 80.27 | 35.81 | 86.70 |
| Yekaterinburg | 80 | 81.98 | 37.93 | 86.58 |
| Permian | 70 | 77.75 | 30.89 | 82.87 |
| Rostov-on-Don | 70 | 81.04 | 32.57 | 78.73 |
| Chelyabinsk | 60 | 76.56 | 26.11 | 73.67 |
Summarize
- If we compare the salaries of developers from different Russian cities directly at face value, then in the majority they will be 35-60% less than Moscow salaries.
- If we take into account the cost of local goods, services and rental housing, then the real purchasing power of regional developers may be even higher than that of Moscow - as in St. Petersburg, or almost the same - as in Krasnodar, Nizhny Novgorod and Voronezh.
- Chelyabinsk has the lowest purchasing power among million-plus cities - here the developer is provided with goods, services and housing 26% less than in Moscow.
- This alignment of living standards - despite the sometimes significant difference in nominal salaries - is due to the fact that developers from regional cities pay 60-70% less for rental housing, and 20-25% less for local goods and services.
If you like our salary research and want to get even more accurate and useful information, do not forget to leave your salaries in our calculator, from where we then take all the data: moikrug.ru/salaries/new . This is anonymous.
All Articles