Why does Windows read one file one hundred thousand times to open a menu?

“Explorer spends 700 ms to open the context menu of the taskbar. 75% of this time, it performs 114,801 read operations from one file, the average amount of read data is 68 bytes.
Should I write a post about this, or a rather sarcastic tweet? ”
I work quickly at a computer, and therefore it annoys me when I have to wait for the completion of an operation, which should be performed instantly. A constant obstacle on my heavy duty home laptop was the slow closing of windows on the taskbar. I right-click on the icon, wait for the menu to open, and then select “Close Window”. The slowest in this process should be mouse movements, but it turns out that the longest component is the delay before the menu appears.
It bothered me for a long time, but I showed uncharacteristic self-control and kept myself from irritation. That was until today, when I finally broke and grabbed the ETW tracer.
This post is written as a check for speed blogging. About 90 minutes passed from the moment the problem was found and the sarcastic tweet about it until the post was published.
The ETW tracer fixed how I right-click on the taskbar and close the two Explorer windows. I used the UIforETW Tracing to file function with default options, resulting in a diagnostic log of 20.9 MB .
Sometimes the hardest part of analyzing a trace is finding the location of the problem, but in this case this part of the analysis is trivial. There were three unambiguous signals that indicated the right place, and the painfully obvious culprit of the crime.
The first signal was input events. UIforETW contains an integrated input logger (anonymized enough so that I do not accidentally steal passwords or personal information), so I just had to study the MouseUp and Button Type events in detail with a value of 2 corresponding to the right mouse button. At the same time, marks on the WPA timeline appear when these events occur - see the vertical lines in the screenshot:
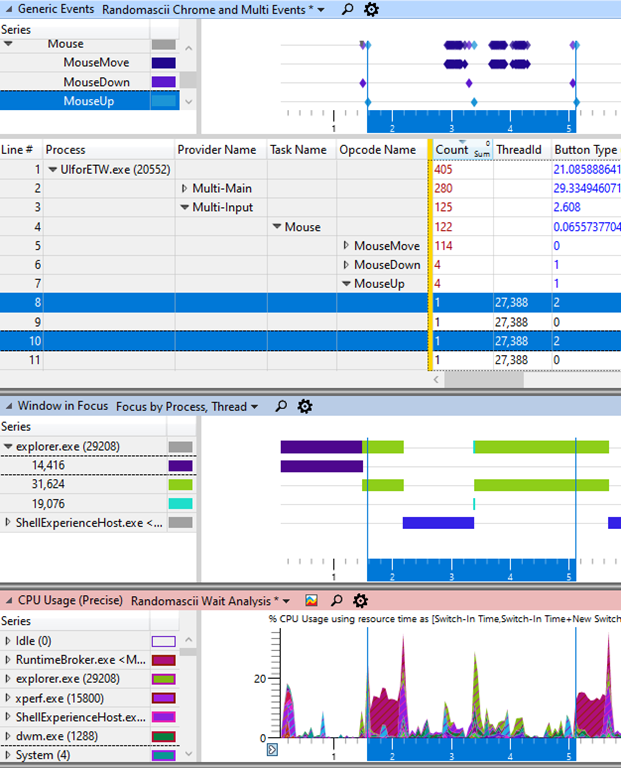
This made it clear to me that when I release the right mouse button, then after 600 ms the window focus changes, which, in my opinion, corresponds to the moment the menu is displayed. In addition, RuntimeBroker.exe has a clear block of CPU activity between the events of releasing the mouse button and changing the focus of the window.
It has not been proven that the change in window focus and CPU activity are related, but taking measurements with the screen recording application, I saw that it takes about 660 ms to display the menu, so I tend to trust this.
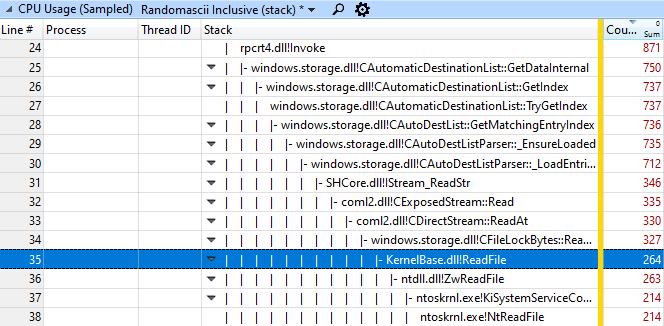
The next step is to learn what RuntimeBroker.exe is doing. Although CPU Usage (Precise) helps you to see how much CPU time the process uses and why it is idle, the CPU Usage (Sampled) table is a good tool to find out what the CPU time is spent on. I carefully studied it and quickly found that 264 samples were from KernelBase.dll! ReadFile :
After searching a little more, I found other call stacks that also affected this function, so I right-clicked it and selected View Callers-> By Function . The mode turned on (with inverted stacks) showed that out of 899 samples of this process, 628 samples, or 70%, from different call stacks passed through this function:
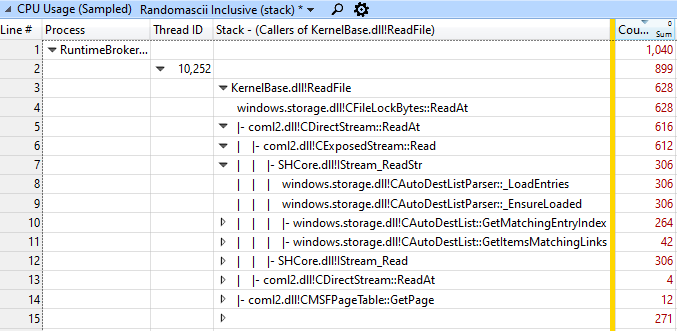
271 samples in this stream did not pass through the function, and the remaining samples (not shown) were in other streams.
Note that 899 samples in a stream of 10 252 represent two mouse clicks, i.e. approximately 450 samples or 450 ms (with a standard sampling frequency of 1 kHz) per mouse click.
Sometimes file I / O is CPU time
CPU Usage (Sampled) shows the CPU time, so disk I / O is usually not displayed here, because at these moments the thread falls asleep and waits for the disk. The fact that I / O operations are displayed as CPU time means that all reads fell on the system cache and CPU time was unnecessary kernel resources (see ntoskrnl.exe in the first sampled call stack) spent on getting data from the cache.
Now that file I / O has come under suspicion, we need to go to Graph Explorer-> Storage-> File I / O. Having slightly adjusted the appearance of the columns, we got the following impressive result:
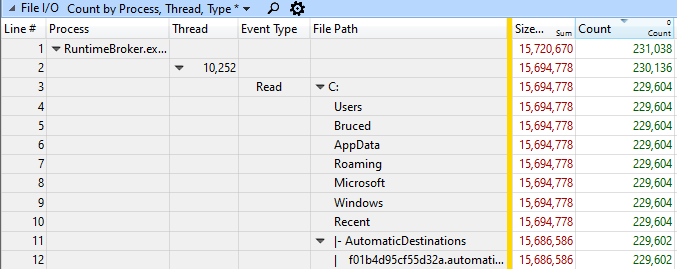
, 10 252 RuntimeBroker.exe 229 604 ReadFile, 15 686 586 . 68 .
.
, — . , RuntimeBroker.exe . 4 027 904 , , , 1,9 .
, . , ( ):
%appdata%\Microsoft\Windows\Recent\AutomaticDestinations\f01b4d95cf55d32a.automaticDestinations-ms
WPA. — , . :

« „“, ( ) ( ) „“/ . , ». , !
, . , , , .
- ReadFile, 68 . , , . , 4 , .
- , - , — .
- , - , . , ETW !
- https://aka.ms/AA60dfg
- , UIforETW ,
- , ( , ), shift+ . , .
- Hacker news
All Articles