How to make friends industry and big data
One day a digitalization specialist comes to the factory. He walked around here, walked there, wrinkled his forehead and said: “I know how you can optimize something here. You will save specifically! Just give me access, ooo, to this production data. ” In response, the plant shrug. “Here we have a sales analyst. There's something to say about the turbines - very smart Siemens turbines. And for the rest of the equipment, there was nothing spawning. ”
You read a miniature about the conflict of two worlds - industry and analytics. We are just from the last, and here’s how it looks for us: on the one hand, data exchange protocols with a large number of digits in the name that were created for equipment management and inaccessible to ordinary mortals. On the other - analytical systems, beautiful reporting, convenient dashboards and other amenities.
Not every production has reached a high technological level. But everyone needs help. In the photo a frame from the film "Plant".
In this post, we will tell you how we try to fashion a human face (by the standards of a simple data scientist) - to enable business analysts to process industrial data and use beautiful BI reporting.
Recently, we were visiting a gas processing company. The company is large, it combines several plants. We went into the control room. Everything is very well equipped there: each dispatcher has 6-8 monitors, and there are huge plasma on the walls. That's just the contents of these plasmas ... leaves much to be desired. A strange-looking map, stupid arrows, on top of this windows from Windows, which survived the terrible torture and show some numbers.
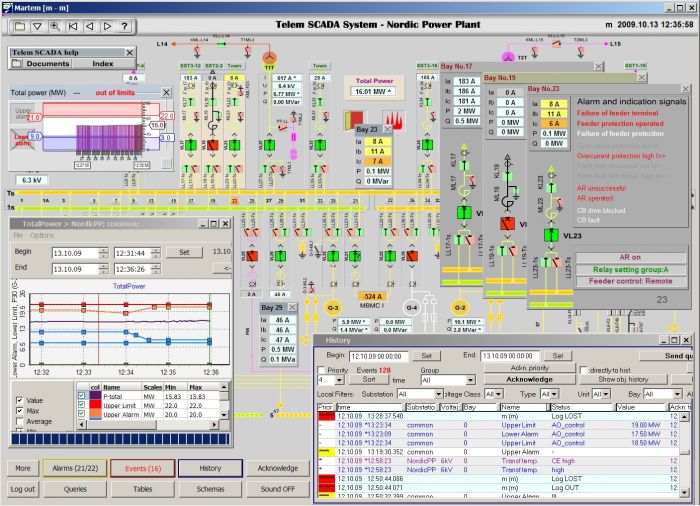
“Why is it so vyrviglazny?” - we ask. “This is the best we can squeeze out of our industrial systems,” we hear in response. The response time of the dispatcher to an incident usually should not exceed 30 seconds, but with such an interface it is not easy to meet. No BI here and does not smell.
Another non-interface story. Data Scientists come to the plant and say: “Give these data about your installation, and we can predict problems in it with 95% accuracy.” Well, at least they promise so. They nod at the factory, and for data scientists the script begins in the best traditions of Kafka. Spot data collection. According to a hundred systems. For each need to write five statements. Attach a personal biography and pedigree to the fifth knee. Pass all analyzes, attach them to an essay on a free topic and catch the good mood of the boss. And only then can we count on success. More precisely, hope.
To solve problems like those described above, you need to make industry friends with analytics. To do this, we are building a single system with integrated architecture. Such a system can work with completely different types of data and solve analytical problems on their basis. We are building a system with an integrated architecture , and not something universal, because universal systems solve any problems equally badly. In a complex architecture, we combine analytics tools of different types of data. Here's what it might look like:
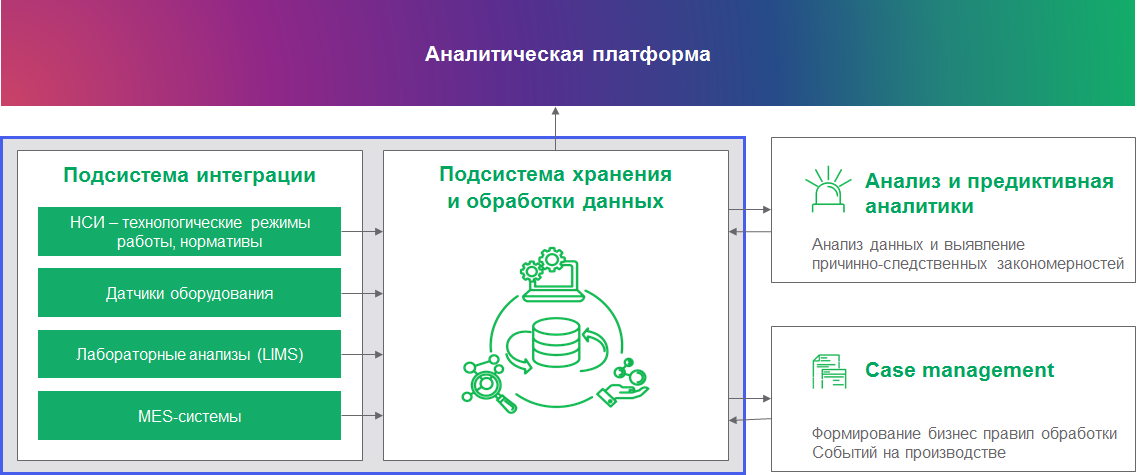
There are many types of data in production. There are classic relational data from business systems and accounting systems. There is data from equipment sensors - time series. There are events from video analytics - they are put into a dataleyk and integrated monitoring is done on them (now this is a popular topic). There are logs from business systems that need to be indexed for further processing (we use Apache Solr) to get a real picture of what is happening in the production taking into account surveillance cameras and to evaluate how operators respond to certain events. And that's not all, each production has its own combination of requirements. And in the end, all work with data should be connected within a single ecosystem, which will allow collecting data in a centralized repository with flexible access settings and common analysis tools.
Recently we had a project: to organize monitoring of the technological regime of the plant, as well as the quality of raw materials. The monitoring system must monitor in real time all the important indicators and compare them with the standards using very original formulas. We take laboratory analyzes of raw materials from one database, and equipment performance indicators from another.
As a result, the operator gets a comprehensive picture of what is happening in his installation: what you need to pay attention to, is it worth stopping the work and how serious is everything. For each deviation from the normative work, the operator must fix the cause of the failure. Thus, the knowledge base on incidents has grown.
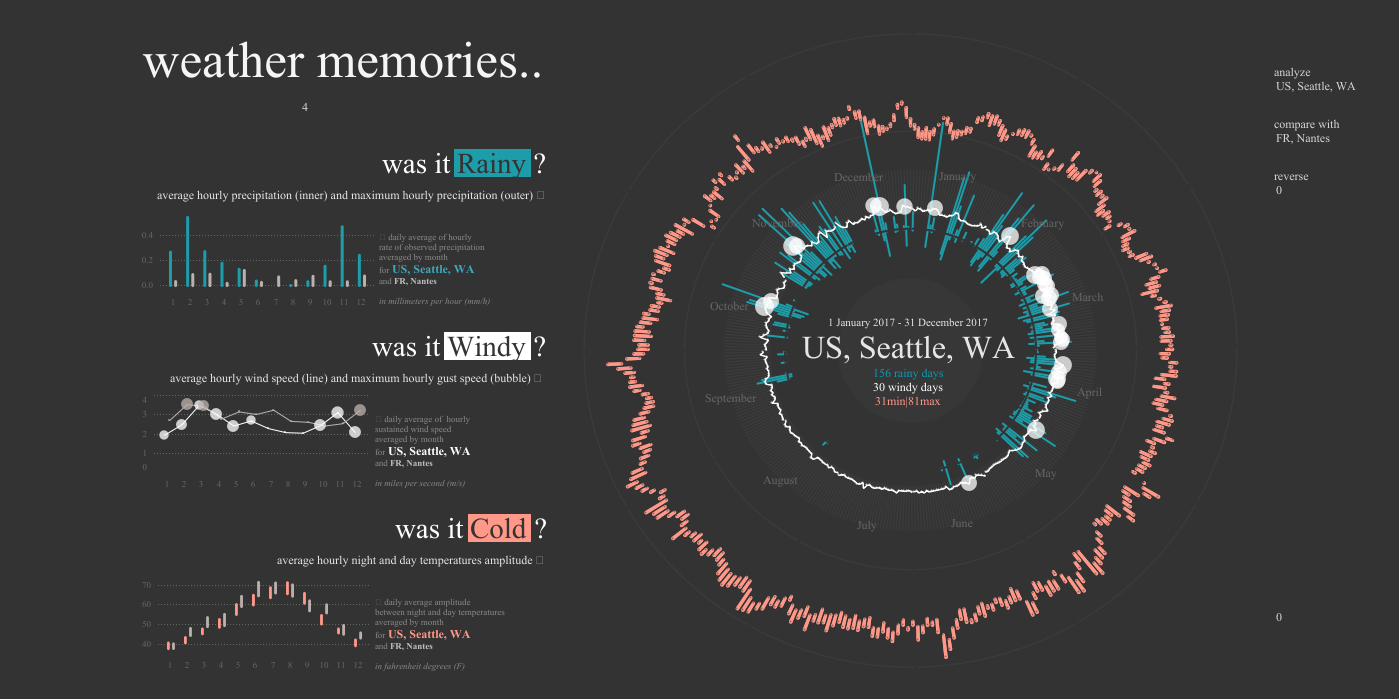
At the same time, all analytics is displayed through a beautiful and convenient BI-system. It allows you not only to build simple reporting, but also to create understandable and intuitive information panels (dashboards). And this is another argument why it is so important to make industrial data friends with analytical systems. For reasons of the NDA, we cannot show dashboards from this project, but for contrast we give public examples of approaches to visualizing BI systems and industrial systems.
Here's what BI reports might look like:
And here is the SCADA interface:
As part of the development of our platform, we are considering connecting predictive analytics, which reveals causal patterns. Different reasons lead to different scenarios. For example, poor quality of raw materials or improper adjustment of equipment after scheduled maintenance can lead to a decrease in the quality of the final product or equipment failure.
One of the key requirements for an analytics system is the speed at which information is received. This is the collection of telemetry from sensors and the calculation of indicators (plan / fact of aggregation indicators for the workshop) in near real-time mode. This allows you to adjust the operational management of production.
Something like this works in a brave new world. But in reality there are nuances.
How to reduce data from industrial systems (which nobody really collects) in a form convenient for data analytics? One of the standard protocols for industrial data is OPC DA / HDA. It seems to be open, but only members of the consortium have access to its specifications. Membership in the consortium is expensive, and stable open implementations of this protocol do not exist.
In order to connect this and other industrial protocols with modern analytics systems , we create gateways for each protocol. This is done by a separate team of industrial solutions. The large number of numbers in the names of the protocols inspires them. The team has experience writing industrial connectors (for example, using the OPC DA / HDA protocol, using the PI SDK, etc.).
But to connect industrial protocols with the world of big data, we use Apache NiFi - a tool from the Hadoop ecosystem that allows you to implement integration in streaming processing mode.
By building this most important bridge between industry and analytics, we were able to solve the problem on the familiar Hadoop stack. In industrial projects, we most often use distributions of our domestic partner Arenadata. With Apache Phoenix, we select JDBC data using SQL. In recent versions, Phoenix has been well optimized for working with the time series that always appears in industrial projects.
We were able to close the complex analytical system with the products of one vendor, which is important when it comes to enterprise solutions. Apache Spark is used to calculate settings (deviations in equipment operating modes), calculated indicators and other KPIs - a component for performing distributed calculations in near real-time mode within the Hadoop ecosystem.
Alas, industrial protocols are complicated. For the first time, when we planned to do integration with PI, we hoped that we would take its standard JDBC interface and we would have simple and quick happiness. And when they started working with the interface, it turned out that its bandwidth was not enough even to load current data. Not to mention downloading the story. But the connector has its own internal SDK API, which can quickly work with data. So we wrote a special gateway on this API and solved the problem.
We approached the solution of this problem in such a way that in the end we get the presentation of the periods of deviations in the form of a showcase. To do this, it was necessary to calculate how many times and when the indicators went beyond the norm. If you analyze the whole story in search of deviations, it will require a lot of resources. So we just went through a series of values, comparing each subsequent and previous. If both are normal / not normal - there is no deviation / it continues. If one of the two is not normal - we count, respectively, the beginning or end of the deviation. So we were able to save computing power when creating a showcase with statistics for analysts and technologists.
The purpose of these projects in industry is not only to make everything beautiful and clear, but also to prepare an analytical platform for production, go to a digital enterprise, where it is possible to collect and analyze all events in one place.
As for the described platform, it is useful for several departments at once. We have solved the problem of the people who manage the production. If earlier operators could not respond to minor deviations in equipment operation, now they have to report to the management for each non-compliance with the norm. This provides value at the moment. We gave digitizers and R&D services a convenient source of information on production, which allows us to analyze any events for any period of time - this will provide value in the future.
Now we are actively engaged in the development of such technological platforms, experimenting with implementation. In general, we strive to push the industry away from manual control to automate production control, as in the factories of Ilon Mask.
We will be happy to talk with everyone - both with the developers and architects of big data (whom we can invite to our team), and with digitalisers, production managers, tell them about our experience and offer options for working together. For everyone, we hold big data-meetings, at which we are happy to discuss all issues and suggestions.
My mail is EOsipov@croc.ru
You read a miniature about the conflict of two worlds - industry and analytics. We are just from the last, and here’s how it looks for us: on the one hand, data exchange protocols with a large number of digits in the name that were created for equipment management and inaccessible to ordinary mortals. On the other - analytical systems, beautiful reporting, convenient dashboards and other amenities.
Not every production has reached a high technological level. But everyone needs help. In the photo a frame from the film "Plant".
In this post, we will tell you how we try to fashion a human face (by the standards of a simple data scientist) - to enable business analysts to process industrial data and use beautiful BI reporting.
What do we have now
Recently, we were visiting a gas processing company. The company is large, it combines several plants. We went into the control room. Everything is very well equipped there: each dispatcher has 6-8 monitors, and there are huge plasma on the walls. That's just the contents of these plasmas ... leaves much to be desired. A strange-looking map, stupid arrows, on top of this windows from Windows, which survived the terrible torture and show some numbers.
“Why is it so vyrviglazny?” - we ask. “This is the best we can squeeze out of our industrial systems,” we hear in response. The response time of the dispatcher to an incident usually should not exceed 30 seconds, but with such an interface it is not easy to meet. No BI here and does not smell.
Another non-interface story. Data Scientists come to the plant and say: “Give these data about your installation, and we can predict problems in it with 95% accuracy.” Well, at least they promise so. They nod at the factory, and for data scientists the script begins in the best traditions of Kafka. Spot data collection. According to a hundred systems. For each need to write five statements. Attach a personal biography and pedigree to the fifth knee. Pass all analyzes, attach them to an essay on a free topic and catch the good mood of the boss. And only then can we count on success. More precisely, hope.
Factory analytics
To solve problems like those described above, you need to make industry friends with analytics. To do this, we are building a single system with integrated architecture. Such a system can work with completely different types of data and solve analytical problems on their basis. We are building a system with an integrated architecture , and not something universal, because universal systems solve any problems equally badly. In a complex architecture, we combine analytics tools of different types of data. Here's what it might look like:
There are many types of data in production. There are classic relational data from business systems and accounting systems. There is data from equipment sensors - time series. There are events from video analytics - they are put into a dataleyk and integrated monitoring is done on them (now this is a popular topic). There are logs from business systems that need to be indexed for further processing (we use Apache Solr) to get a real picture of what is happening in the production taking into account surveillance cameras and to evaluate how operators respond to certain events. And that's not all, each production has its own combination of requirements. And in the end, all work with data should be connected within a single ecosystem, which will allow collecting data in a centralized repository with flexible access settings and common analysis tools.
Recently we had a project: to organize monitoring of the technological regime of the plant, as well as the quality of raw materials. The monitoring system must monitor in real time all the important indicators and compare them with the standards using very original formulas. We take laboratory analyzes of raw materials from one database, and equipment performance indicators from another.
As a result, the operator gets a comprehensive picture of what is happening in his installation: what you need to pay attention to, is it worth stopping the work and how serious is everything. For each deviation from the normative work, the operator must fix the cause of the failure. Thus, the knowledge base on incidents has grown.
At the same time, all analytics is displayed through a beautiful and convenient BI-system. It allows you not only to build simple reporting, but also to create understandable and intuitive information panels (dashboards). And this is another argument why it is so important to make industrial data friends with analytical systems. For reasons of the NDA, we cannot show dashboards from this project, but for contrast we give public examples of approaches to visualizing BI systems and industrial systems.
Here's what BI reports might look like:
And here is the SCADA interface:
As part of the development of our platform, we are considering connecting predictive analytics, which reveals causal patterns. Different reasons lead to different scenarios. For example, poor quality of raw materials or improper adjustment of equipment after scheduled maintenance can lead to a decrease in the quality of the final product or equipment failure.
One of the key requirements for an analytics system is the speed at which information is received. This is the collection of telemetry from sensors and the calculation of indicators (plan / fact of aggregation indicators for the workshop) in near real-time mode. This allows you to adjust the operational management of production.
Something like this works in a brave new world. But in reality there are nuances.
Industrial data analysis, or the headache of business intelligence in production
How to reduce data from industrial systems (which nobody really collects) in a form convenient for data analytics? One of the standard protocols for industrial data is OPC DA / HDA. It seems to be open, but only members of the consortium have access to its specifications. Membership in the consortium is expensive, and stable open implementations of this protocol do not exist.
In order to connect this and other industrial protocols with modern analytics systems , we create gateways for each protocol. This is done by a separate team of industrial solutions. The large number of numbers in the names of the protocols inspires them. The team has experience writing industrial connectors (for example, using the OPC DA / HDA protocol, using the PI SDK, etc.).
But to connect industrial protocols with the world of big data, we use Apache NiFi - a tool from the Hadoop ecosystem that allows you to implement integration in streaming processing mode.
By building this most important bridge between industry and analytics, we were able to solve the problem on the familiar Hadoop stack. In industrial projects, we most often use distributions of our domestic partner Arenadata. With Apache Phoenix, we select JDBC data using SQL. In recent versions, Phoenix has been well optimized for working with the time series that always appears in industrial projects.
We were able to close the complex analytical system with the products of one vendor, which is important when it comes to enterprise solutions. Apache Spark is used to calculate settings (deviations in equipment operating modes), calculated indicators and other KPIs - a component for performing distributed calculations in near real-time mode within the Hadoop ecosystem.
Nuances
Alas, industrial protocols are complicated. For the first time, when we planned to do integration with PI, we hoped that we would take its standard JDBC interface and we would have simple and quick happiness. And when they started working with the interface, it turned out that its bandwidth was not enough even to load current data. Not to mention downloading the story. But the connector has its own internal SDK API, which can quickly work with data. So we wrote a special gateway on this API and solved the problem.
We approached the solution of this problem in such a way that in the end we get the presentation of the periods of deviations in the form of a showcase. To do this, it was necessary to calculate how many times and when the indicators went beyond the norm. If you analyze the whole story in search of deviations, it will require a lot of resources. So we just went through a series of values, comparing each subsequent and previous. If both are normal / not normal - there is no deviation / it continues. If one of the two is not normal - we count, respectively, the beginning or end of the deviation. So we were able to save computing power when creating a showcase with statistics for analysts and technologists.
Prospects
The purpose of these projects in industry is not only to make everything beautiful and clear, but also to prepare an analytical platform for production, go to a digital enterprise, where it is possible to collect and analyze all events in one place.
As for the described platform, it is useful for several departments at once. We have solved the problem of the people who manage the production. If earlier operators could not respond to minor deviations in equipment operation, now they have to report to the management for each non-compliance with the norm. This provides value at the moment. We gave digitizers and R&D services a convenient source of information on production, which allows us to analyze any events for any period of time - this will provide value in the future.
Now we are actively engaged in the development of such technological platforms, experimenting with implementation. In general, we strive to push the industry away from manual control to automate production control, as in the factories of Ilon Mask.
We will be happy to talk with everyone - both with the developers and architects of big data (whom we can invite to our team), and with digitalisers, production managers, tell them about our experience and offer options for working together. For everyone, we hold big data-meetings, at which we are happy to discuss all issues and suggestions.
My mail is EOsipov@croc.ru
All Articles