Guess me if you can: predicting a movie's rating before its release
Recently I came across a Kaggle dataset with data on 45 thousand films from Full MovieLens Dataset. The data contained not only information about the actors, the film crew, the plot, etc., but also the ratings put up by the users of the films for films (26 million ratings from 270 thousand users).
A standard task for such data is a recommender system. But for some reason, it occurred to me to predict the rating of a film based on the information available before its release . I am not a connoisseur of cinema, and therefore usually focus on reviews, choosing what to see from the news. But reviewers are also somewhat biased - they watch a lot more different films than the average viewer. Therefore, it seemed interesting to predict how the film would be appreciated by the general public.
So, the data set contains the following information:
The code used in the article (python) is available on github .
The full array contains data on more than 45 thousand films, but since the task is to predict the rating, you need to make sure that the ratings of a particular film are objective. For example, in the fact that quite a lot of people appreciated it.
Most films have very few ratings:

By the way, the film with the largest number of ratings (14075) surprised me - this is “Inception” . But the next three - “The Dark Knight”, “Avatar” and “Avengers” look quite logical.
It is expected that the number of ratings and the budget of the film are interconnected (lower budget - lower ratings). Therefore, the removal of films with a small number of ratings makes the biased model towards more expensive films:
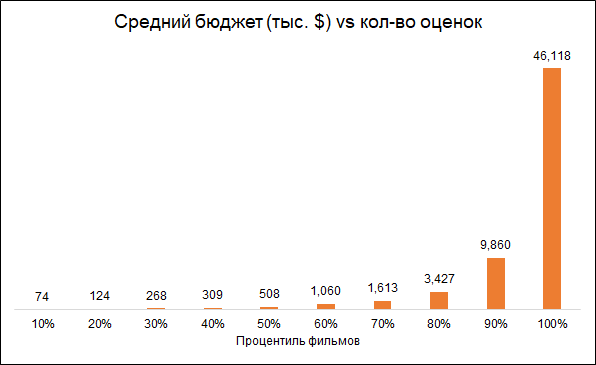
We leave for analysis films with 50+ ratings.
In addition, we will remove films released before the start of the rating service (1996). Here the problem is that modern films are rated on average worse than old ones, simply because among old films they watch and evaluate the best, but among modern ones that's all.
As a result, the final array contains about 6 thousand films.
We will use several groups of features:
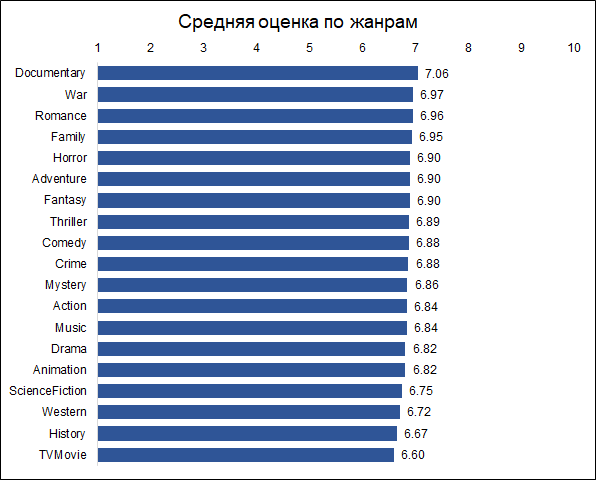
Documentary films receive the highest ratings. This is a good reason to note that different films are evaluated by different people, and if documentaries were rated by action fans, then the results would be different. That is, the estimates are biased due to the initial preferences of the public. But for our task this is not important, since we want to predict not conditionally objective assessment (as if each viewer had watched all the films), namely the one that will be given to the film by its audience.
By the way, it is interesting that historical films are rated much lower than documentaries.
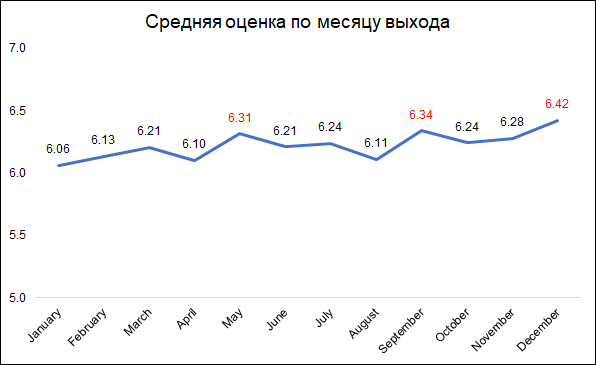
The highest ratings are given to films released in December, September and May.
This can probably be explained as follows:
Movie rating is little dependent on budget
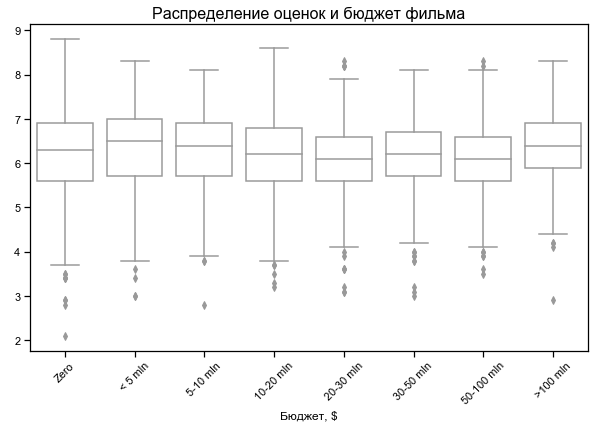
Zero budget for some films - probably no data
Top rated shortest and longest films
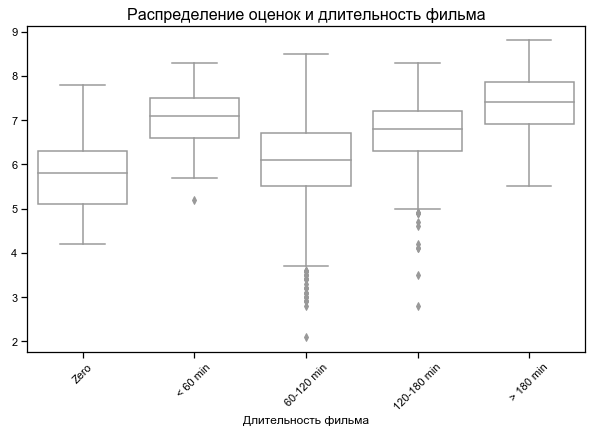
For some films, zero duration is indicated - probably no data
Our task - forecasting the rating - the task of regression. We will test three models - linear regression (like baseline), SVM and XGB. As a quality metric, we choose RMSE. The graph below shows the RMSE values on the validation set for different models and different sets of features (I wanted to understand whether it was worth messing with keywords and with Oscars). All models are built with basic values of hyperparameters.
As you can see, XGB has the best result with a full set of features (film metadata + keywords + Oscars).
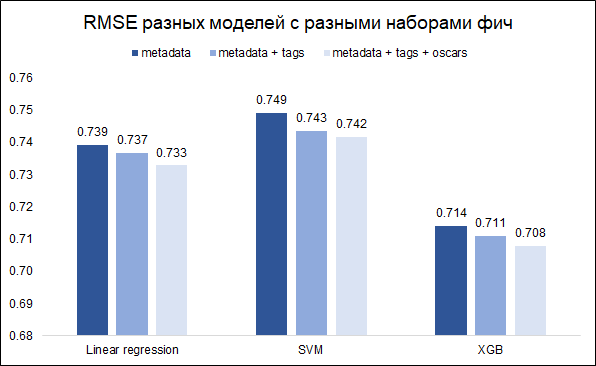
By tuning hyperparameters, it was possible to reduce RMSE from 0.708 to 0.706
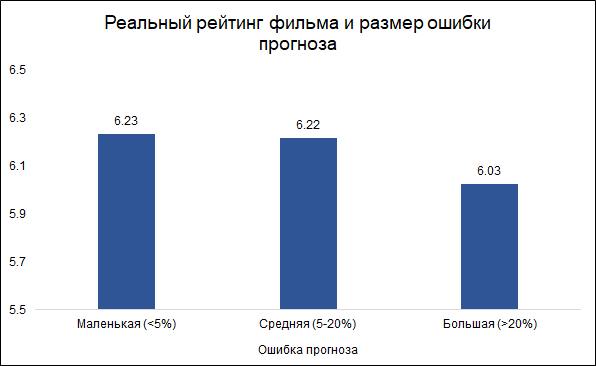
We assume that errors of less than 5% are small (about a third of them), and errors of more than 20% are large (about 10% of these). In other cases (slightly more than half), we will consider the error to be average.
Interestingly, the size of the error and the rating of the film are related: the model is less likely to make mistakes on good films and more often on bad ones. It looks logical: good films, like any other work, are rather made by more experienced and professional people. About the Tarantino film with the participation of Brad Pitt, you can even say in advance that most likely it will turn out to be good. At the same time, a low-budget film with little-known actors can be both good and bad, and it's hard to judge without seeing it.
Here are the most important features of the model (PCA variables refer to processed keywords that describe the plot of the film):

Two of these features belong to the Oscars, which were previously nominated by either team members (director, producer, screenwriter, cameraman), or films in which the actors starred. As mentioned above, the forecast error is associated with the evaluation of the film, and in this sense, previous nominations for the Oscars can be a good delimiter for the model. Indeed, films that have at least one Oscar nomination (among actors or teams) have an average forecast error of 8.3%, and those that do not have such nominations - 9.8%. Of the top 10 features used in the model, it is the Oscar nominations that give the best connection with the size of the error.
Therefore, the idea came up to build two separate models: one for films in which the actors or team were nominated for an Oscar, and the second for the rest. The idea was that this could reduce the overall error. However, the experiment failed: the general model gave RMSE 0.706, and two separate ones gave 0.715.
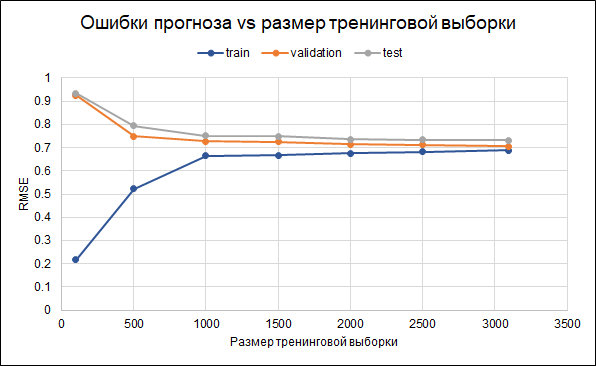
Therefore, we will leave the original model. The results of its accuracy are as follows: RMSE in the training sample - 0.688, in the validation sample - 0.706, and in the test sample - 0.732.
That is, there is some overfitting. Regularization parameters have already been set in the model itself. Another way to reduce overfitting could be to collect more data. To understand whether this will help, we will construct a graph of errors for different sizes of the training sample - from 100 to the maximum available 3 thousand. The graph shows that starting from about 2.5 thousand points in the training set, errors in the training, validation and test set change small, that is, an increase in the sample will not have a significant effect.
What else can you try to refine the model:
Interestingly, the biggest prediction error (7 forecast points instead of 4.2 real ones) was in the film “Batman and Robin” of 1997. The film with Arnold Schwarzenegger, George Clooney and Uma Thurman received 11 nominations (and one victory) for the Golden Raspberry Award, topped the list of 50 worst films in history from Empire newsreel, and led to the cancellation of the sequel and the restart of the entire series . Well, here the model, perhaps, was mistaken just like a man :)
A standard task for such data is a recommender system. But for some reason, it occurred to me to predict the rating of a film based on the information available before its release . I am not a connoisseur of cinema, and therefore usually focus on reviews, choosing what to see from the news. But reviewers are also somewhat biased - they watch a lot more different films than the average viewer. Therefore, it seemed interesting to predict how the film would be appreciated by the general public.
So, the data set contains the following information:
- Information about the film: release time, budget, language, company and country of origin, etc. As well as the average rating (and we will predict it)
- Keywords (tags) about the plot
- Names of actors and crew
- Actually ratings (estimates)
The code used in the article (python) is available on github .
Data pre-filtering
The full array contains data on more than 45 thousand films, but since the task is to predict the rating, you need to make sure that the ratings of a particular film are objective. For example, in the fact that quite a lot of people appreciated it.
Most films have very few ratings:
By the way, the film with the largest number of ratings (14075) surprised me - this is “Inception” . But the next three - “The Dark Knight”, “Avatar” and “Avengers” look quite logical.
It is expected that the number of ratings and the budget of the film are interconnected (lower budget - lower ratings). Therefore, the removal of films with a small number of ratings makes the biased model towards more expensive films:
We leave for analysis films with 50+ ratings.
In addition, we will remove films released before the start of the rating service (1996). Here the problem is that modern films are rated on average worse than old ones, simply because among old films they watch and evaluate the best, but among modern ones that's all.
As a result, the final array contains about 6 thousand films.
Used features
We will use several groups of features:
- Film metadata: whether the film belongs to the “collection” (series of films), country of release, manufacturing company, language of the film, budget, genre, year and month of release of the film, its duration
- Keywords: for each film there is a list of tags describing its plot. Since there are many words, they were processed as follows: grouped into similarity groups (for example, accident and car accident), based on these groups and individual words, a PCA analysis was made, and the most important components were selected from its results. This reduced the dimension of feature space.
- Previous “merits” of the actors who starred in the film. For each actor, a list of films was formed in which he starred earlier and the rating of these films was calculated. So for each film an indicator has been formed that aggregates the success of films in which the actors starred earlier.
- Oscars. If the actors, director, producer, screenwriter or cameraman previously participated in the film, which was nominated or received an Oscar for the best film, direction or screenplay, this was taken into account in the model. In addition, if the actors were nominees or winners of the Academy Award for Best Supporting Actor or Supporting Role, this was also taken into account. Information about the Oscars received from Wikipedia.
Some interesting statistics
Documentary films receive the highest ratings. This is a good reason to note that different films are evaluated by different people, and if documentaries were rated by action fans, then the results would be different. That is, the estimates are biased due to the initial preferences of the public. But for our task this is not important, since we want to predict not conditionally objective assessment (as if each viewer had watched all the films), namely the one that will be given to the film by its audience.
By the way, it is interesting that historical films are rated much lower than documentaries.
The highest ratings are given to films released in December, September and May.
This can probably be explained as follows:
- in December, companies release the best films to collect box office during the Christmas holidays
- in September, films will be released that will participate in the struggle for the Oscar
- May is the release time for summer blockbusters.
Movie rating is little dependent on budget
Zero budget for some films - probably no data
Top rated shortest and longest films
For some films, zero duration is indicated - probably no data
Results on different feature sets
Our task - forecasting the rating - the task of regression. We will test three models - linear regression (like baseline), SVM and XGB. As a quality metric, we choose RMSE. The graph below shows the RMSE values on the validation set for different models and different sets of features (I wanted to understand whether it was worth messing with keywords and with Oscars). All models are built with basic values of hyperparameters.
As you can see, XGB has the best result with a full set of features (film metadata + keywords + Oscars).
By tuning hyperparameters, it was possible to reduce RMSE from 0.708 to 0.706
Error analysis and final comments
We assume that errors of less than 5% are small (about a third of them), and errors of more than 20% are large (about 10% of these). In other cases (slightly more than half), we will consider the error to be average.
Interestingly, the size of the error and the rating of the film are related: the model is less likely to make mistakes on good films and more often on bad ones. It looks logical: good films, like any other work, are rather made by more experienced and professional people. About the Tarantino film with the participation of Brad Pitt, you can even say in advance that most likely it will turn out to be good. At the same time, a low-budget film with little-known actors can be both good and bad, and it's hard to judge without seeing it.
Here are the most important features of the model (PCA variables refer to processed keywords that describe the plot of the film):
Two of these features belong to the Oscars, which were previously nominated by either team members (director, producer, screenwriter, cameraman), or films in which the actors starred. As mentioned above, the forecast error is associated with the evaluation of the film, and in this sense, previous nominations for the Oscars can be a good delimiter for the model. Indeed, films that have at least one Oscar nomination (among actors or teams) have an average forecast error of 8.3%, and those that do not have such nominations - 9.8%. Of the top 10 features used in the model, it is the Oscar nominations that give the best connection with the size of the error.
Therefore, the idea came up to build two separate models: one for films in which the actors or team were nominated for an Oscar, and the second for the rest. The idea was that this could reduce the overall error. However, the experiment failed: the general model gave RMSE 0.706, and two separate ones gave 0.715.
Therefore, we will leave the original model. The results of its accuracy are as follows: RMSE in the training sample - 0.688, in the validation sample - 0.706, and in the test sample - 0.732.
That is, there is some overfitting. Regularization parameters have already been set in the model itself. Another way to reduce overfitting could be to collect more data. To understand whether this will help, we will construct a graph of errors for different sizes of the training sample - from 100 to the maximum available 3 thousand. The graph shows that starting from about 2.5 thousand points in the training set, errors in the training, validation and test set change small, that is, an increase in the sample will not have a significant effect.
What else can you try to refine the model:
- Initially, films are selected differently (different limit on the number of votes, additional limits on other variables)
- Not all ratings are used to calculate the rating - it is possible to select more active users or remove those who give only bad ratings
- Try different ways of replacing missing data
Interestingly, the biggest prediction error (7 forecast points instead of 4.2 real ones) was in the film “Batman and Robin” of 1997. The film with Arnold Schwarzenegger, George Clooney and Uma Thurman received 11 nominations (and one victory) for the Golden Raspberry Award, topped the list of 50 worst films in history from Empire newsreel, and led to the cancellation of the sequel and the restart of the entire series . Well, here the model, perhaps, was mistaken just like a man :)
All Articles