Flow Protocols as a Tool for Monitoring Internal Network Security
When it comes to monitoring the security of an internal corporate or departmental network, many have an association with the control of information leaks and the implementation of DLP solutions. And if you try to clarify the question and ask how you detect attacks on the internal network, the answer will usually be the mention of intrusion detection systems (IDS). And what was the only option 10-20 years ago, today is becoming an anachronism. There is a more effective, and in some places the only possible option for monitoring the internal network - to use flow protocols that were originally designed to search for network problems (troubleshooting), but eventually transformed into a very interesting security tool. We’ll talk about what flow protocols are and which ones help to detect network attacks better, where it is best to implement flow monitoring, what to look for when deploying such a scheme, and even how to “pick it up” on domestic equipment as part of this article.
I will not dwell on the question “Why do we need security monitoring of the internal infrastructure?” The answer seems to be clear. But if, nevertheless, you would like to make sure once again that there’s nowhere without it, watch a short video with a story about how you can get into the corporate network protected by a firewall in 17 ways. Therefore, we will assume that we understand that internal monitoring is a necessary thing and it remains only to understand how it can be organized.
I would single out three key data sources for monitoring infrastructure at the network level:
Capturing raw traffic is the most popular option among security guards, because it historically appeared the very first one. Conventional network-based attack detection systems (the very first commercial attack detection system was WheelR's NetRanger, purchased in 1998 by Cisco) were just in the business of capturing packets (and later sessions) that searched for specific signatures (“decisive rules” in FSTEC terminology), signaling attacks. Of course, you can analyze raw traffic not only using IDS, but also using other tools (for example, Wireshark, tcpdum or NBAR2 functionality in Cisco IOS), but they usually lack a knowledge base that distinguishes an information security tool from a regular IT tool.
So, attack detection systems. The oldest and most popular method of detecting network attacks, which copes well with its task on the perimeter (no matter what - corporate, data center, segment, etc.), but passes in modern dial-up and software-defined networks. In the case of a network built on the basis of conventional switches, the infrastructure of attack detection sensors becomes too large - you will have to put a sensor on each connection to the host whose attacks you want to monitor. Any manufacturer, of course, will be happy to sell you hundreds and thousands of sensors, but I think your budget can not withstand such costs. I can say that even at Cisco (and we are the developers of NGIPS) we were not able to do this, although it would seem that the price issue is before us. should not stand - this is our own decision. In addition, the question arises, but how to connect the sensor in this embodiment? To the gap? And if the sensor itself is disabled? Require a bypass module in the sensor? Use tap splitters? All this makes the solution more expensive and makes it unbearable for a company of any scale.
You can try to “hang” the sensor on the SPAN / RSPAN / ERSPAN port and direct traffic to it from the necessary ports on the switch. This option partially removes the problem described in the previous paragraph, but poses a different one - the SPAN port cannot accept absolutely all the traffic that will be sent to it - it will not have enough bandwidth. Snuggle up something to sacrifice. Either leave part of the nodes unmonitored (then you need to prioritize them first), or route not all traffic from the node, but only a certain type. In any case, we can skip some attacks. In addition, the SPAN port can be occupied for other needs. As a result, we will have to revise the existing network topology and, possibly, make adjustments to it to cover your network to the maximum with the number of sensors you have (and coordinate this with IT).
And if your network uses asymmetric routes? And if you have implemented or plan to introduce SDN? And if you need to monitor virtualized machines or containers whose traffic does not reach the physical switch at all? Manufacturers of traditional IDS do not like these questions because they do not know how to answer them. Perhaps they will incline you to the fact that all these fashionable technologies are hype and you do not need it. Perhaps they will talk about the need to start small. Or maybe they will say that you need to put a powerful thresher in the center of the network and direct all traffic to it using balancers. Whatever option you are offered, you need to clearly understand for yourself how much it suits you. And only after that make a decision on the choice of approach to monitoring information security of the network infrastructure. Returning to packet capture, I want to say that this method continues to be very popular and important, but its main purpose is border control; the boundaries between your organization and the Internet, the boundaries between the data center and the rest of the network, the boundaries between the process control system and the corporate segment. In these places, classic IDS / IPS still have a right to exist and do a good job of their tasks.

Let's move on to the second option. An analysis of events received from network devices can also be used to detect attacks, but not as the main mechanism, since it allows only a small class of intrusions to be detected. In addition, some reactivity is inherent in it - an attack must first occur, then it must be fixed by a network device, which in one way or another will signal a problem with information security. There are several ways. It can be syslog, RMON or SNMP. The last two protocols for network monitoring in the context of information security are applied only if we need to detect a DoS attack on the network equipment itself, since using RMON and SNMP, for example, we can monitor the load of the central processor of the device or its interfaces. This is one of the “cheapest” (everyone has syslog or SNMP), but also the most ineffective of all ways to monitor the information security of the internal infrastructure - many attacks are simply hidden from it. Of course, they should not be neglected and the same syslog analysis helps you to identify changes in the configuration of the device itself in time, it’s a compromise, but it is not very suitable to detect attacks on the entire network.
The third option is to analyze information about traffic passing through a device that supports one of several flow protocols. In this case, regardless of the protocol, the flow infrastructure necessarily consists of three components:
Do not think that such a three-tier architecture is too complicated - all other options (except, perhaps, network monitoring systems working with SNMP and RMON) also work according to it. We have a data generator for analysis, which is a network device or a stand-alone sensor. We have an alarm collection system and a management system for the entire monitoring infrastructure. The last two components can be combined within a single node, but in more or less large networks, they are usually separated by at least two devices in order to ensure scalability and reliability.

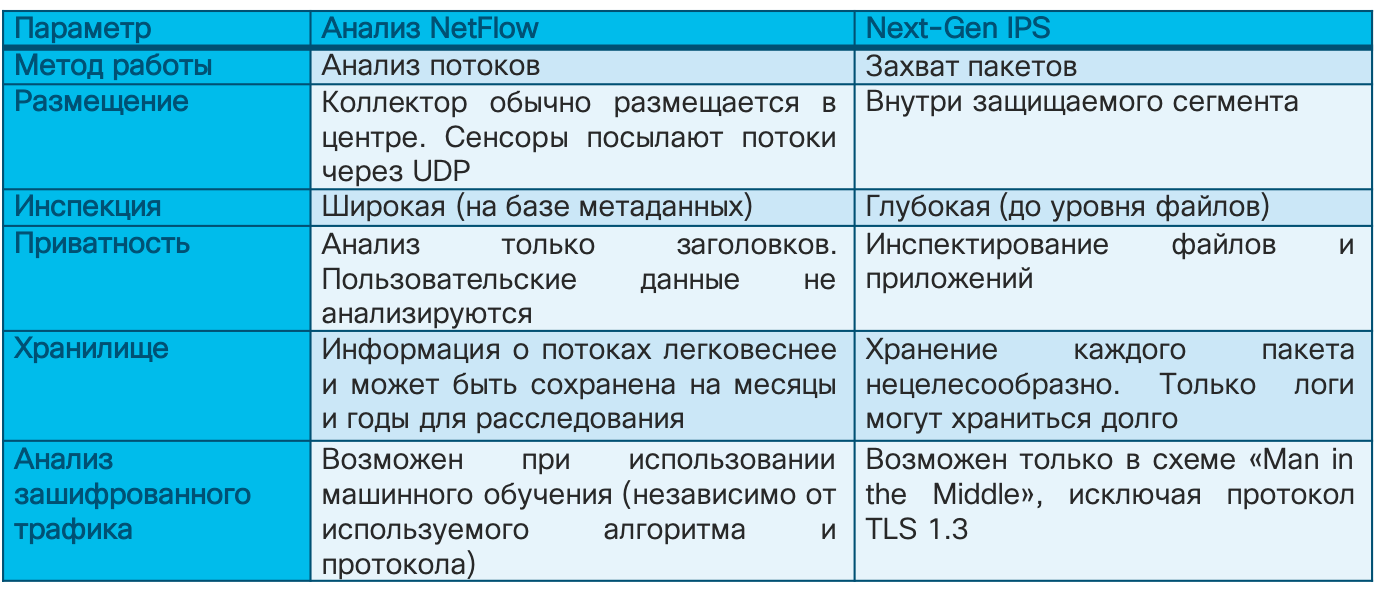
Unlike packet analysis, based on the study of the header and data body of each packet and the sessions consisting of them, the flow analysis relies on the collection of metadata about network traffic. When, how much, where and where, how ... these are the questions answered by the analysis of network telemetry using various flow protocols. Initially, they were used to analyze statistics and search for IT problems in the network, but then, with the development of analytical mechanisms, it became possible to apply them to the same telemetry and for security purposes. Here it is worth noting once again that stream analysis does not replace or cancel packet capture. Each of these methods has its own field of application. But in the context of this article, it is flow analysis that is best suited for monitoring internal infrastructure. You have network devices (and it doesn’t matter if they work in a software-defined paradigm or according to static rules) that the attack cannot pass. It can bypass the classic IDS sensor, but there is no network device that supports the flow protocol. This is the advantage of this method.
On the other hand, if you need evidence base for law enforcement agencies or your own incident investigation team, you cannot do without packet capture - network telemetry is not a copy of the traffic that can be used to collect evidence; it is needed for operational detection and decision-making in the field of information security. On the other hand, using telemetry analysis, you can “write” not all network traffic (if anything, then Cisco is involved in data centers :-), but only the one that is involved in the attack. Telemetry analysis tools in this regard will well complement traditional packet capture mechanisms, giving the command for selective capture and storage. Otherwise, you have to have a colossal storage infrastructure.
Imagine a network operating at a speed of 250 Mbps. If you want to save all this volume, then you will need 31 MB storage for one second of traffic transfer, 1.8 GB for one minute, 108 GB for one hour, and 2.6 TB for one day. To store daily data from a network with a bandwidth of 10 Gbit / s, you need 108 TB of storage. But some regulators require you to store safety data for years ... Recording “on demand”, which helps you implement flow analysis, helps reduce these values by orders of magnitude. By the way, if we talk about the ratio of the recorded volume of network telemetry data to the total data capture, then it is about 1 to 500. For the same values above, the storage of the full decryption of all daily traffic will be 5 and 216 GB, respectively (you can even write to a regular flash drive )
If the raw network data analysis tools have a method of capturing them that is almost the same as the vendor to the vendor, then the situation is different with the analysis of flows. There are several options for flow protocols, the differences in which you need to know in the security context. The most popular is the Netflow protocol developed by Cisco. There are several versions of this protocol that differ in their capabilities and the amount of information recorded about traffic. The current version is the ninth (Netflow v9), on the basis of which the industry standard Netflow v10, also known as IPFIX, was developed. Today, most network vendors support exactly Netflow or IPFIX in their equipment. But there are various other options for flow protocols - sFlow, jFlow, cFlow, rFlow, NetStream, etc., of which sFlow is more popular. It is he who is most often supported by domestic manufacturers of network equipment due to the ease of implementation. What are the key differences between Netflow, as a de facto standard, and sFlow? I would single out a few key ones. First, Netflow has user-defined fields as opposed to fixed fields in sFlow. And secondly, and this is the most important thing in our case, sFlow collects the so-called sampled telemetry; unlike unsampled in Netflow and IPFIX. What is the difference between them?

Imagine that you decided to read the book “ Security Operations Center: Building, Operating, and Maintaining your SOC ” by my colleagues - Gary McIntyre, Joseph Muniz and Nadef Alfardan (you can download part of the book from the link). You have three options to achieve your goal - to read the whole book, run it through the eyes, stopping at every 10th or 20th page, or try to find a retelling of key concepts in a blog or service such as SmartReading. So unsampled telemetry is reading every “page” of network traffic, that is, analyzing metadata for each packet. Sampling telemetry is a selective study of traffic in the hope that the selected samples will have what you need. Depending on the channel speed, the sampled telemetry will send for analysis every 64th, 200th, 500th, 1000th, 2000th or even 10000th packet.
In the context of information security monitoring, this means that sampled telemetry is well suited for detecting DDoS attacks, scanning, and spreading malicious code, but it can skip atomic or multi-packet attacks that did not fall into the sample sent for analysis. Unmeasured telemetry does not have such shortcomings. Using the range of detectable attacks is much wider. Here is a short list of events that can be detected using network telemetry analysis tools.

Of course, some open source Netflow analyzer will not allow you to do this, since its main task is to collect telemetry and conduct basic analysis on it from an IT point of view. To identify information security threats based on flow, it is necessary to equip the analyzer with various engines and algorithms that will identify cybersecurity problems on the basis of standard or custom Netflow fields, enrich standard data with external data from various sources of Threat Intelligence, etc.
Therefore, if you have a choice, then stop it on Netflow or IPFIX. But even if your equipment only works with sFlow, like domestic manufacturers, then even in this case you can benefit from it in the security context.

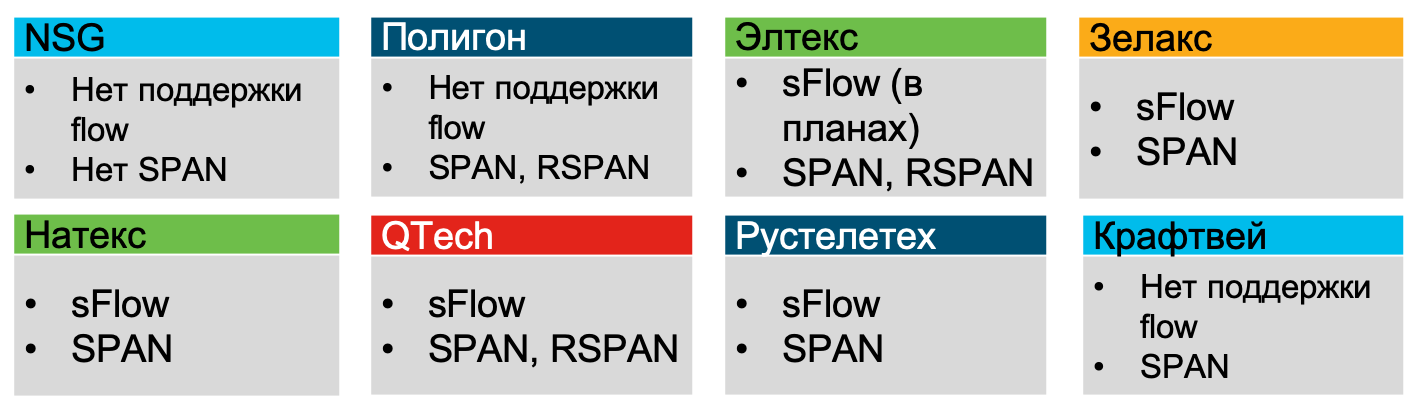
In the summer of 2019, I analyzed the opportunities that Russian manufacturers of networked hardware have, and all of them, excluding NSG, Polygon and Craftway, declared support for sFlow (at least Zelax, Natex, Eltex, QTech, Rusteletech).
The next question you will face is where to implement flow support for security purposes? In fact, the question is not entirely correct. On modern equipment, support for flow protocols is almost always there. Therefore, I would reformulate the question differently - where is the most effective way to collect telemetry from a security point of view? The answer will be quite obvious - at the access level, where you will see 100% of all traffic, where you will have detailed information on hosts (MAC, VLAN, interface ID), where you can even track P2P traffic between hosts, which is critical for detecting scans and and the spread of malicious code. At the kernel level, you may just not see part of the traffic, but at the perimeter level you will see well if a quarter of all your network traffic. But if, for some reason, extraneous devices are wound up on your network that allow attackers to “enter and exit,” bypassing the perimeter, then analyzing telemetry from it will not give you anything. Therefore, for maximum coverage, it is recommended to include telemetry collection at the access level. At the same time, it is worth noting that even if we are talking about virtualization or containers, flow support is also often found in modern virtual switches, which allows you to control traffic there.
But since I raised the topic, I need to answer the question, but what if, after all, the equipment, physical or virtual, does not support flow protocols? Or is its inclusion prohibited (for example, in industrial segments to ensure reliability)? Or its inclusion leads to high CPU utilization (this happens on outdated equipment)? To solve this problem, there are specialized virtual sensors (flow sensor), which are essentially ordinary splitters that pass traffic through themselves and transmit it in the form of flow to the collection module. True, in this case we get a whole bunch of problems that we talked about above in relation to packet capture tools. That is, one must understand not only the advantages of flow analysis technology, but also its limitations.
Another point that is important to remember when talking about flow analysis tools. If we apply the EPS metric (event per second, events per second) to conventional means of generating security events, then this indicator does not apply to telemetry analysis; it is replaced by FPS (flow per second, flow per second). As in the case of EPS, it cannot be calculated in advance, but you can estimate the approximate number of threads that a particular device generates depending on its task. On the Internet, you can find tables with approximate values for different types of corporate devices and conditions, which will allow you to figure out which licenses you need for analysis tools and what will be their architecture? The fact is that the IDS sensor is limited by a certain bandwidth, which it will “pull”, and the stream collector has its own limitations, which must be understood. Therefore, in large, geographically distributed networks, there are usually several reservoirs. When I described how the network inside Cisco is monitored , I already quoted the number of our collectors - there are 21. And this is a network scattered across five continents and numbering about half a million active devices).
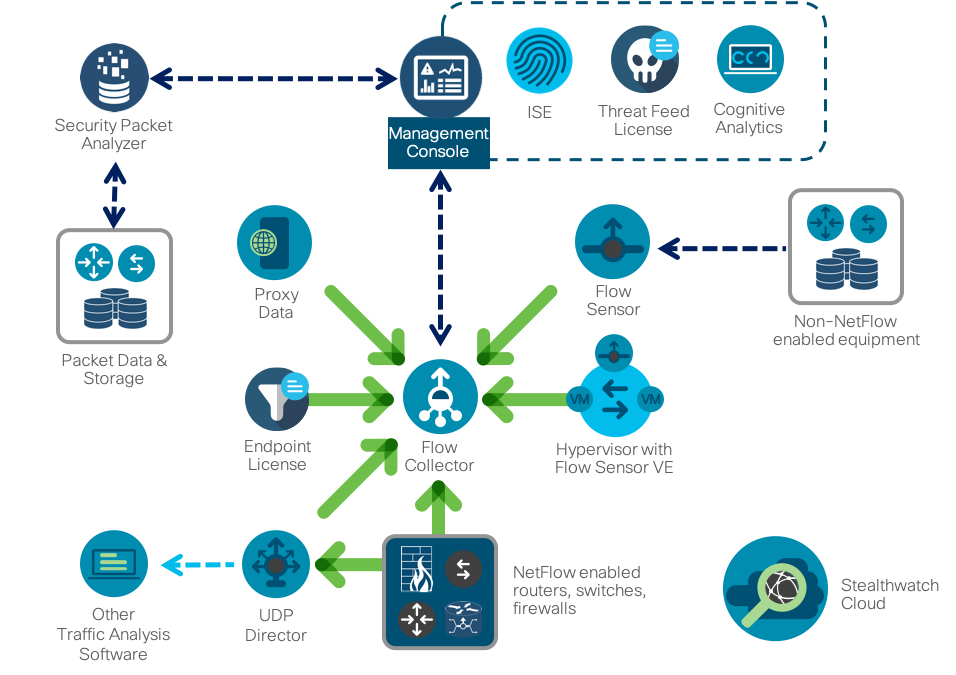
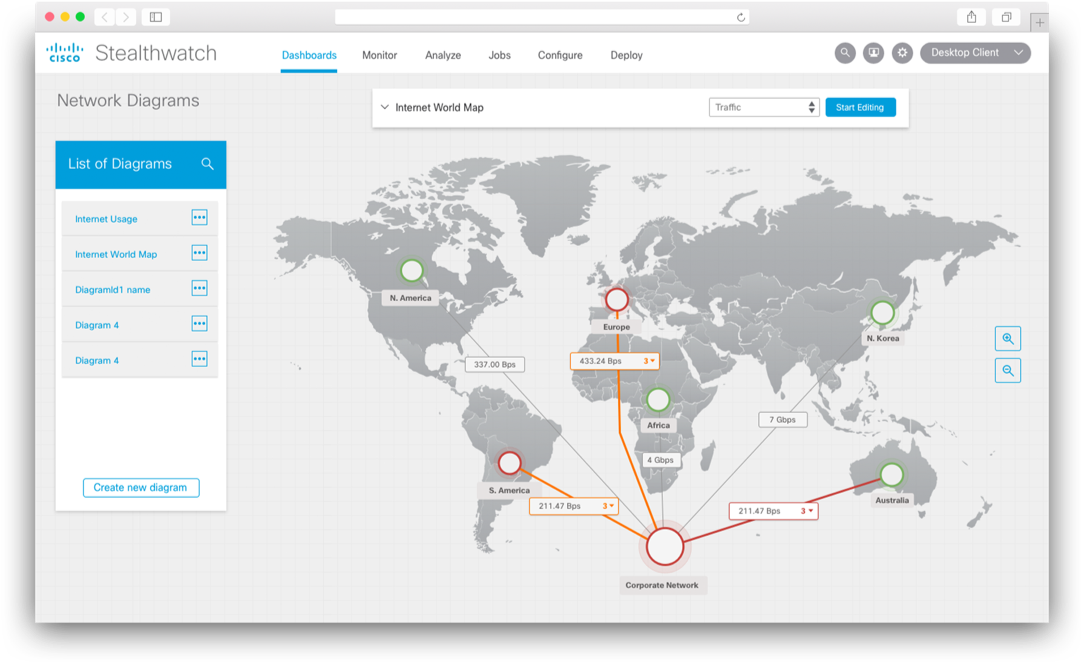
As a Netflow monitoring system, we use our own Cisco Stealthwatch solution , which is specifically focused on solving security problems. It has many built-in engines for detecting abnormal, suspicious and obviously malicious activity, which allows to detect a wide range of various threats - from crypto mining to information leaks, from the spread of malicious code to fraud. Like most flow analyzers, Stealthwatch is built according to a three-level scheme (generator - collector - analyzer), but it is supplemented by a number of interesting features that are important in the context of the material under consideration. First, it integrates with packet capture solutions (for example, Cisco Security Packet Analyzer), which allows you to record selected network sessions for further in-depth investigation and analysis. Secondly, specifically to expand security tasks, we developed a special protocol nvzFlow, which allows you to "translate" the activity of applications on end nodes (servers, workstations, etc.) into telemetry and transmit it to the collector for further analysis. If in its original version Stealthwatch works with any flow protocol (sFlow, rFlow, Netflow, IPFIX, cFlow, jFlow, NetStream) at the network level, then support for nvzFlow also allows correlation of data at the host level, thereby. increasing the efficiency of the entire system and seeing more attacks than conventional network flow analyzers.
It is clear that speaking of security analysis Netflow systems, the market is not limited to a single solution from Cisco. You can use both commercial and free or shareware solutions. Oddly enough, if I use the Cisco blog as an example of competing solutions, I’ll say a few words about how network telemetry can be analyzed using two popular, similar in name, but still different tools - SiLK and ELK.
SiLK is a set of tools (the System for Internet-Level Knowledge) for traffic analysis, developed by the American CERT / CC and which supports, in the context of today's article, Netflow (5th and 9th, the most popular versions), IPFIX and sFlow and using various utilities (rwfilter, rwcount, rwflowpack, etc.), perform various operations on network telemetry in order to detect signs of unauthorized actions in it. But there are a couple of important points to note. SiLK is a command-line tool and conduct operational analysis, all the time entering a command of the form (detection of ICMP packets larger than 200 bytes):
not very comfortable. You can use the iSiLK GUI, but it will not make your life much easier by solving only the visualization function, not the analyst’s replacement. And this is the second point. Unlike commercial solutions, which already have a solid analytical base, anomaly detection algorithms, workflow-related algorithms, etc., in the case of SiLK, you will have to do all this yourself, which will require you to have slightly different competencies than using already ready-to-use tools. This is bad and not bad - this is a feature of almost any free tool that comes from the fact that you know what to do, and it will only help you in this (commercial tools are less dependent on the competencies of its users, although it also assumes that analysts understand at least basics of network investigations and monitoring). But back to SiLK. The analyst’s work cycle with him is as follows:
This cycle will be applicable to the same Cisco Stealthwatch, only the last five steps will automate to the maximum, reducing the number of analyst errors and increasing the speed of incident detection. For example, in SiLK, you can enrich network statistics with external data on malicious IP using your own scripts, and in Cisco Stealthwatch, this is a built-in function that immediately displays an alarm if there is interaction with IP addresses from the black list in network traffic.
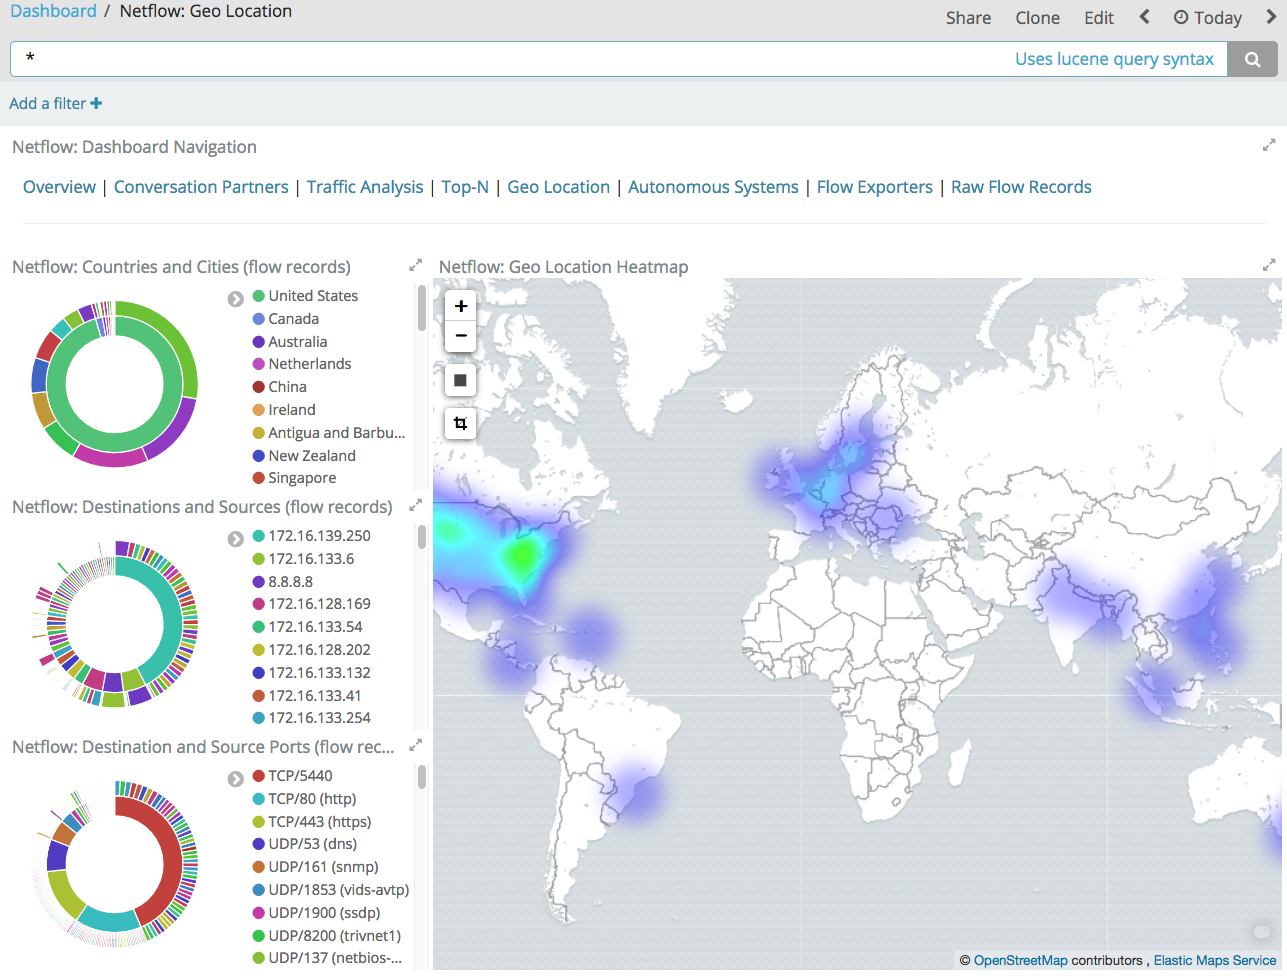
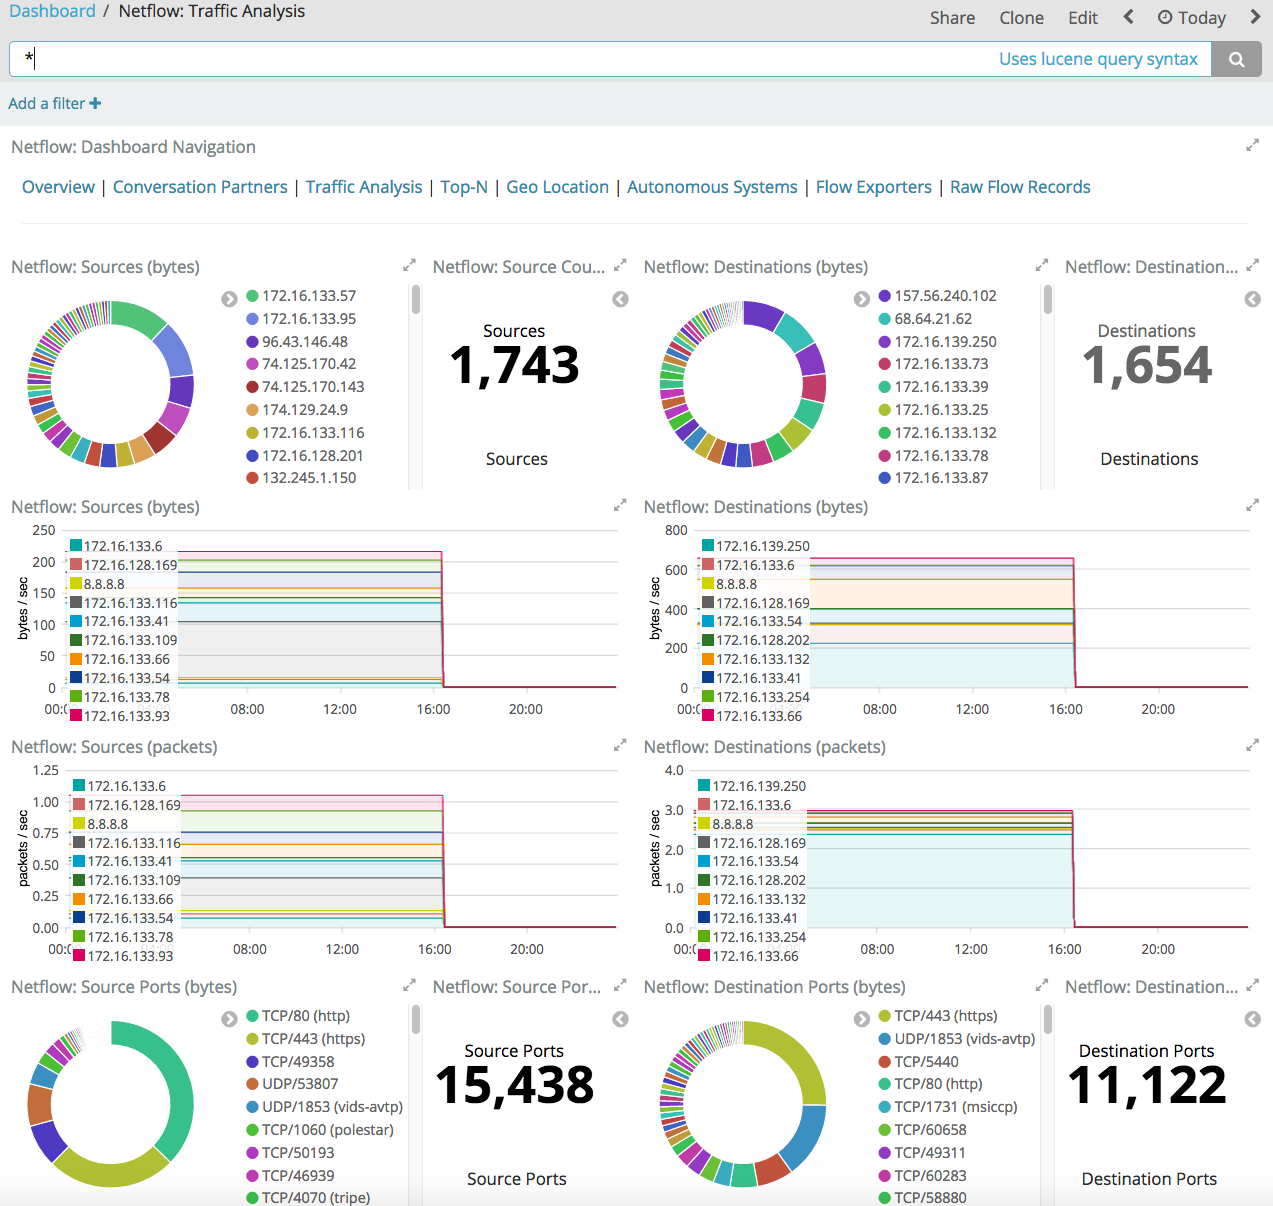
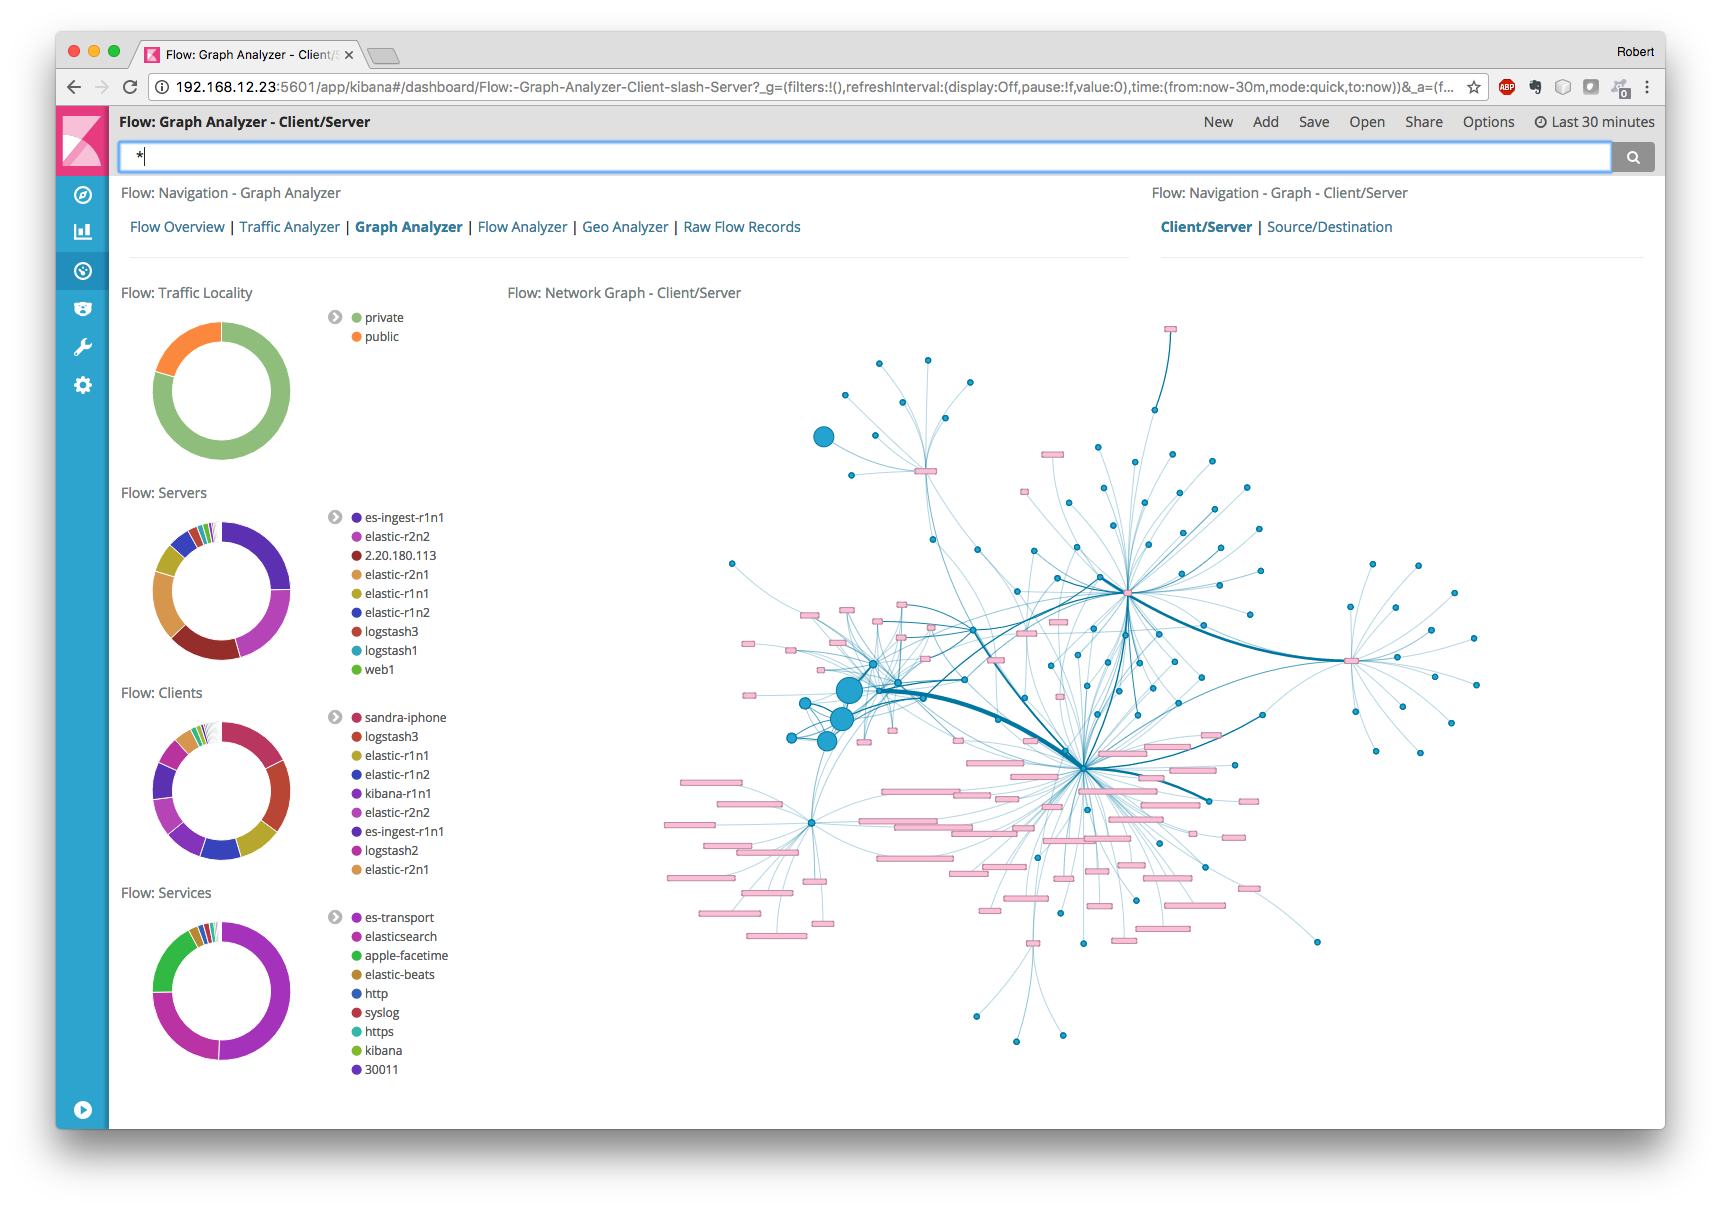
If we go higher in the “paid” pyramid for flow analysis software, then absolutely free SiLK will be followed by the shareware ELK, consisting of three key components - Elasticsearch (indexing, data search and analysis), Logstash (data input / output) and Kibana ( visualization). Unlike SiLK, where you have to write everything yourself, ELK already has many ready-made libraries / modules (some are paid, some are not) that automate the analysis of network telemetry. For example, the GeoIP filter in Logstash allows you to bind the observed IP addresses to their geographical location (for Stealthwatch, this is a built-in function).
ELK also has a fairly large community that is completing the missing components for this monitoring solution. For example, to work with Netflow, IPFIX, and sFlow, you can use the elastiflow module if you are not comfortable with the Logstash Netflow Module, which only supports Netflow.
Giving more efficiency in collecting flow and searching in it, ELK currently does not have rich built-in analytics for detecting anomalies and threats in network telemetry. That is, following the life cycle described above, you will have to independently describe the model of violations and then use it in the combat system (there are no built-in models there).
Of course, there are more sophisticated extensions for ELK that already contain some models for detecting anomalies in network telemetry, but such extensions cost money and the question is whether the game is worth the candle - write the same model yourself, buy its implementation for your monitoring tool or buy turnkey solution for the Network Traffic Analysis class.
In general, I do not want to go into the debate that it is better to spend money and buy a turnkey solution for monitoring anomalies and threats in network telemetry (for example, Cisco Stealthwatch) or figure it out on your own and spin the same SiLK, ELK or nfdump or OSU Flow Tools (for each new threat) ( I talked about the last two of them last time)? Everyone chooses for himself and everyone has his own motives to choose either of two options. I just wanted to show that network telemetry is a very important tool in ensuring the network security of your internal infrastructure and you should not neglect it so as not to replenish the list of the company whose name is mentioned in the media along with the epithets “hacked”, “not complying with information security requirements "," Thinking about the security of their data and customer data. "
Summing up, I would like to list the key tips that you should follow when building information security monitoring of your internal infrastructure:
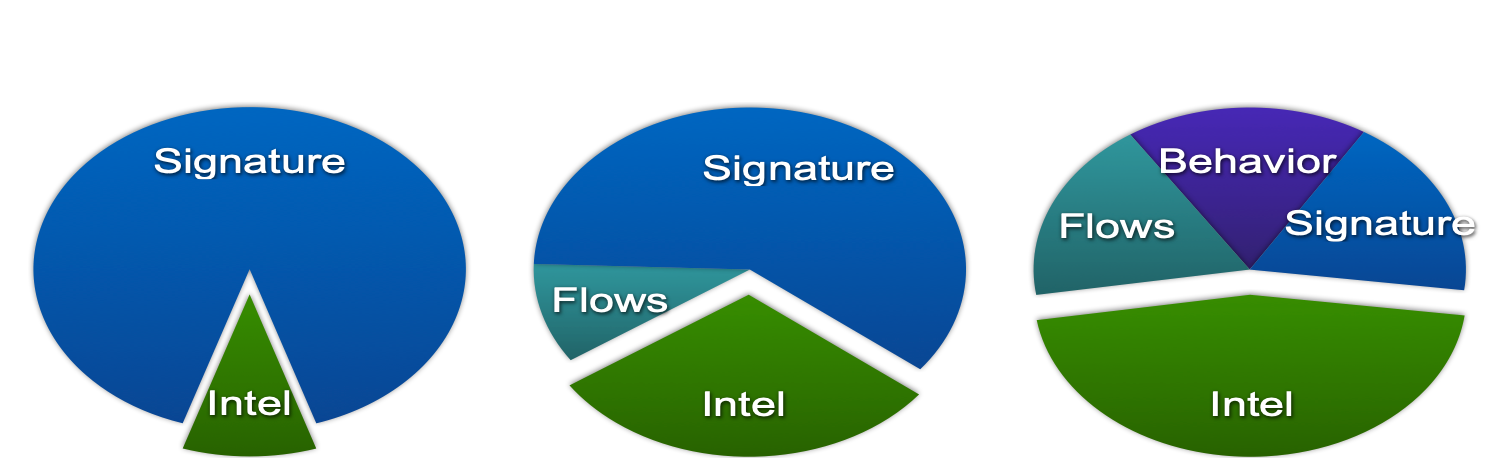
As for the last tip, I would like to give an illustration, which I have already cited earlier. You see that if earlier the Cisco IS service almost entirely built its IS monitoring system based on intrusion detection systems and signature methods, now they account for only 20% of incidents. Another 20% is accounted for by flow analysis systems, which suggests that these solutions are not a whim, but a real tool in the activity of information security services of a modern enterprise. Moreover, you have the most important thing for their implementation - network infrastructure, investments in which can be additionally protected by assigning IS monitoring functions to the network as well.
I deliberately did not touch on the topic of responding to anomalies or threats identified in network streams, but I think that it is already clear that monitoring should not be completed only by detecting a threat. It should be followed by a response and preferably in an automatic or automated mode. But this is the topic of a separate material.
Additional Information:
Threat. If it’s easier for you to listen to everything that was written above, then you can watch the hour-long presentation, which formed the basis of this note.
I will not dwell on the question “Why do we need security monitoring of the internal infrastructure?” The answer seems to be clear. But if, nevertheless, you would like to make sure once again that there’s nowhere without it, watch a short video with a story about how you can get into the corporate network protected by a firewall in 17 ways. Therefore, we will assume that we understand that internal monitoring is a necessary thing and it remains only to understand how it can be organized.
I would single out three key data sources for monitoring infrastructure at the network level:
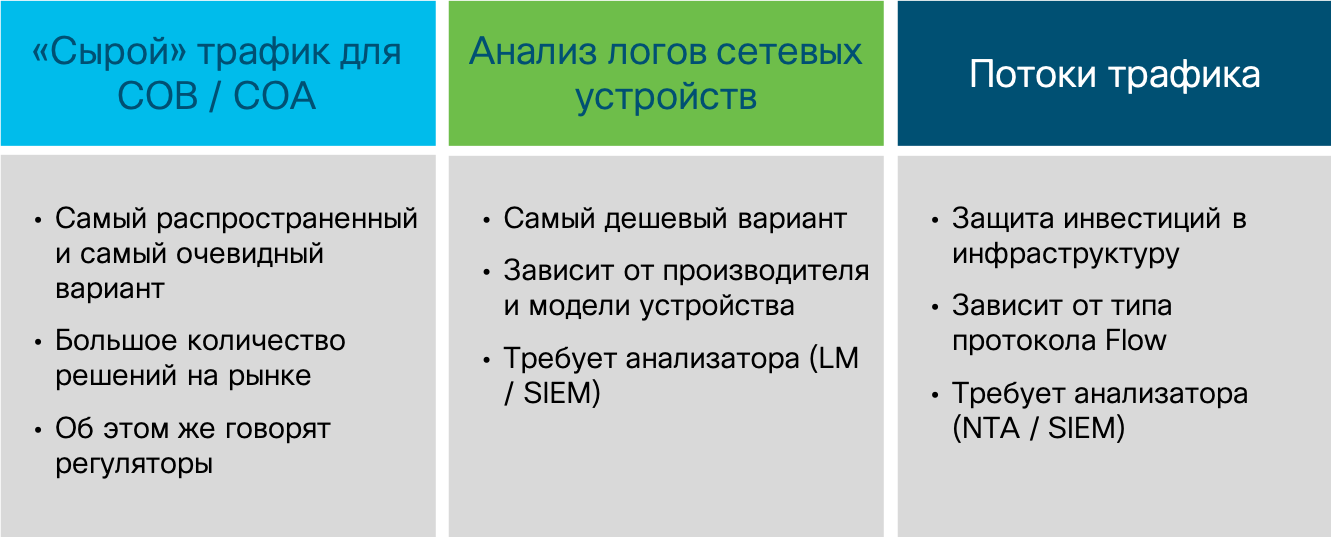
- “Raw” traffic, which we capture and submit for analysis to certain analysis systems,
- events from network devices through which traffic passes,
- traffic information received using one of the flow protocols.
Capturing raw traffic is the most popular option among security guards, because it historically appeared the very first one. Conventional network-based attack detection systems (the very first commercial attack detection system was WheelR's NetRanger, purchased in 1998 by Cisco) were just in the business of capturing packets (and later sessions) that searched for specific signatures (“decisive rules” in FSTEC terminology), signaling attacks. Of course, you can analyze raw traffic not only using IDS, but also using other tools (for example, Wireshark, tcpdum or NBAR2 functionality in Cisco IOS), but they usually lack a knowledge base that distinguishes an information security tool from a regular IT tool.
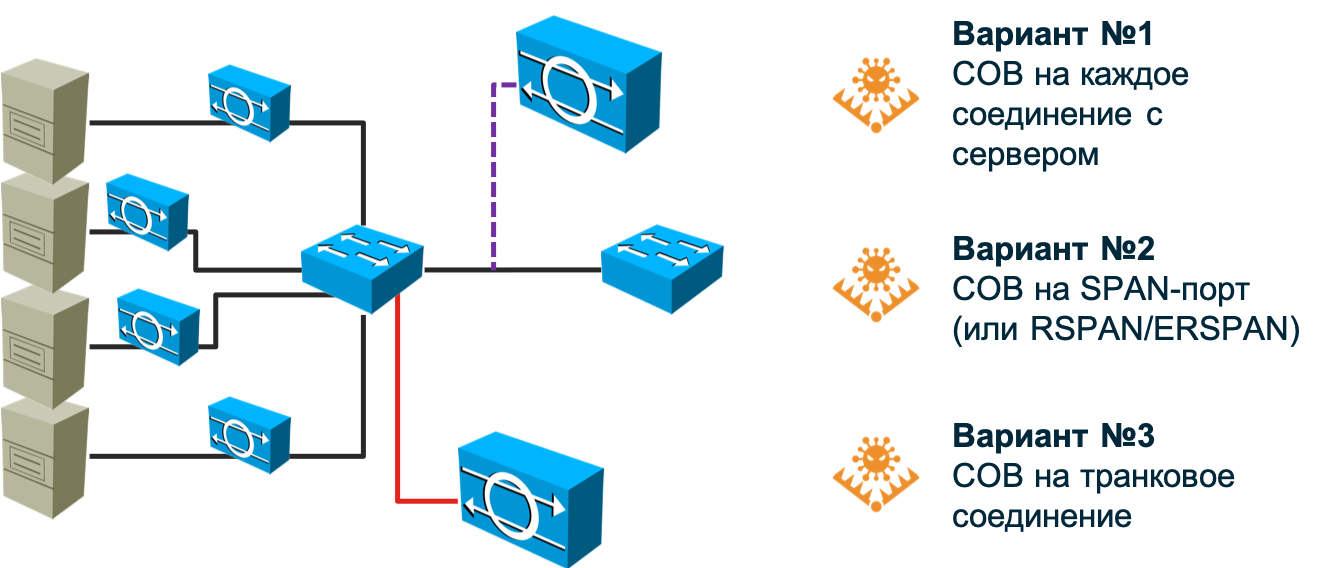
So, attack detection systems. The oldest and most popular method of detecting network attacks, which copes well with its task on the perimeter (no matter what - corporate, data center, segment, etc.), but passes in modern dial-up and software-defined networks. In the case of a network built on the basis of conventional switches, the infrastructure of attack detection sensors becomes too large - you will have to put a sensor on each connection to the host whose attacks you want to monitor. Any manufacturer, of course, will be happy to sell you hundreds and thousands of sensors, but I think your budget can not withstand such costs. I can say that even at Cisco (and we are the developers of NGIPS) we were not able to do this, although it would seem that the price issue is before us. should not stand - this is our own decision. In addition, the question arises, but how to connect the sensor in this embodiment? To the gap? And if the sensor itself is disabled? Require a bypass module in the sensor? Use tap splitters? All this makes the solution more expensive and makes it unbearable for a company of any scale.
You can try to “hang” the sensor on the SPAN / RSPAN / ERSPAN port and direct traffic to it from the necessary ports on the switch. This option partially removes the problem described in the previous paragraph, but poses a different one - the SPAN port cannot accept absolutely all the traffic that will be sent to it - it will not have enough bandwidth. Snuggle up something to sacrifice. Either leave part of the nodes unmonitored (then you need to prioritize them first), or route not all traffic from the node, but only a certain type. In any case, we can skip some attacks. In addition, the SPAN port can be occupied for other needs. As a result, we will have to revise the existing network topology and, possibly, make adjustments to it to cover your network to the maximum with the number of sensors you have (and coordinate this with IT).
And if your network uses asymmetric routes? And if you have implemented or plan to introduce SDN? And if you need to monitor virtualized machines or containers whose traffic does not reach the physical switch at all? Manufacturers of traditional IDS do not like these questions because they do not know how to answer them. Perhaps they will incline you to the fact that all these fashionable technologies are hype and you do not need it. Perhaps they will talk about the need to start small. Or maybe they will say that you need to put a powerful thresher in the center of the network and direct all traffic to it using balancers. Whatever option you are offered, you need to clearly understand for yourself how much it suits you. And only after that make a decision on the choice of approach to monitoring information security of the network infrastructure. Returning to packet capture, I want to say that this method continues to be very popular and important, but its main purpose is border control; the boundaries between your organization and the Internet, the boundaries between the data center and the rest of the network, the boundaries between the process control system and the corporate segment. In these places, classic IDS / IPS still have a right to exist and do a good job of their tasks.
Let's move on to the second option. An analysis of events received from network devices can also be used to detect attacks, but not as the main mechanism, since it allows only a small class of intrusions to be detected. In addition, some reactivity is inherent in it - an attack must first occur, then it must be fixed by a network device, which in one way or another will signal a problem with information security. There are several ways. It can be syslog, RMON or SNMP. The last two protocols for network monitoring in the context of information security are applied only if we need to detect a DoS attack on the network equipment itself, since using RMON and SNMP, for example, we can monitor the load of the central processor of the device or its interfaces. This is one of the “cheapest” (everyone has syslog or SNMP), but also the most ineffective of all ways to monitor the information security of the internal infrastructure - many attacks are simply hidden from it. Of course, they should not be neglected and the same syslog analysis helps you to identify changes in the configuration of the device itself in time, it’s a compromise, but it is not very suitable to detect attacks on the entire network.
The third option is to analyze information about traffic passing through a device that supports one of several flow protocols. In this case, regardless of the protocol, the flow infrastructure necessarily consists of three components:
- Generate or export flow. This role is usually assigned to a router, switch, or other network device, which, passing network traffic through itself, allows you to extract key parameters from it, which are then transferred to the collection module. For example, at Cisco Netflow protocol is supported not only on routers and switches, including virtual and industrial ones, but also on wireless controllers, firewalls and even servers.
- Collection flow. Given that in a modern network there is usually more than one network device, the task of collecting and consolidating flows arises, which is solved using the so-called collectors, which process the received flows and then transmit them for analysis.
- Flow analysis. The analyzer takes upon itself the main intellectual task and, applying various algorithms to the flows, draws certain conclusions. For example, as part of the IT function, such an analyzer can identify network bottlenecks or analyze the traffic load profile to further optimize the network. And for information security, such an analyzer can detect data leaks, the spread of malicious code or DoS attacks.
Do not think that such a three-tier architecture is too complicated - all other options (except, perhaps, network monitoring systems working with SNMP and RMON) also work according to it. We have a data generator for analysis, which is a network device or a stand-alone sensor. We have an alarm collection system and a management system for the entire monitoring infrastructure. The last two components can be combined within a single node, but in more or less large networks, they are usually separated by at least two devices in order to ensure scalability and reliability.
Unlike packet analysis, based on the study of the header and data body of each packet and the sessions consisting of them, the flow analysis relies on the collection of metadata about network traffic. When, how much, where and where, how ... these are the questions answered by the analysis of network telemetry using various flow protocols. Initially, they were used to analyze statistics and search for IT problems in the network, but then, with the development of analytical mechanisms, it became possible to apply them to the same telemetry and for security purposes. Here it is worth noting once again that stream analysis does not replace or cancel packet capture. Each of these methods has its own field of application. But in the context of this article, it is flow analysis that is best suited for monitoring internal infrastructure. You have network devices (and it doesn’t matter if they work in a software-defined paradigm or according to static rules) that the attack cannot pass. It can bypass the classic IDS sensor, but there is no network device that supports the flow protocol. This is the advantage of this method.
On the other hand, if you need evidence base for law enforcement agencies or your own incident investigation team, you cannot do without packet capture - network telemetry is not a copy of the traffic that can be used to collect evidence; it is needed for operational detection and decision-making in the field of information security. On the other hand, using telemetry analysis, you can “write” not all network traffic (if anything, then Cisco is involved in data centers :-), but only the one that is involved in the attack. Telemetry analysis tools in this regard will well complement traditional packet capture mechanisms, giving the command for selective capture and storage. Otherwise, you have to have a colossal storage infrastructure.
Imagine a network operating at a speed of 250 Mbps. If you want to save all this volume, then you will need 31 MB storage for one second of traffic transfer, 1.8 GB for one minute, 108 GB for one hour, and 2.6 TB for one day. To store daily data from a network with a bandwidth of 10 Gbit / s, you need 108 TB of storage. But some regulators require you to store safety data for years ... Recording “on demand”, which helps you implement flow analysis, helps reduce these values by orders of magnitude. By the way, if we talk about the ratio of the recorded volume of network telemetry data to the total data capture, then it is about 1 to 500. For the same values above, the storage of the full decryption of all daily traffic will be 5 and 216 GB, respectively (you can even write to a regular flash drive )
If the raw network data analysis tools have a method of capturing them that is almost the same as the vendor to the vendor, then the situation is different with the analysis of flows. There are several options for flow protocols, the differences in which you need to know in the security context. The most popular is the Netflow protocol developed by Cisco. There are several versions of this protocol that differ in their capabilities and the amount of information recorded about traffic. The current version is the ninth (Netflow v9), on the basis of which the industry standard Netflow v10, also known as IPFIX, was developed. Today, most network vendors support exactly Netflow or IPFIX in their equipment. But there are various other options for flow protocols - sFlow, jFlow, cFlow, rFlow, NetStream, etc., of which sFlow is more popular. It is he who is most often supported by domestic manufacturers of network equipment due to the ease of implementation. What are the key differences between Netflow, as a de facto standard, and sFlow? I would single out a few key ones. First, Netflow has user-defined fields as opposed to fixed fields in sFlow. And secondly, and this is the most important thing in our case, sFlow collects the so-called sampled telemetry; unlike unsampled in Netflow and IPFIX. What is the difference between them?
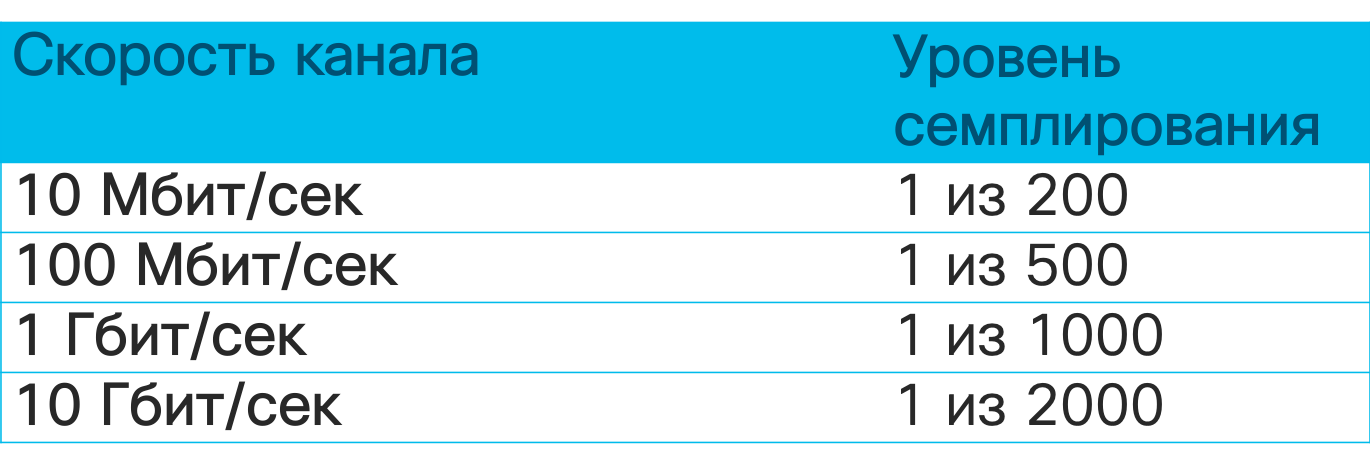
Imagine that you decided to read the book “ Security Operations Center: Building, Operating, and Maintaining your SOC ” by my colleagues - Gary McIntyre, Joseph Muniz and Nadef Alfardan (you can download part of the book from the link). You have three options to achieve your goal - to read the whole book, run it through the eyes, stopping at every 10th or 20th page, or try to find a retelling of key concepts in a blog or service such as SmartReading. So unsampled telemetry is reading every “page” of network traffic, that is, analyzing metadata for each packet. Sampling telemetry is a selective study of traffic in the hope that the selected samples will have what you need. Depending on the channel speed, the sampled telemetry will send for analysis every 64th, 200th, 500th, 1000th, 2000th or even 10000th packet.
In the context of information security monitoring, this means that sampled telemetry is well suited for detecting DDoS attacks, scanning, and spreading malicious code, but it can skip atomic or multi-packet attacks that did not fall into the sample sent for analysis. Unmeasured telemetry does not have such shortcomings. Using the range of detectable attacks is much wider. Here is a short list of events that can be detected using network telemetry analysis tools.
Of course, some open source Netflow analyzer will not allow you to do this, since its main task is to collect telemetry and conduct basic analysis on it from an IT point of view. To identify information security threats based on flow, it is necessary to equip the analyzer with various engines and algorithms that will identify cybersecurity problems on the basis of standard or custom Netflow fields, enrich standard data with external data from various sources of Threat Intelligence, etc.
Therefore, if you have a choice, then stop it on Netflow or IPFIX. But even if your equipment only works with sFlow, like domestic manufacturers, then even in this case you can benefit from it in the security context.
In the summer of 2019, I analyzed the opportunities that Russian manufacturers of networked hardware have, and all of them, excluding NSG, Polygon and Craftway, declared support for sFlow (at least Zelax, Natex, Eltex, QTech, Rusteletech).
The next question you will face is where to implement flow support for security purposes? In fact, the question is not entirely correct. On modern equipment, support for flow protocols is almost always there. Therefore, I would reformulate the question differently - where is the most effective way to collect telemetry from a security point of view? The answer will be quite obvious - at the access level, where you will see 100% of all traffic, where you will have detailed information on hosts (MAC, VLAN, interface ID), where you can even track P2P traffic between hosts, which is critical for detecting scans and and the spread of malicious code. At the kernel level, you may just not see part of the traffic, but at the perimeter level you will see well if a quarter of all your network traffic. But if, for some reason, extraneous devices are wound up on your network that allow attackers to “enter and exit,” bypassing the perimeter, then analyzing telemetry from it will not give you anything. Therefore, for maximum coverage, it is recommended to include telemetry collection at the access level. At the same time, it is worth noting that even if we are talking about virtualization or containers, flow support is also often found in modern virtual switches, which allows you to control traffic there.
But since I raised the topic, I need to answer the question, but what if, after all, the equipment, physical or virtual, does not support flow protocols? Or is its inclusion prohibited (for example, in industrial segments to ensure reliability)? Or its inclusion leads to high CPU utilization (this happens on outdated equipment)? To solve this problem, there are specialized virtual sensors (flow sensor), which are essentially ordinary splitters that pass traffic through themselves and transmit it in the form of flow to the collection module. True, in this case we get a whole bunch of problems that we talked about above in relation to packet capture tools. That is, one must understand not only the advantages of flow analysis technology, but also its limitations.
Another point that is important to remember when talking about flow analysis tools. If we apply the EPS metric (event per second, events per second) to conventional means of generating security events, then this indicator does not apply to telemetry analysis; it is replaced by FPS (flow per second, flow per second). As in the case of EPS, it cannot be calculated in advance, but you can estimate the approximate number of threads that a particular device generates depending on its task. On the Internet, you can find tables with approximate values for different types of corporate devices and conditions, which will allow you to figure out which licenses you need for analysis tools and what will be their architecture? The fact is that the IDS sensor is limited by a certain bandwidth, which it will “pull”, and the stream collector has its own limitations, which must be understood. Therefore, in large, geographically distributed networks, there are usually several reservoirs. When I described how the network inside Cisco is monitored , I already quoted the number of our collectors - there are 21. And this is a network scattered across five continents and numbering about half a million active devices).
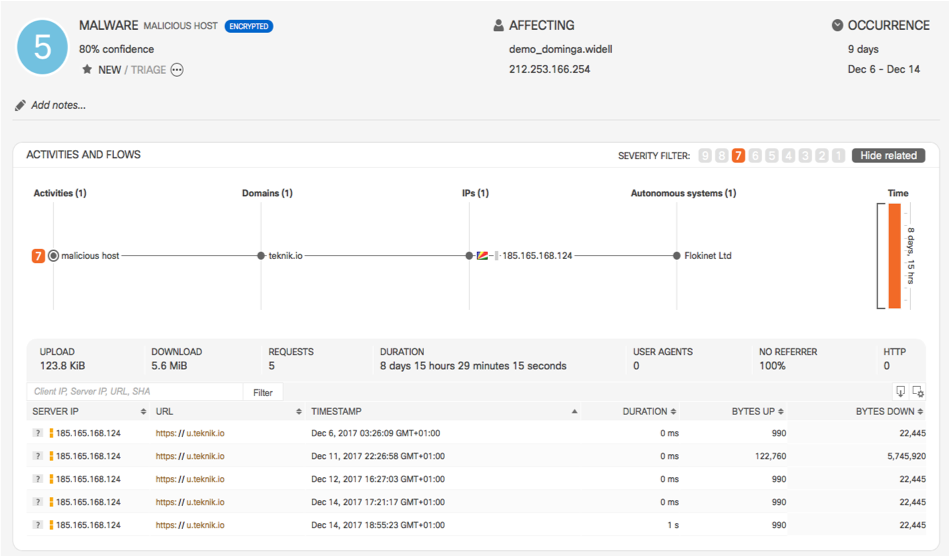
As a Netflow monitoring system, we use our own Cisco Stealthwatch solution , which is specifically focused on solving security problems. It has many built-in engines for detecting abnormal, suspicious and obviously malicious activity, which allows to detect a wide range of various threats - from crypto mining to information leaks, from the spread of malicious code to fraud. Like most flow analyzers, Stealthwatch is built according to a three-level scheme (generator - collector - analyzer), but it is supplemented by a number of interesting features that are important in the context of the material under consideration. First, it integrates with packet capture solutions (for example, Cisco Security Packet Analyzer), which allows you to record selected network sessions for further in-depth investigation and analysis. Secondly, specifically to expand security tasks, we developed a special protocol nvzFlow, which allows you to "translate" the activity of applications on end nodes (servers, workstations, etc.) into telemetry and transmit it to the collector for further analysis. If in its original version Stealthwatch works with any flow protocol (sFlow, rFlow, Netflow, IPFIX, cFlow, jFlow, NetStream) at the network level, then support for nvzFlow also allows correlation of data at the host level, thereby. increasing the efficiency of the entire system and seeing more attacks than conventional network flow analyzers.
It is clear that speaking of security analysis Netflow systems, the market is not limited to a single solution from Cisco. You can use both commercial and free or shareware solutions. Oddly enough, if I use the Cisco blog as an example of competing solutions, I’ll say a few words about how network telemetry can be analyzed using two popular, similar in name, but still different tools - SiLK and ELK.
SiLK is a set of tools (the System for Internet-Level Knowledge) for traffic analysis, developed by the American CERT / CC and which supports, in the context of today's article, Netflow (5th and 9th, the most popular versions), IPFIX and sFlow and using various utilities (rwfilter, rwcount, rwflowpack, etc.), perform various operations on network telemetry in order to detect signs of unauthorized actions in it. But there are a couple of important points to note. SiLK is a command-line tool and conduct operational analysis, all the time entering a command of the form (detection of ICMP packets larger than 200 bytes):
rwfilter --flowtypes=all/all --proto=1 --bytes-per-packet=200- --pass=stdout | rwrwcut --fields=sIP,dIP,iType,iCode --num-recs=15
not very comfortable. You can use the iSiLK GUI, but it will not make your life much easier by solving only the visualization function, not the analyst’s replacement. And this is the second point. Unlike commercial solutions, which already have a solid analytical base, anomaly detection algorithms, workflow-related algorithms, etc., in the case of SiLK, you will have to do all this yourself, which will require you to have slightly different competencies than using already ready-to-use tools. This is bad and not bad - this is a feature of almost any free tool that comes from the fact that you know what to do, and it will only help you in this (commercial tools are less dependent on the competencies of its users, although it also assumes that analysts understand at least basics of network investigations and monitoring). But back to SiLK. The analyst’s work cycle with him is as follows:
- Formulation of a hypothesis. We must understand what we will look for within network telemetry, to know the unique attributes by which we will identify particular anomalies or threats.
- Building a model. Having formulated a hypothesis, we program it using the same Python, shell, or other tools not included in SiLK.
- Testing. It is the turn of verifying the correctness of our hypothesis, which is confirmed or disproved using the SiLK utilities starting with 'rw', 'set', 'bag'.
- Analysis of real data. In industrial operation, SiLK helps us identify something and the analyst must answer the questions “Did we find what we expected?”, “Does this correspond to our hypothesis?”, “How to reduce the number of false positives?”, “How to improve the recognition level? " etc.
- Improvement. At the final stage, we improve what we did earlier - create templates, improve and optimize the code, reformulate and refine the hypothesis, etc.
This cycle will be applicable to the same Cisco Stealthwatch, only the last five steps will automate to the maximum, reducing the number of analyst errors and increasing the speed of incident detection. For example, in SiLK, you can enrich network statistics with external data on malicious IP using your own scripts, and in Cisco Stealthwatch, this is a built-in function that immediately displays an alarm if there is interaction with IP addresses from the black list in network traffic.
If we go higher in the “paid” pyramid for flow analysis software, then absolutely free SiLK will be followed by the shareware ELK, consisting of three key components - Elasticsearch (indexing, data search and analysis), Logstash (data input / output) and Kibana ( visualization). Unlike SiLK, where you have to write everything yourself, ELK already has many ready-made libraries / modules (some are paid, some are not) that automate the analysis of network telemetry. For example, the GeoIP filter in Logstash allows you to bind the observed IP addresses to their geographical location (for Stealthwatch, this is a built-in function).
ELK also has a fairly large community that is completing the missing components for this monitoring solution. For example, to work with Netflow, IPFIX, and sFlow, you can use the elastiflow module if you are not comfortable with the Logstash Netflow Module, which only supports Netflow.
Giving more efficiency in collecting flow and searching in it, ELK currently does not have rich built-in analytics for detecting anomalies and threats in network telemetry. That is, following the life cycle described above, you will have to independently describe the model of violations and then use it in the combat system (there are no built-in models there).
Of course, there are more sophisticated extensions for ELK that already contain some models for detecting anomalies in network telemetry, but such extensions cost money and the question is whether the game is worth the candle - write the same model yourself, buy its implementation for your monitoring tool or buy turnkey solution for the Network Traffic Analysis class.
In general, I do not want to go into the debate that it is better to spend money and buy a turnkey solution for monitoring anomalies and threats in network telemetry (for example, Cisco Stealthwatch) or figure it out on your own and spin the same SiLK, ELK or nfdump or OSU Flow Tools (for each new threat) ( I talked about the last two of them last time)? Everyone chooses for himself and everyone has his own motives to choose either of two options. I just wanted to show that network telemetry is a very important tool in ensuring the network security of your internal infrastructure and you should not neglect it so as not to replenish the list of the company whose name is mentioned in the media along with the epithets “hacked”, “not complying with information security requirements "," Thinking about the security of their data and customer data. "
Summing up, I would like to list the key tips that you should follow when building information security monitoring of your internal infrastructure:
- Do not limit yourself only to the perimeter! Use (and choose) your network infrastructure not only to transfer traffic from point A to point B, but also to address cybersecurity issues.
- Examine the existing security monitoring mechanisms in your network equipment and use them.
- For internal monitoring, give preference to telemetry analysis - it allows you to detect up to 80-90% of all information security incidents, while doing what is impossible when capturing network packets and saving space for storing all information security events.
- To monitor flows, use Netflow v9 or IPFIX - they provide more information in the security context and allow you to monitor not only IPv4, but also IPv6, MPLS, etc.
- flow- – . , Netflow IPFIX.
- – flow-. Netflow Generation Appliance.
- – 100% .
- , , flow- SPAN/RSPAN-.
- / / ( ).
As for the last tip, I would like to give an illustration, which I have already cited earlier. You see that if earlier the Cisco IS service almost entirely built its IS monitoring system based on intrusion detection systems and signature methods, now they account for only 20% of incidents. Another 20% is accounted for by flow analysis systems, which suggests that these solutions are not a whim, but a real tool in the activity of information security services of a modern enterprise. Moreover, you have the most important thing for their implementation - network infrastructure, investments in which can be additionally protected by assigning IS monitoring functions to the network as well.
I deliberately did not touch on the topic of responding to anomalies or threats identified in network streams, but I think that it is already clear that monitoring should not be completed only by detecting a threat. It should be followed by a response and preferably in an automatic or automated mode. But this is the topic of a separate material.
Additional Information:
- Description of Cisco IOS Netflow
- Netflow Support Matrix in Various Cisco Solutions
- Netflow Configuration Guide for Various Cisco Platforms
- SFlow Community
- Lab Using Stealtjwatch, SiLK, and ELK for Security Netflow Analysis
- SiLK website
- A 300-page SiLK tutorial with tons of examples
- Logstash netflow module
- Cisco ELK Netflow Analysis Walkthrough in ELK
- NetFlow v.9 Cisco ASA Analysis Using Logstash (ELK)
- Cisco Stealthwatch Solution
Threat. If it’s easier for you to listen to everything that was written above, then you can watch the hour-long presentation, which formed the basis of this note.
All Articles