Information Security Analyst - who is he? Immersion in the profession

Today we will give you an overview of the daily duties of an information security analyst. His work is, in fact, a constant analysis of raw data from
heterogeneous sources of events (information and network) security to maintain (and preferably) increase the level of security of the organization. These are not always specific practical actions, but, as a rule, they include data aggregation from many possible sources: event logs of operating systems, firewalls, routers, antivirus scanners, and much more. Then he needs to combine
or match them to obtain a data set that can be processed using appropriate algorithms.
Content
- Security Analytics in Detail
- SIEM vs IB analytics
- Practical examples
- Benefits of IB Analytics
- UBA or user behavior analytics
- How to visualize security analytics: dashboards and threat models
Security Analytics in Detail
The difficult part of the IB analytics profession is to find the current active threats in the notorious haystack. And what's more, go beyond the current threat to see and analyze the whole picture. And as a result, block all threats similar to it or come up with a one-time, but effective answer.
In order to do this correctly, it is important to immediately determine the type of analysis required, as well as highlight the specific events on which you will focus in this investigation.
This is a bird's eye view of information security analytics.
Now let's talk about Security Information and Event Management, or SIEM. This, in essence, is the same as I described above - processing event logs, mainly from the logs of operating systems, network devices and other security tools, and their subsequent combined analysis. At the end of the analysis, classical mathematical statistics are used so that the initial data can be reliably interpreted by people.
To get an idea of how the work with event logs looks, you can look at the events of the Windows operating system by opening the Event Viewer on your laptops:
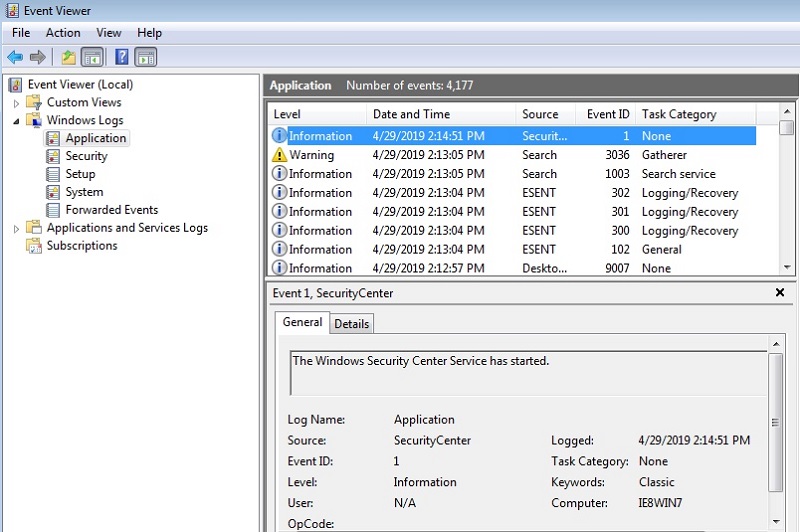
Here it is a routine of low-level Windows events - everything is not so magical!
Here you can scroll through thousands and even tens of thousands of system and security events: starting and ending processes, blocking accounts, executing PowerShell commands, etc. Now imagine what SIEM should do: combine and then find correlations between these operating system events and events captured from network devices and other security systems, and finally show us some sense on the basis of this!
As a small example, let's say you want to track the deletion of an important file. It is also possible that this removal, when correlated with other events, will indicate a real attack. For an IT professional who is not familiar with SIEM, this might seem like a very simple task: just find
in the Windows event log, the delete event associated with this file:
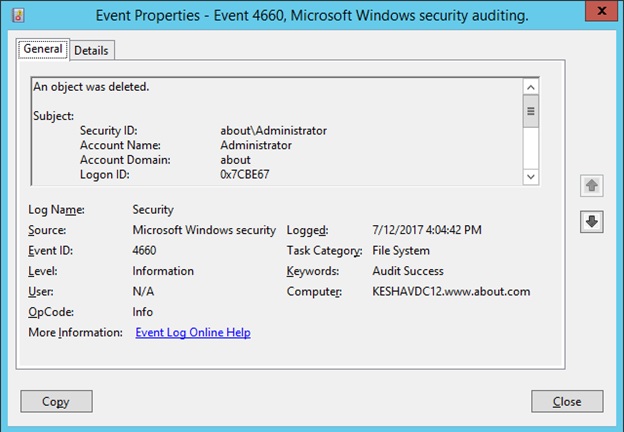
Oh no! The Windows Uninstall event (event number 4660) does not contain a file name!
Unfortunately, if you look at the Windows file delete event, it doesn’t have one important information: the name and path to the file. How then can we determine the file name associated with the delete event in the Windows log?
SIEM vs IB analytics
This is not easy because this information is spread over several journal entries. You will have to map the delete event 4660 to another, object access event 4663. In practice, you will most likely search for these two events, 4660 and 4663, and then combine the information from them to get a clear picture. And, by the way, in case you are not in the know, enabling audit of file actions on Windows (to receive events on files similar to those shown above) is a rather demanding task - and, according to various estimates, it will cost you up to 30% lost power file server. That is why there are specialized solutions for this.
Even in this very simple example, you can see that SIEM is an intensive and complex process with powerful resource consumption. By the way, that’s why, as security analysts note, some fundamental restrictions are imposed on SIEM, at least for the first generations of these products.
Spoiler
it doesn’t work as fast and exactly as we all want
Practical examples
Among the most common use cases of information security analytics are:
- UBA user behavior analytics (see below)
- Threat Detection and Classification
- Ensuring IT security by providing complete and accurate information to the business to reduce overall risk
Benefits of IB Analytics
Attempting to find security incidents in unprocessed event logs is inherently complex, and SIEM tends to have too many inaccurate results and false positives.
This is where the IB analyst has the main advantages over SIEM: he is much more experienced and perspicacious in how to look at the raw data of events, and also in how to then display the resulting analytics for making better decisions in IT management.
UBA, or user behavior analytics
User behavior analytics, or UBA, can be seen as a more informed version of SIEM. Yes, like SIEM, it also relies on event logs. However, UBA focuses on what the user does : running applications, network activity, and the most critical files opened by him (when the file or letter was opened, who opened them, what he did with them, and how often).
Storing and collecting events based on user actions has its significant advantages over the standard logs in SIEM. Users have their own unique patterns of behavior : for example, regular access to certain files and directories. To find potential security incidents, UBA looks at the current event logs associated with each user, and then compares them with a typical picture of what the user usually does.
Thus, UBA is essentially SIEM, but a plus with history and context . Therefore, it can identify potential attacks, determine whether suspicious activity comes from a hacker, an insider, malware, or other processes and services.
If you just thought about what the methods of machine learning and analysis / forecasting from the theory of big data are probably used here, then you are absolutely right! These methods of analysis help establish a certain baseline on the basis of which you can then predict what is normal and what is not.
To summarize, of course, SIEM is a smart approach to detect attacks. But without additional context, conclusions and actions based only on SIEM statistics become less reliable. These will be, in fact, “false positives” when the SIEM system indicates to us the threat at the moment when it does not exist. At some point, you suddenly discover that almost 100% of the time you are analyzing fake threats alone. But in the end, you generally begin to ignore them, and even with those that are certainly worth your attention.
UBA brings context , which reduces false positives. UBA systems process the same stream of events, but look at it from the angle of daily activity of people in computer systems, and then compare it with the accumulated normalized base. And due to this, using our own algorithms and rules, more accurately identify non-standard activity.
How to visualize security analytics: dashboards and threat models
UBA systems, as we have seen, give us cleaner data, on the basis of which IT security officers should be able to make more informed decisions. To make any data usable by people, a visualization is needed that allows us to distinguish at a glance which of the users were noticed in abnormal behavior.
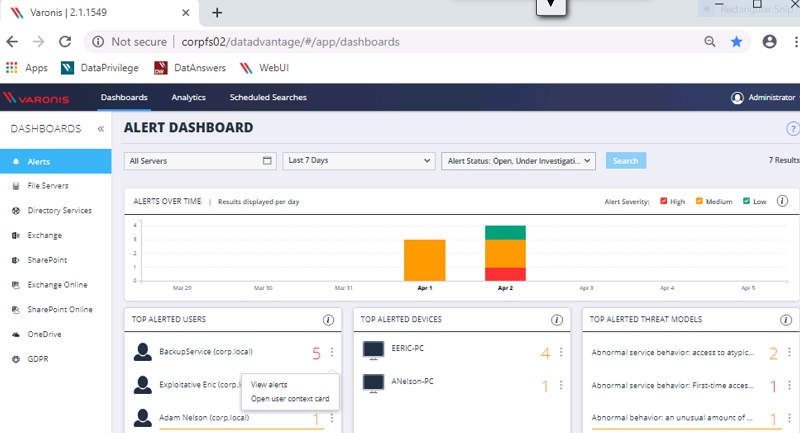
Single security dashboard. Here you can drill down to get more detailed information about the affected users and the threats looming over them.
Security analytics dashboards are multilevel GUIs that allow us to drill down and see more information, for example, view details of an affected user by clicking on the user's context map. For example, in our Varonis dashboard (see the picture above), you can easily see which users are being attacked, the devices associated with them, and the threat models in which they are involved.
Well, and ultimately, all this should lead us to a discussion of threat models, which are actually a formal way of identifying and evaluating potential threats and vulnerabilities. For example, Miter, the famous MIT research lab, has an excellent knowledge base on current threat patterns that deserve your attention.
An organization’s security status dashboard is located at the top of the food chain of events. This is the visual result of a processing chain that begins with UBA methods applied to raw unprocessed events and ends with special algorithms, often based on machine learning, to search and classify data into various threat models. For example, unusual access to confidential data, detected crypto activity, unusual changes to the privileges of a user or group, mass deletion, and much more.
I hope it’s also quite obvious to you now that the dashboard of current threats based on UBA is much more effective than working with raw event logs? For example, our DatAlert solution covers a very wide range of threat models . And if you want to know more about how our data analysis capabilities can help you avoid viewing raw logs, then sign up for a demo or pilot test.
All Articles