Point cloud. How we develop digital technology in construction
Perhaps you are aware, or maybe not, but we are closely engaged in the development of technologies of Industry 4.0. IoT, machine learning in real production, digital doubles of enterprises - we are familiar with all these things firsthand. In other words, we know how to make friends with a “figure” with brutal heavy engineering or oil production.

But today we want to talk about a little less heroic developments for the equally harsh construction industry. We decided to headline our story “Point Cloud”, and very soon you will understand why this is so.
Let's imagine the most ordinary construction site. Not an apartment building, but something industrial. At some point, the facility will need to conduct quality control of the work performed. Contractors built something, but what? And How? It is necessary to understand how the erected structure or its part corresponds to the project.
You can act according to the traditional method: send good guys with theodolites so that they measure everything. If the object is large, it can take a lot of time. Good guys will not be able to climb into all corners and there will always be a risk of error.
But what if you automate the process? To carry out quality control quickly, using high-precision equipment, and at the output immediately provide reports listing the shortcomings found?
Since the development was initially focused on serious industrial facilities, we will assume that such facilities always have a project in the format of a 3D model. Next we take this 3D model and scan the object using laser scanning technology.
The laser scanner allows relatively inexpensive and with high accuracy to process the structure under construction. A modern high-precision rangefinder can scan up to several million points per second. So literally in a working day you can get a digital model of the object.
We know the exact location of the scanner, we know the direction and distance to each point, which means we have 3D coordinates of the points. We get a cloud of coordinates that corresponds to the surfaces of the constructed object. This is the cloud of coordinates that we call the “point cloud”.
Naturally, more than one measurement is carried out. An object may have a complex layout; columns and other interesting structural elements may be provided for in a project. The scanner is moved, the scanning procedure is repeated several times. Further, the resulting "point clouds" must be "stitched" into one.
We have developed a solution that allows you to automatically compare the "point cloud" with the construction project in 3D. Now this problem is being solved by people, imposing a “cloud” on a 3D model and looking for deviations by eye. There are very few automated solutions of this kind and their functionality is limited. We completely automated the process and named our prototype Jet Construction Monitor.
Jet Construction Monitor detects deviations from the design 3D model in scanned “clouds”. In this case, tolerances for each class of structural elements are taken into account. When an element goes beyond the tolerance, a deviation is recorded.
In words, everything seems extremely simple. In practice, when running in the system, we encountered certain difficulties. When there is a ready-made “point cloud”, it is difficult to understand where the real boundaries of the object are. Therefore, we set a certain range of values and inside this region we look for points related to a certain element of the model. If points are found, they are considered to fall on this element.
If such points are not found or they do not fall into the specified area, it is considered that the element was not covered by scanning. Deviations are calculated only for model elements for which the percentage of coverage is above a threshold value. Typically, the threshold is set at 75%. Jet Construction Monitor takes into account the following types of deviations: side shift, scaling, rotation.

Point cloud superimposed on the model
So, we feed the system: a “point cloud”, a 3D design model and reference information about deviations for various classes of structural elements. The system produces the result in two versions. The first is interactive 3D visualization, which can be viewed from all sides. The second is a report in the form of a table of recorded deviations.

Interactive 3D visualization with deviations shown
On the interactive visualization, you see that different structural elements are painted in different colors. The green color on the visualization indicates elements for which the deviations do not exceed the permissible values. Violet indicates deviations in one direction, red in the other direction.
On the visualization, gray areas may be shown that are not covered by a “point cloud”. Usually these are elements of a design 3D model that cannot be scanned, for example, parts of the foundation. It can also be elements in which the coating is less than 75%.
Elements of the model, as already mentioned, are displayed in the form of a tabular list with information about deviations. If the deviations are higher than the set thresholds, the cell in the table is highlighted in red. The table can be exported to Excel, sorted by the deviation indicator and presented to the executor as a register of deviations.
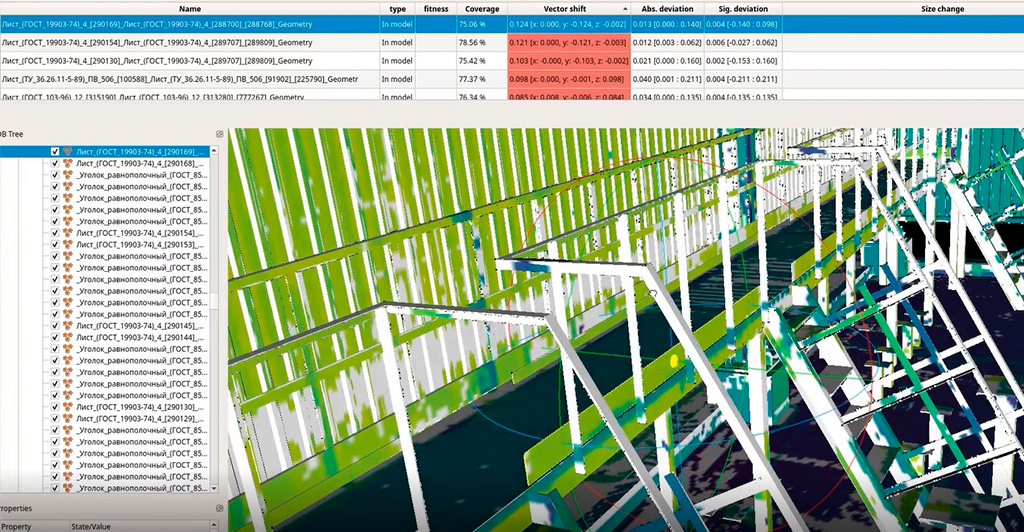
Table of model elements with deviations
Jet Construction Monitor is built on the CloudCompare platform. A major advantage of our solution is the ability to output data on individual structural elements. It is with them that designers and builders work. Autodesk has a similar solution: there, too, a “cloud” can be applied to the design model. However, deviations are not tied to the list of structural elements.
Jet Construction Monitor is primarily targeted at construction customers - those who oversee construction contractors. At the same time, it is not necessary to have your own laser scanner and an appropriate specialist. There are companies that provide such a service for a reasonable price.
Even for a fairly large industrial facility, scanning and creating a ready-made “point cloud” can be done in one day. In practice, this means that it is quite realistic to receive a weekly report on the state of the construction being constructed and thus control the contractors. At the same time, it is possible to avoid disruption to the construction period, monitor compliance with project requirements and technological requirements, and prevent potential accidents. And most importantly - if you find defects in time, they are much easier and cheaper to fix.
Now, to one degree or another, Jet Construction Monitor supports the following functions:
The main consumers of this solution are large companies, for example, from resource-mining and manufacturing industries. They build large-scale facilities: workshops, factories, various terminals, where we are talking about a high degree of responsibility.
Of course, we would like to add some features to Jet Construction Monitor that will make the solution even more efficient and convenient.
We are working on a pattern recognition function using machine learning algorithms. Now the solution is able to find and recognize in the “point cloud” only a few such images such as “beam”, “column”, “pipe bent”. Automatic recognition will improve the quality of building "clouds" and detect deviations, even for those objects that for some reason were not in the design 3D model. At the same time, having improved the recognition function, we plan to optimize it and reduce the processing time of the “point cloud”.
The second point that I would like to improve is related to the problem of exporting structural elements. Jet Construction Monitor was made under one of the most popular computer-aided design software Autodesk Revit . This is a BIM-design tool, it implements a practical and convenient hierarchy of structural units and elements. However, when exporting, the hierarchy is not saved and the output is a “flat” list of elements. For large-scale projects, such a list is cumbersome, it is difficult to work with it. This is another area of refinement.
Finally, we are thinking of adding a function for creating 2D sections - drawings, on which elements that require attention will be highlighted. The floor plan of the building, where elements with deviations outside the tolerances are highlighted, is a kind of intermediate version of the presentation - between 3D-visualization and the table.
As a result, we have a full-fledged product for automated control of the stages and quality of construction of complex objects. And it will be able to become an important part of the BIM pipeline in construction management for large construction customers.
But today we want to talk about a little less heroic developments for the equally harsh construction industry. We decided to headline our story “Point Cloud”, and very soon you will understand why this is so.
Let's imagine the most ordinary construction site. Not an apartment building, but something industrial. At some point, the facility will need to conduct quality control of the work performed. Contractors built something, but what? And How? It is necessary to understand how the erected structure or its part corresponds to the project.
You can act according to the traditional method: send good guys with theodolites so that they measure everything. If the object is large, it can take a lot of time. Good guys will not be able to climb into all corners and there will always be a risk of error.
But what if you automate the process? To carry out quality control quickly, using high-precision equipment, and at the output immediately provide reports listing the shortcomings found?
How it works
Since the development was initially focused on serious industrial facilities, we will assume that such facilities always have a project in the format of a 3D model. Next we take this 3D model and scan the object using laser scanning technology.
The laser scanner allows relatively inexpensive and with high accuracy to process the structure under construction. A modern high-precision rangefinder can scan up to several million points per second. So literally in a working day you can get a digital model of the object.
We know the exact location of the scanner, we know the direction and distance to each point, which means we have 3D coordinates of the points. We get a cloud of coordinates that corresponds to the surfaces of the constructed object. This is the cloud of coordinates that we call the “point cloud”.
Naturally, more than one measurement is carried out. An object may have a complex layout; columns and other interesting structural elements may be provided for in a project. The scanner is moved, the scanning procedure is repeated several times. Further, the resulting "point clouds" must be "stitched" into one.
We have developed a solution that allows you to automatically compare the "point cloud" with the construction project in 3D. Now this problem is being solved by people, imposing a “cloud” on a 3D model and looking for deviations by eye. There are very few automated solutions of this kind and their functionality is limited. We completely automated the process and named our prototype Jet Construction Monitor.
Why do we think that a living person is bad? Formally, everything is fine: the problem is being solved. However, when working with a large object, a person may simply not notice a relatively small deviation, which, however, will go beyond the tolerance. The second point is time. The third point is the human factor: there are always deviations, the employee will independently determine whether they comply with the standards or not, what to do with them. There is always a chance of error. The fourth point is that such an analysis cannot be carried out at the site, you will need sufficiently productive equipment that no one will keep there.
Jet Construction Monitor detects deviations from the design 3D model in scanned “clouds”. In this case, tolerances for each class of structural elements are taken into account. When an element goes beyond the tolerance, a deviation is recorded.
In words, everything seems extremely simple. In practice, when running in the system, we encountered certain difficulties. When there is a ready-made “point cloud”, it is difficult to understand where the real boundaries of the object are. Therefore, we set a certain range of values and inside this region we look for points related to a certain element of the model. If points are found, they are considered to fall on this element.
If such points are not found or they do not fall into the specified area, it is considered that the element was not covered by scanning. Deviations are calculated only for model elements for which the percentage of coverage is above a threshold value. Typically, the threshold is set at 75%. Jet Construction Monitor takes into account the following types of deviations: side shift, scaling, rotation.
Point cloud superimposed on the model
So, we feed the system: a “point cloud”, a 3D design model and reference information about deviations for various classes of structural elements. The system produces the result in two versions. The first is interactive 3D visualization, which can be viewed from all sides. The second is a report in the form of a table of recorded deviations.
Interactive 3D visualization with deviations shown
On the interactive visualization, you see that different structural elements are painted in different colors. The green color on the visualization indicates elements for which the deviations do not exceed the permissible values. Violet indicates deviations in one direction, red in the other direction.
On the visualization, gray areas may be shown that are not covered by a “point cloud”. Usually these are elements of a design 3D model that cannot be scanned, for example, parts of the foundation. It can also be elements in which the coating is less than 75%.
Elements of the model, as already mentioned, are displayed in the form of a tabular list with information about deviations. If the deviations are higher than the set thresholds, the cell in the table is highlighted in red. The table can be exported to Excel, sorted by the deviation indicator and presented to the executor as a register of deviations.
Table of model elements with deviations
Jet Construction Monitor is built on the CloudCompare platform. A major advantage of our solution is the ability to output data on individual structural elements. It is with them that designers and builders work. Autodesk has a similar solution: there, too, a “cloud” can be applied to the design model. However, deviations are not tied to the list of structural elements.
Where to apply it
Jet Construction Monitor is primarily targeted at construction customers - those who oversee construction contractors. At the same time, it is not necessary to have your own laser scanner and an appropriate specialist. There are companies that provide such a service for a reasonable price.
Even for a fairly large industrial facility, scanning and creating a ready-made “point cloud” can be done in one day. In practice, this means that it is quite realistic to receive a weekly report on the state of the construction being constructed and thus control the contractors. At the same time, it is possible to avoid disruption to the construction period, monitor compliance with project requirements and technological requirements, and prevent potential accidents. And most importantly - if you find defects in time, they are much easier and cheaper to fix.
Now, to one degree or another, Jet Construction Monitor supports the following functions:
- Search and interactive 3D visualization of deviations;
- Formation of a table report listing elements that go beyond tolerances;
- Integration with industry directories;
- Import models into design systems;
- Import "point clouds";
- Recognition of structural elements.
The main consumers of this solution are large companies, for example, from resource-mining and manufacturing industries. They build large-scale facilities: workshops, factories, various terminals, where we are talking about a high degree of responsibility.
Future plans
Of course, we would like to add some features to Jet Construction Monitor that will make the solution even more efficient and convenient.
We are working on a pattern recognition function using machine learning algorithms. Now the solution is able to find and recognize in the “point cloud” only a few such images such as “beam”, “column”, “pipe bent”. Automatic recognition will improve the quality of building "clouds" and detect deviations, even for those objects that for some reason were not in the design 3D model. At the same time, having improved the recognition function, we plan to optimize it and reduce the processing time of the “point cloud”.
The second point that I would like to improve is related to the problem of exporting structural elements. Jet Construction Monitor was made under one of the most popular computer-aided design software Autodesk Revit . This is a BIM-design tool, it implements a practical and convenient hierarchy of structural units and elements. However, when exporting, the hierarchy is not saved and the output is a “flat” list of elements. For large-scale projects, such a list is cumbersome, it is difficult to work with it. This is another area of refinement.
Finally, we are thinking of adding a function for creating 2D sections - drawings, on which elements that require attention will be highlighted. The floor plan of the building, where elements with deviations outside the tolerances are highlighted, is a kind of intermediate version of the presentation - between 3D-visualization and the table.
As a result, we have a full-fledged product for automated control of the stages and quality of construction of complex objects. And it will be able to become an important part of the BIM pipeline in construction management for large construction customers.
All Articles