New CUBA Cards

Working with geospatial data and displaying maps are integral parts of many business applications. It can be city and regional information systems, applications for the oil and gas industry, transport infrastructure management systems, as well as delivery services and many others. In our CUBA Platform, to build such applications, in addition to the basic features provided out of the box, there is a rather extensive set of add-ons and components . One of them is Charts and Maps , which, in addition to displaying charts, allows you to integrate Google maps into the visual part of the application. Last year, Google updated the terms of use of its map services, which led to an increase in cost, and also introduced the condition for the mandatory presence of a payment profile for using the API. These circumstances led most of our customers to think about alternative card providers, and we were encouraged to develop a new card component.
Now we are pleased to introduce a completely new component - CUBA Maps . CUBA Maps complements the application functionality with a visual representation and intuitive tools for editing geospatial data. The component works with both raster and vector data. You can use any map provider compatible with the Web Map Service protocol or providing tiles in the XYZ format as raster data. To work with vector data, the component uses geometric data types (point, polyline, polygon) from the JTS Topology Suite (JTS) library - the most popular Java library for working with geospatial data. The component provides all the necessary tools for creating a comprehensive geographic information system based on CUBA.
In this article, we will talk about new features offered by the Maps component, and also compare it with our previous map component.
Layer based structure
The component supports a traditional multilayer structure, widely used in professional geographic information systems. Layers are mainly divided into raster and vector. Raster layers consist of raster images, while vector layers contain vector geometries.
The component supports the following types of layers:
- Tile layer displays the tiles provided by the tile services in XYZ format.
- The Web Map Service (WMS) layer displays the images provided by the WMS services.
- The vector layer contains geo-objects (entities with geometric attributes).
These layers are structural elements of maps. For example, the lower layer may be a base map consisting of tiles, the second layer may contain polygons describing territorial units, for example, regions, and the upper layer may contain geographical points (location of customers, shops, etc.). Superimposing these layers on top of each other, we get the final map:
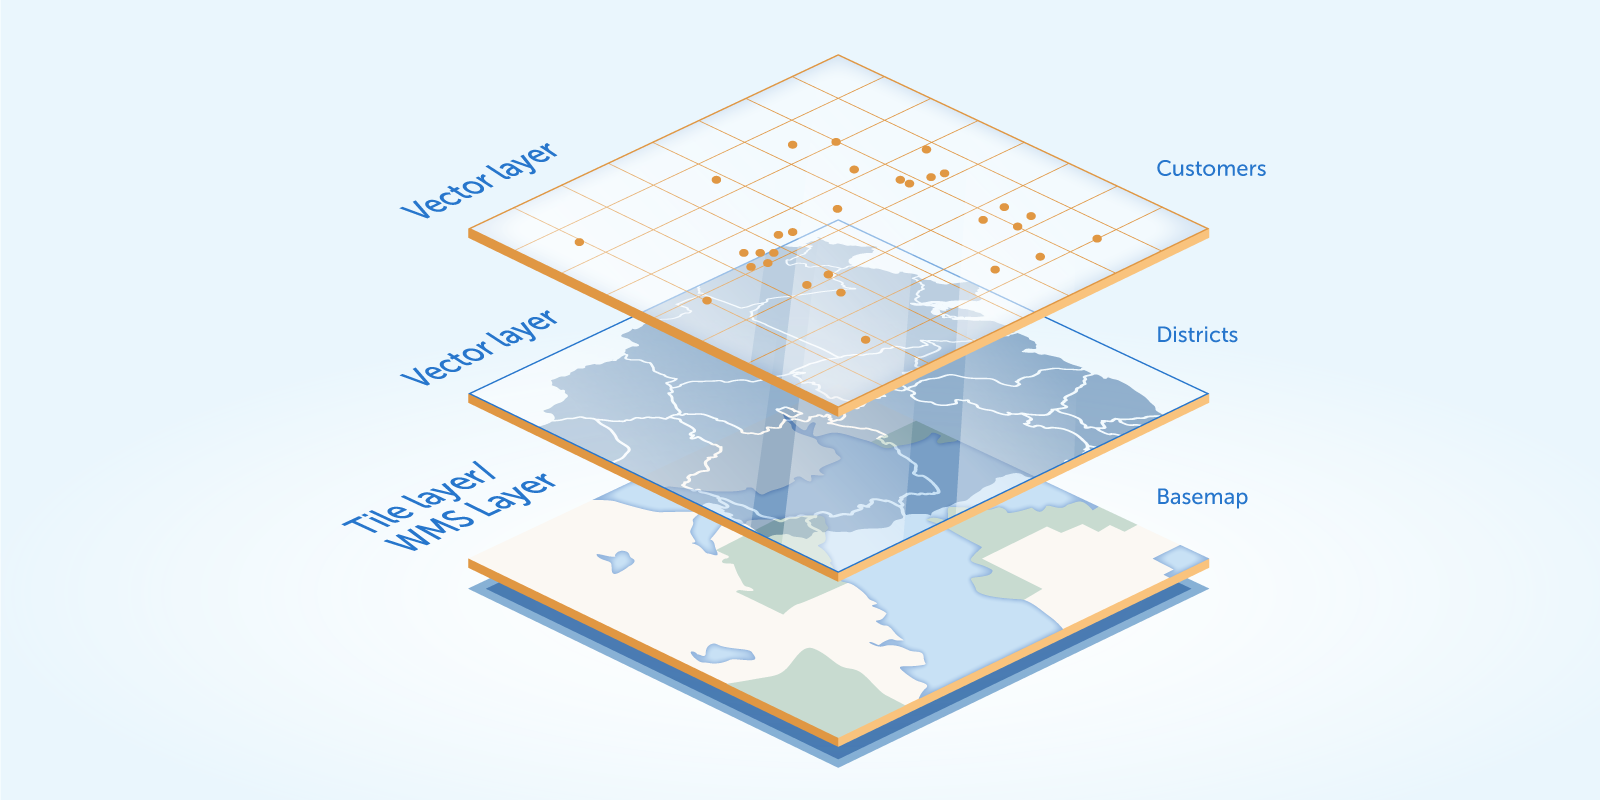
Thanks to this approach, you can create clearly structured maps with any content.
CUBA Maps provides a new visual component - GeoMap
. In the component XML descriptor, you can set the basic parameters of the map, as well as a set of displayed layers. An example of such a configuration:
<maps:geoMap id="map" height="600px" width="100%" center="37.615, 55.752" zoom="10"> <maps:layers selectedLayer="addressLayer"> <maps:tile id="tiles" tileProvider="maps_OpenStreetMap"/> <maps:vector id="territoryLayer" dataContainer="territoryDc"/> <maps:vector id="addressLayer" dataContainer="addressDc" editable="true"/> </maps:layers> </maps:geoMap>
This approach allows you to achieve more flexibility, which was lacking in Charts and Maps :
- Layering. This structure allows you to build cards with any content, for example, combine tiles provided by various services.
- Layers provide an abstraction that combines homogeneous objects. In the Charts and Maps component, all map contents (for example, points, polygons, etc.) were dumped into a common heap in the UI component. In order to somehow structure these objects, the project teams had to write additional logic.
- A declarative method for describing layers. As shown in the example above, you can completely specify the map structure (a set of layers) in the XML descriptor. In many cases, this is enough to not implement any additional logic in the screen controller. Using Charts and Maps it was almost impossible to do without writing additional logic.
Using tile layers or WMS allows you to work with any preferred map provider. You are not tied to a specific provider, as it was in Charts and Maps .
Vector layers greatly simplify the display, interactive editing and drawing of geo-objects on the map.
It is also worth noting that the visual component of GeoMap
by default has a special auxiliary layer - Canvas . Canvas provides a convenient API for displaying and drawing geometries (points, polylines, polygons) on a map. We will cover examples of using Canvas later in the article.
Geo objects
Suppose we have an entity that contains an attribute associated with the geometry (point, polyline, polygon). We will call this entity a geo-object . So, the component greatly simplifies the work with geo-objects.
For example, consider the geo object Address :
@Entity public class Address extends StandardEntity { ... @Column(name = "LOCATION") @Geometry @MetaProperty(datatype = "GeoPoint") @Convert(converter = CubaPointWKTConverter.class) protected Point location; ... }
It has a location
attribute of type org.locationtech.jts.geom.Point
from the JTS Topology Suite (JTS) library. The component supports the following geometric types from JTS:
-
org.locationtech.jts.geom.Point
- period. -
org.locationtech.jts.geom.LineString
- polyline. -
org.locationtech.jts.geom.Polygon
- polygon.
The location
attribute is tagged with @Geometry
annotation. This annotation announces that the value of this attribute should be used when displaying a geo object on a map. The attribute is also marked with the following annotations:
-
@MetaProperty
- in this case, used to indicate the datatype attribute. TheDatatype
interfaceDatatype
used by the CUBA framework to convert values to and from a string. -
@Convert
- Defines a JPA converter for a persistent attribute. JPA converter converts attribute values between its representations in the database and Java code. The component provides a set of spatial datatype s and JPA converters. More information is available in the component documentation . You can also use your own implementation of the JPA converter, which makes it possible to work with various sources of spatial data (for example, PostGIS ).
Thus, in order to turn an entity into a geo-object, you need to define an attribute of the JTS geometry type and annotate it with @Geometry
. There is another option - create a non-persistent attribute by providing getter / setter methods. This can be useful if you do not want to make changes to the data model and regenerate DDL scripts.
For example, consider the entity Address with separate attributes for latitude and longitude:
import com.haulmont.addon.maps.gis.utils.GeometryUtils; ... @Entity public class Address extends StandardEntity { ... @Column(name = "LATITUDE") protected Double latitude; @Column(name = "LONGITUDE") protected Double longitude; ... @Geometry @MetaProperty(datatype = "GeoPoint", related = {"latitude", "longitude"}) public Point getLocation() { if (getLatitude() == null || getLongitude() == null) { return null; } return GeometryUtils.createPoint(getLongitude(), getLatitude()); } @Geometry @MetaProperty(datatype = "GeoPoint") public void setLocation(Point point) { Point prevValue = getLocation(); if (point == null) { setLatitude(null); setLongitude(null); } else { setLatitude(point.getY()); setLongitude(point.getX()); } propertyChanged("location", prevValue, point); } ... }
If you decide to use this approach, make sure that the propertyChanged
method is called in the setter, since the component responds to this event by updating the geometry on the map.
Now that we have prepared the class of our geo-object, we can add instances of this class to the vector layer. A vector layer is essentially a connecting element between data (geo-objects) and a map. To connect geo-objects with a layer, you need to transfer the data container or, in the case of obsolete screens (up to version 7 of CUBA), datasource to the vector layer. This can be done in an XML descriptor:
<maps:geoMap id="map"> <maps:layers> ... <maps:vector id="addressesLayer" dataContainer="addressesDc"/> </maps:layers> </maps:geoMap>
As a result, the Address
class instances contained in the addressesDc
container will be displayed on the map.
Let's consider an elementary task: creating a screen for editing a geo-object with a map, where you can edit the geometry of the object. To solve the problem, you need to declare the visual component of GeoMap
in the XML descriptor of the editing screen and add a vector layer associated with the container containing the edited geo-object:
<maps:geoMap id="map" height="600px" width="100%" center="37.615, 55.752" zoom="10"> <maps:layers selectedLayer="addressLayer"> <maps:tile ..."/> <maps:vector id="addressLayer" dataContainer="addressDc" editable="true"/> </maps:layers> </maps:geoMap>
If you mark the vector layer as editable, interactive editing of the geo-object on the map is activated. If the geometry of the object is empty, the map will automatically switch to drawing mode. As you can see, to solve the problem, it is enough to declare a vector layer on the map and pass it the data container / datasource.
That's all. If we used Charts and Maps to solve the same problem, we would have to write quite a lot of code in the screen controller to provide similar functionality. With the new component of Maps, solving such problems is much simpler.
Canvas
There are times when you need to work not with entities. Instead, you want a simple API to add and draw geometries on a map, as it was in Charts and Maps . For this, the GeoMap
visual component has a special layer - Canvas . This is an auxiliary layer, which is on the map by default and which provides a simple API for adding and drawing geometries on the map. You can map.getCanvas()
map by calling the map.getCanvas()
method.
Next, we will look at a few simple tasks, how they were solved in Charts and Maps and how to do the same using Canvas.
Display geometries on a map
In Charts and Maps, geometry objects were created using the visual component of the map, used as a factory, and then added to the map:
Marker marker = map.createMarker(); GeoPoint position = map.createGeoPoint(lat, lon); marker.setPosition(position); map.addMarker(marker);
The new Maps component works directly with classes from the JTS library:
CanvasLayer canvasLayer = map.getCanvas(); Point point = address.getLocation(); canvasLayer.addPoint(point);
Geometry Editing
In Charts and Maps, you could designate geometry as editable. When such geometries were changed through the UI, the corresponding events were called:
Marker marker = map.createMarker(); GeoPoint position = map.createGeoPoint(lat, lon); marker.setPosition(position); marker.setDraggable(true); map.addMarker(marker); map.addMarkerDragListener(event -> { // do something });
In the Maps component, when adding JTS geometry to Canvas, the corresponding method returns a special object that is a representation of this geometry on the map: CanvasLayer.Point
, CanvasLayer.Polyline
or CanvasLayer.Polygon
. This object has a fluent interface for setting various geometry parameters, it can also be used to subscribe to events related to geometry, or to delete geometry from a Canvas.
CanvasLayer canvasLayer = map.getCanvas(); CanvasLayer.Point location = canvasLayer.addPoint(address.getLocation()); location.setEditable(true) .setPopupContent(address.getName()) .addModifiedListener(modifiedEvent -> address.setLocation(modifiedEvent.getGeometry()));
Drawing geometries
In the old add-on Charts and Maps there was an auxiliary component - DrawingOptions
. It was used to activate the ability to draw on the map. After the geometry was drawn, the corresponding event was raised:
DrawingOptions options = new DrawingOptions(); PolygonOptions polygonOptions = new PolygonOptions(true, true, "#993366", 0.6); ControlOptions controlOptions = new ControlOptions( Position.TOP_CENTER, Arrays.asList(OverlayType.POLYGON)); options.setEnableDrawingControl(true); options.setPolygonOptions(polygonOptions); options.setDrawingControlOptions(controlOptions); options.setInitialDrawingMode(OverlayType.POLYGON); map.setDrawingOptions(options); map.addPolygonCompleteListener(event -> { //do something });
The Maps component makes the same much easier. The new Maps Canvas contains a set of methods for drawing geometries. For example, to draw a polygon, use the canvas.drawPolygon()
method. After calling this method, the map will switch to polygon drawing mode. The method accepts the Consumer<CanvasLayer.Polygon>
function, in which you can perform additional actions with the drawn polygon.
canvasLayer.drawPolygon(polygon -> { territory.setPolygon(polygon.getGeometry()); });
Geo-Analysis Tools
Clustering
Another useful tool present in the new Maps component is point clustering. If the layer consists of a large number of points, you can enable clustering to group nearby points into clusters, so that the map looks more accurate and better perceived:
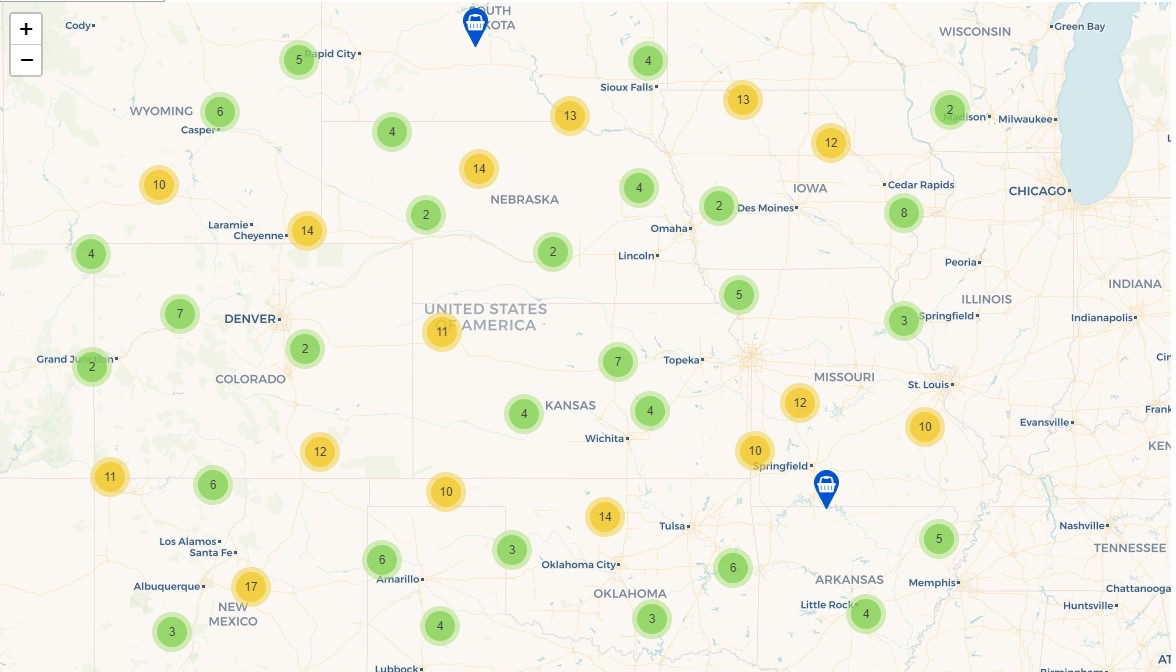
Clustering is enabled by adding the cluster
tag inside the vector
tag in the XML descriptor:
<maps:vector id="locations" dataContainer="locationsDc" > <maps:cluster/> </maps:vector>
You can also enable clustering based on point weights. The weight of the point is the value of the attribute specified in the weightProperty
parameter.
<maps:vector id="orders" dataContainer="ordersDc" > <maps:cluster weightProperty="amount"/> </maps:vector>
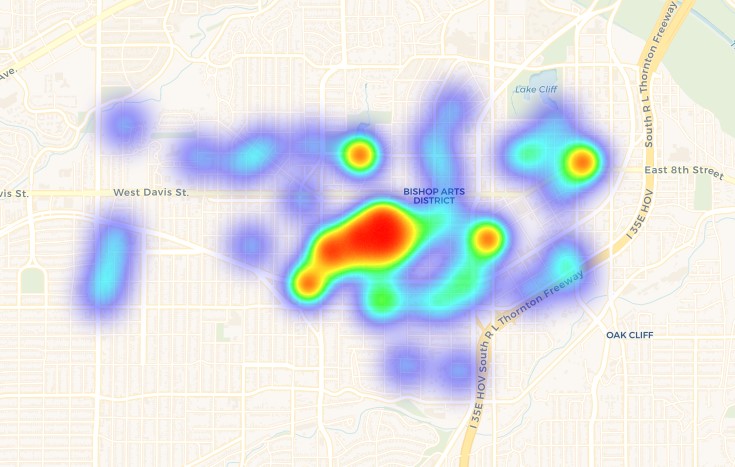
Heatmaps
Heatmaps are a visual representation of data density among multiple geographic locations. The visual component of GeoMap contains a method for adding a heat map: addHeatMap(Map<Point, Double> intensityMap)
.
Conclusion
Processing, analysis and visualization of geospatial data is an essential element of many business applications. The CUBA Maps component will provide your CUBA application with all the necessary tools for implementing this functionality.
A layer-based structure helps in building maps with any content. With tile / WMS layers, you can use any provider you need as a base card. Vector layers allow you to effectively work with sets of homogeneous geo-objects. Canvas provides a simple API for displaying and drawing geometries on a map.
The component works with spatial types from the JTS library, which makes it compatible with many other frameworks (for example, GeoTools ) for solving a wide range of tasks related to the processing and analysis of geographic data.
We hope you enjoy the component. Waiting for your feedback!
All Articles