How to work with Google Trends: a complete guide for beginners
Hello, Habr!
Many do not know how to work with trends on the Internet.
And even more so, they don’t know about the existence of a free service that solves this problem - Google Trends
The service will help you find out what excites your customers today, whether your product is interesting to the market, what seasonality it has, in which region the greatest interest is in the product and your competitor.
The article will be useful to specialists who have not previously worked with the service.
First, let's understand what you can do with Google Trends:
- Determine topic / search term popularity and seasonality
- Find out the popularity of the query by region / city
- Compare competitor requests
- Find out what queries were popular in 2018 and other years.
Let's get started!
We determine the popularity of the topic / search query and seasonality
Let's start with the Analysis section.
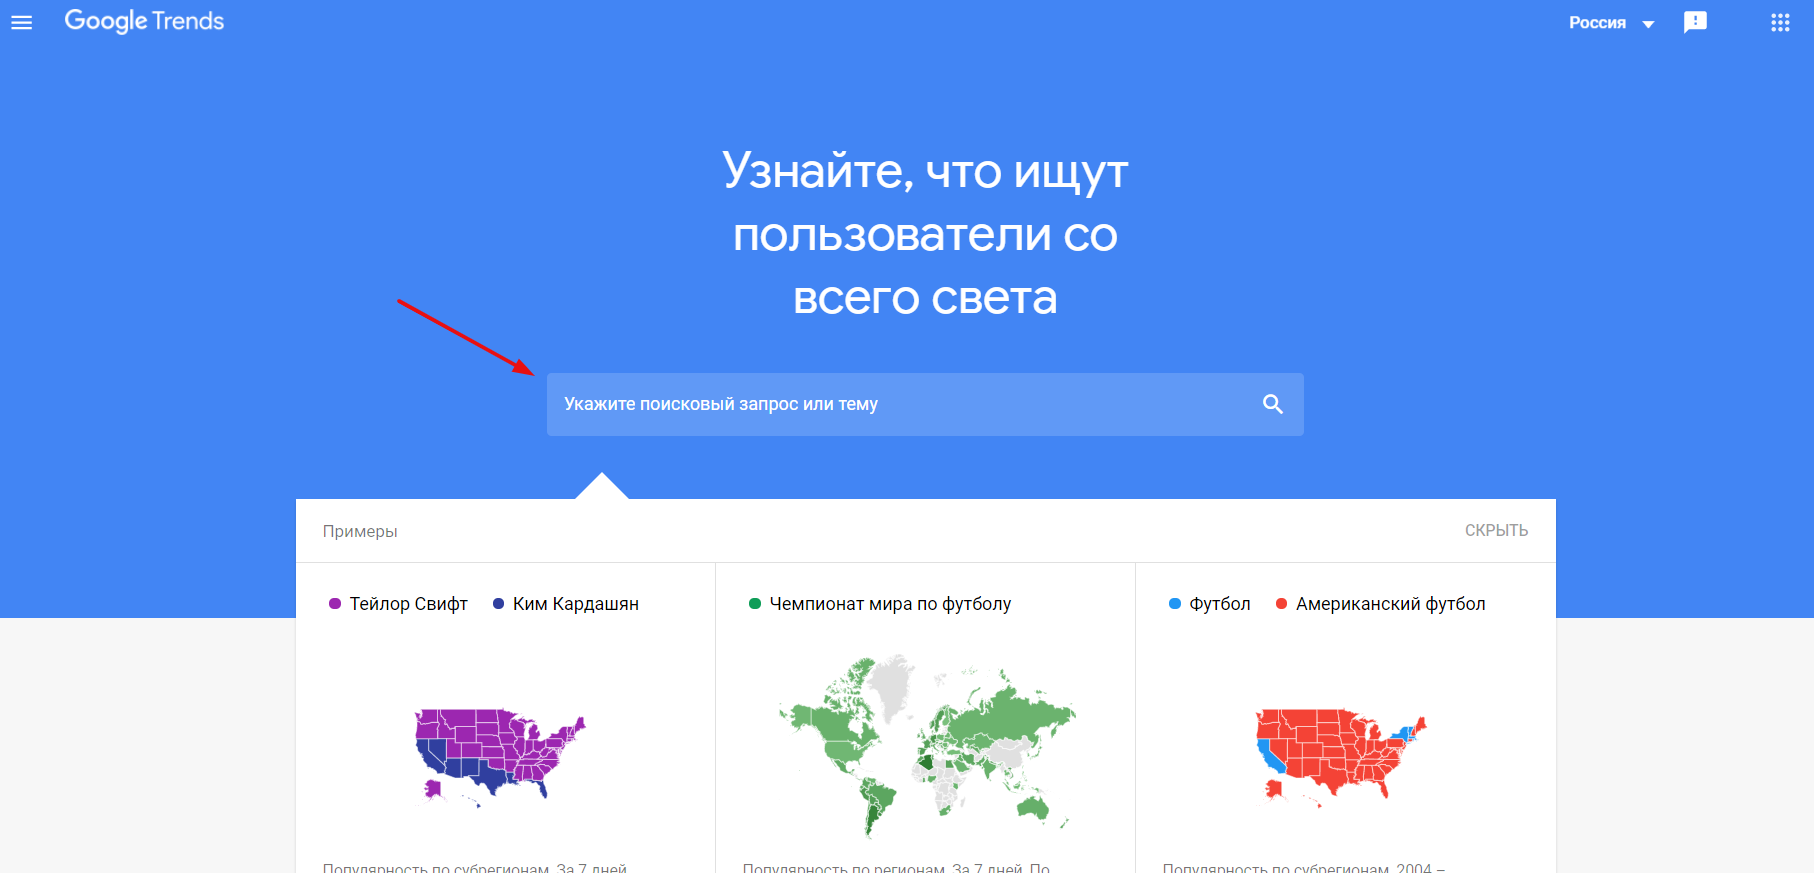
You can get into it directly from the main page by entering a search word / topic in the search box
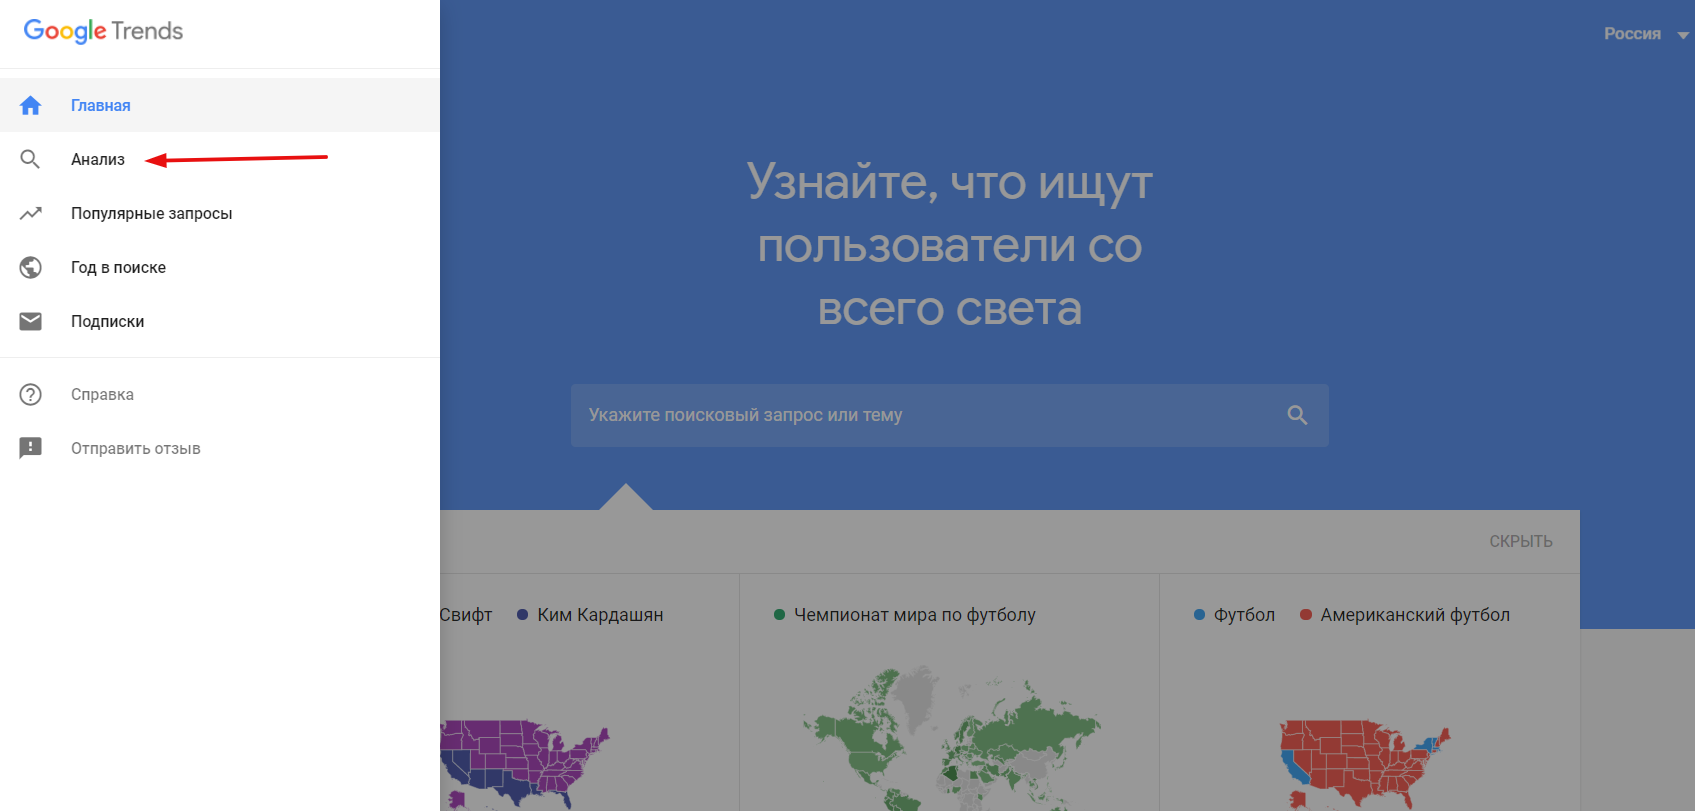
Or through the menu in the upper left.
In this section, we can find out the dynamics of search queries and their popularity.
For example, I’ll take the “last minute tours” request
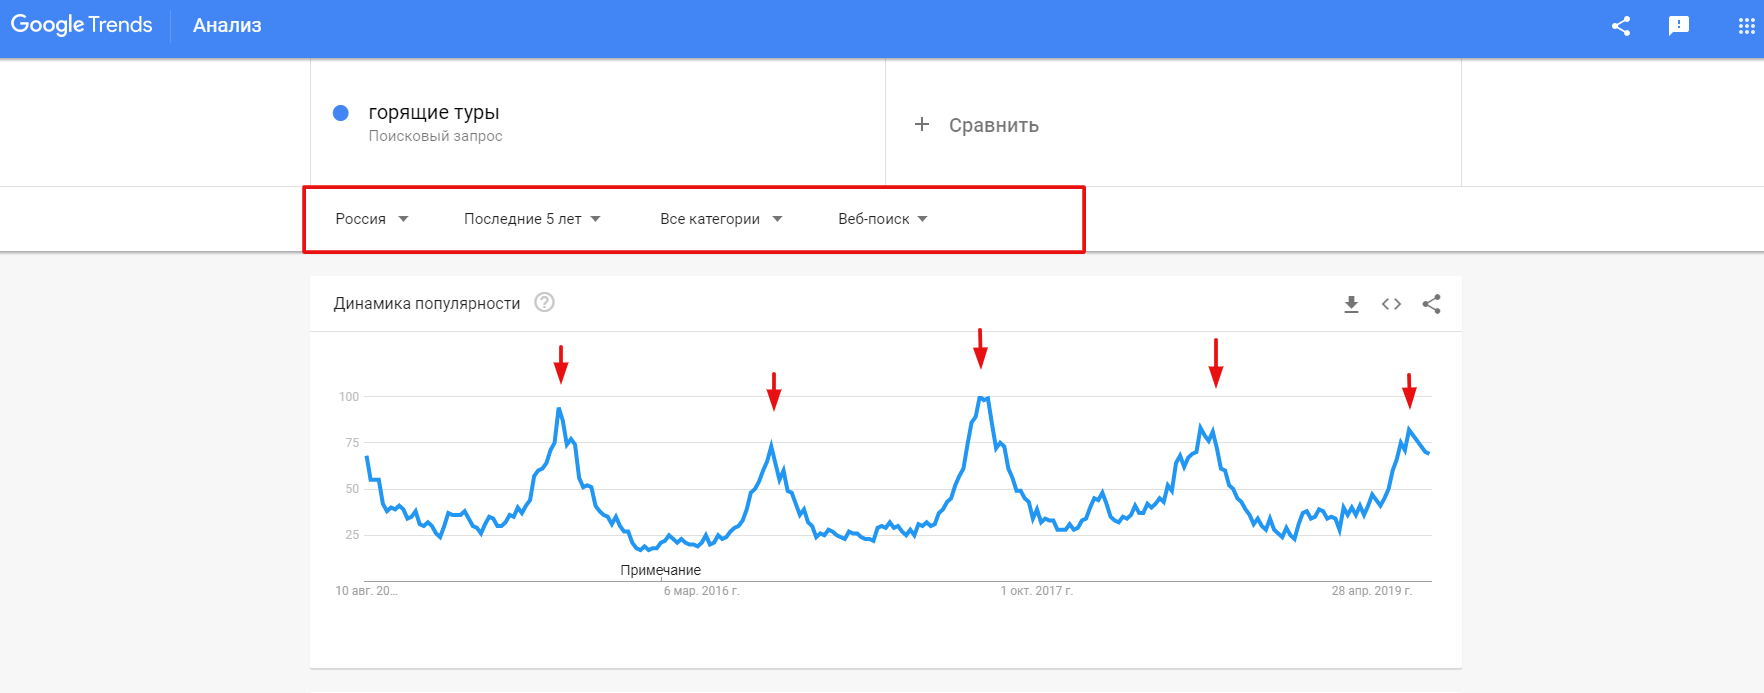
On the graph we see how popular this request is, and a pronounced seasonality (from June to mid-July).
When planning an advertising campaign, it is worth considering the growth and decline in demand in order to choose the right strategy and calculate the budget.
Pay attention to the filters (those above the graph are highlighted in red)
Region - you can see statistics around the world, as well as find out the popularity of the request at the country or city level.
Period - you can set the period from 2004.
Category - the function will be useful if you need to refine the category of the search query. For example, in the query “Turkey”, using the category “Travel offers”, we filter out all that is superfluous and will be able to analyze exactly the travel offers.
Type of search - here you can choose exactly where we need to analyze the request: on the Internet, pictures, news, as well as search on YouTube and Google Shopping.
Request popularity by region or city
One of the important strengths of Google Trends is the ability to analyze data with a detailed breakdown by region and city.
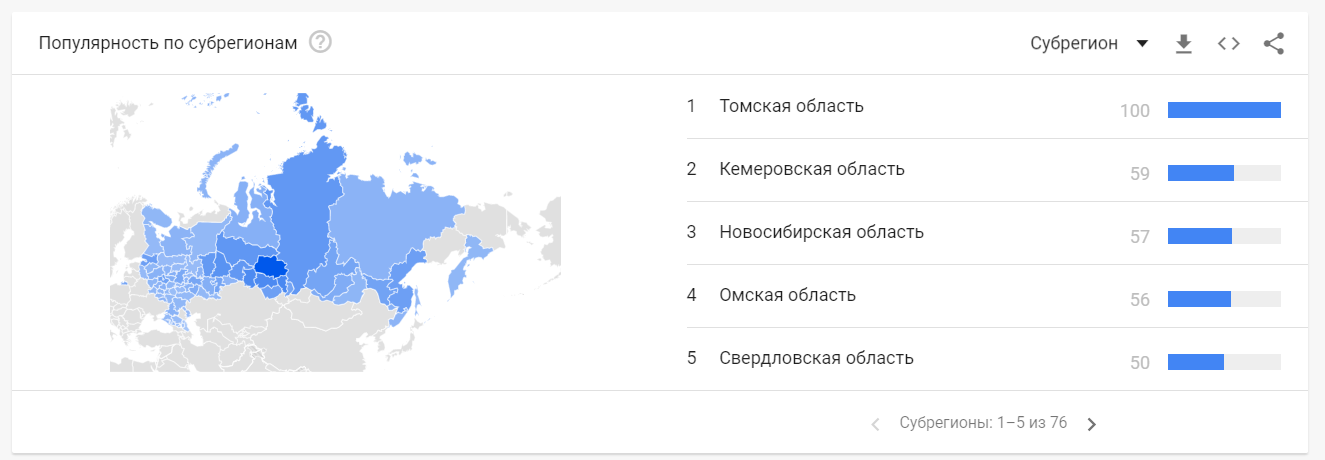
Here you can find out which regions are more interested in this topic.
An important indicator when distributing the advertising budget between regions.
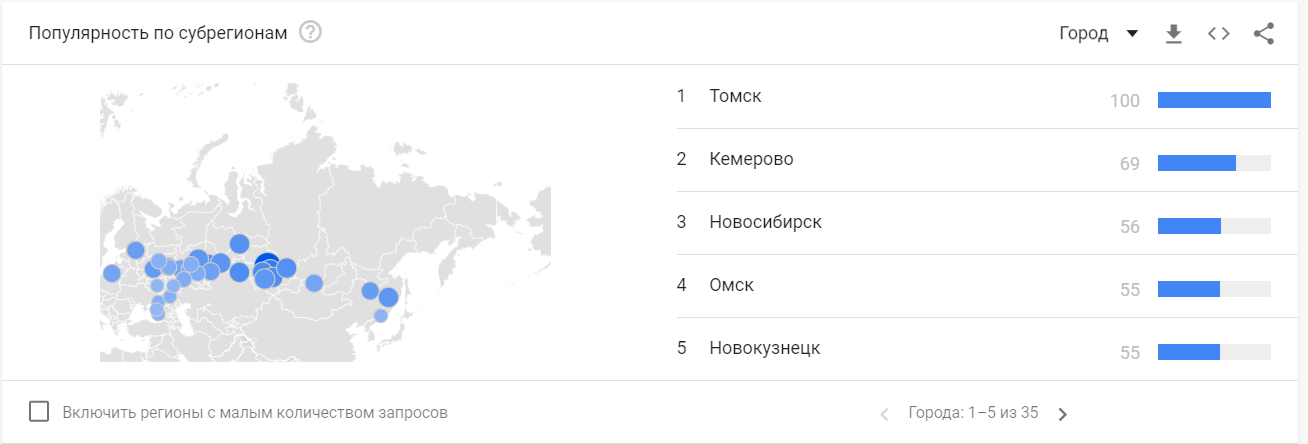
And on this graph we see popularity by city
At the bottom of the page you can see another useful feature - related searches and topics. It displays what users enter in the search along with the queries you specify.
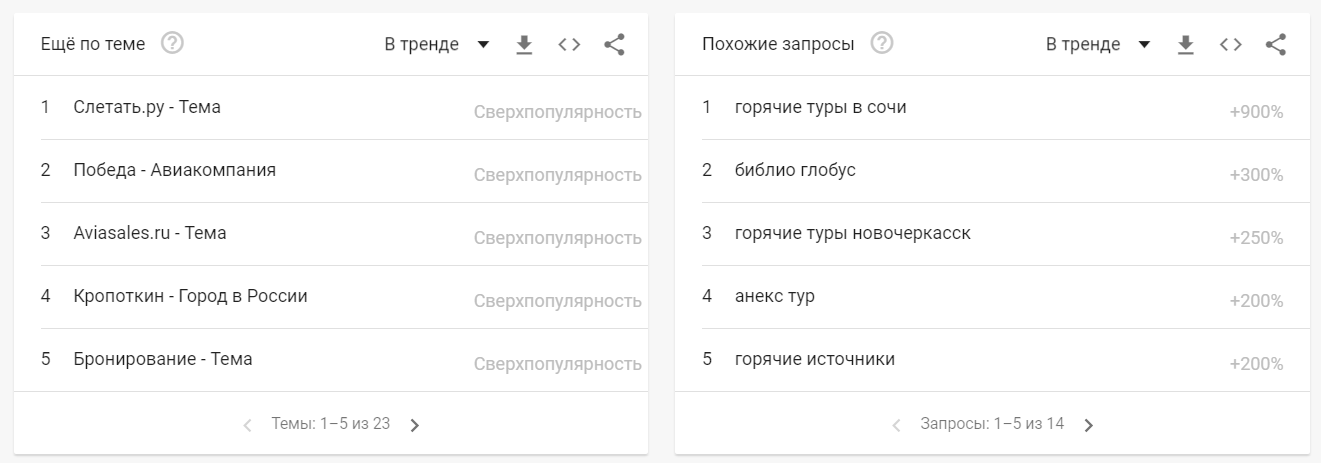
After examining the requests and adding them to the advertising campaign, you will be one step ahead of the competition.
3. Compare requests for competitors
In the “analysis” section, you can find out not only the dynamics of requests, seasonality and analysis by region. It is still possible to compare up to 4 segments (search queries, products, topics, etc.)
You can compare both search queries and companies.
I will give an example of a comparison of three companies: Huawei, Apple, Samsung
I take data on Russia over the past 5 years.
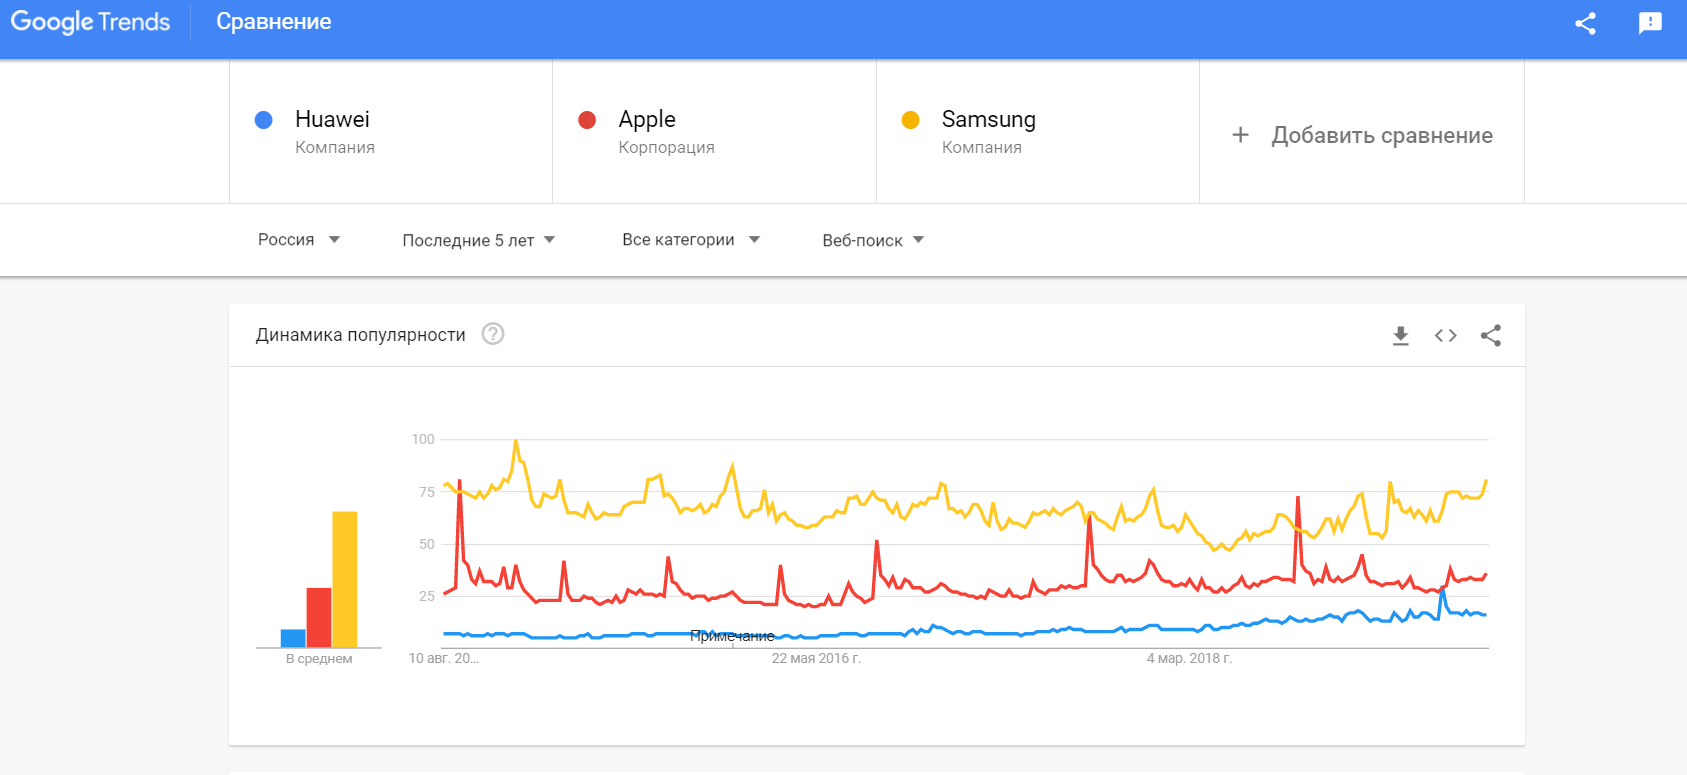
The graph shows that Samsung is leading.
We can also see the dynamics of interest by region, this chart will more clearly show the situation on the market.
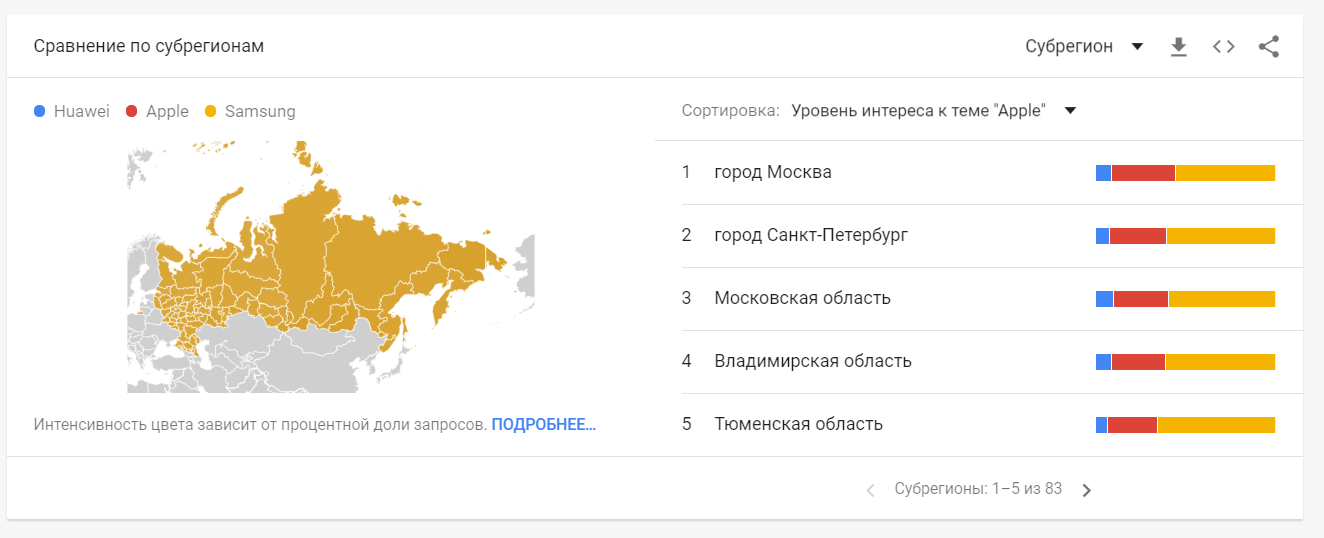
It is evident that the highest interest in Apple is in Moscow, Moscow Region and St. Petersburg, which is not surprising.
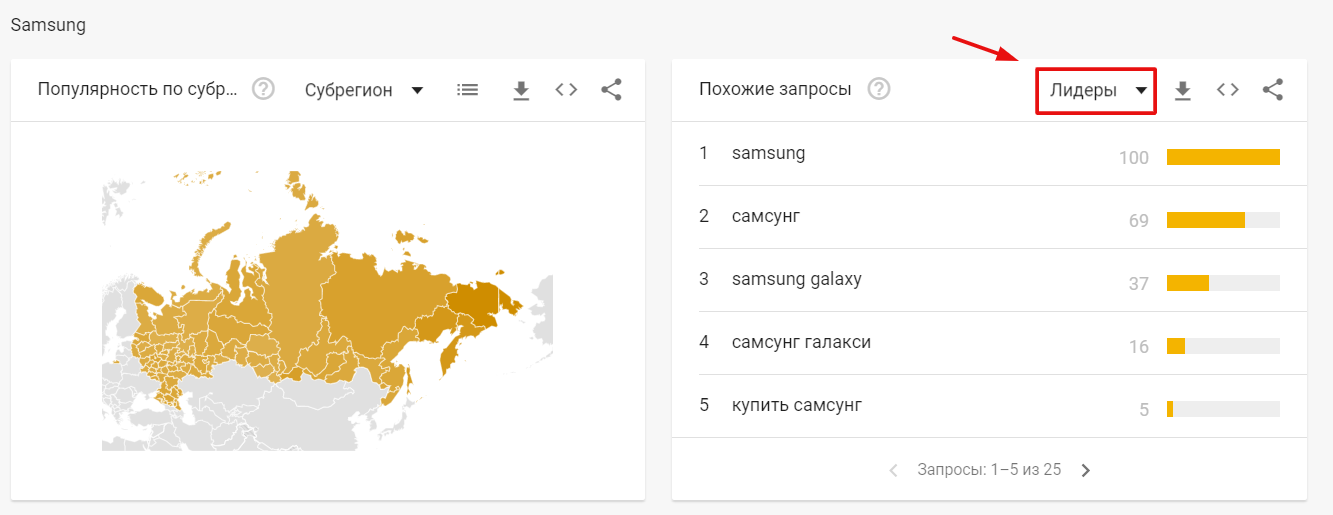
We can also study the request / company in more detail, see the popularity in the region and identify similar requests and trends.
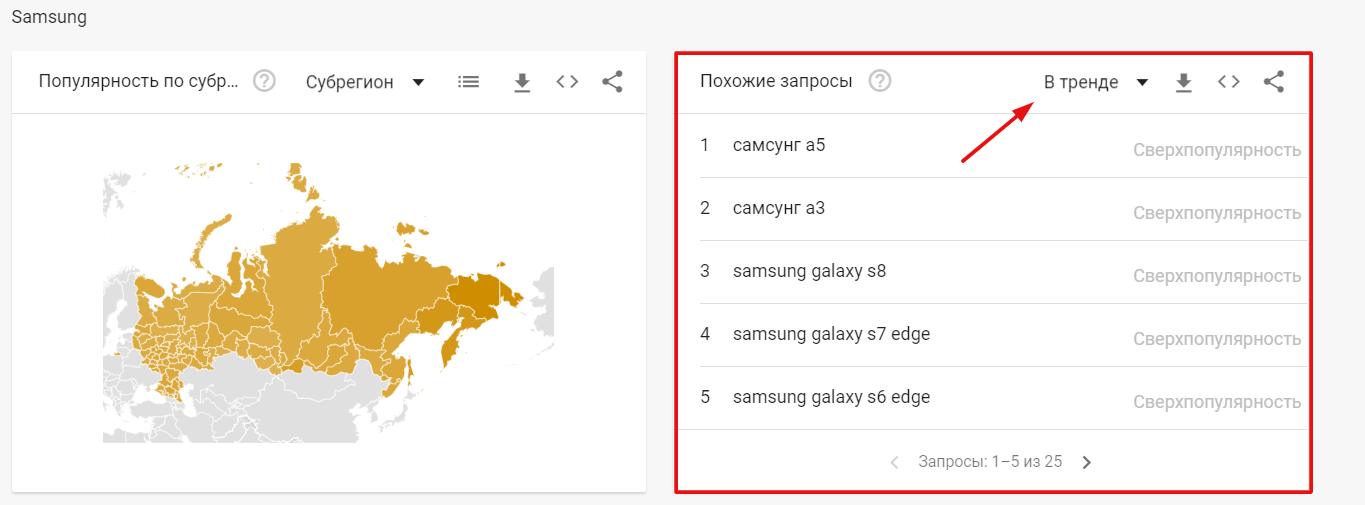
And on this graph we see the leader in search queries
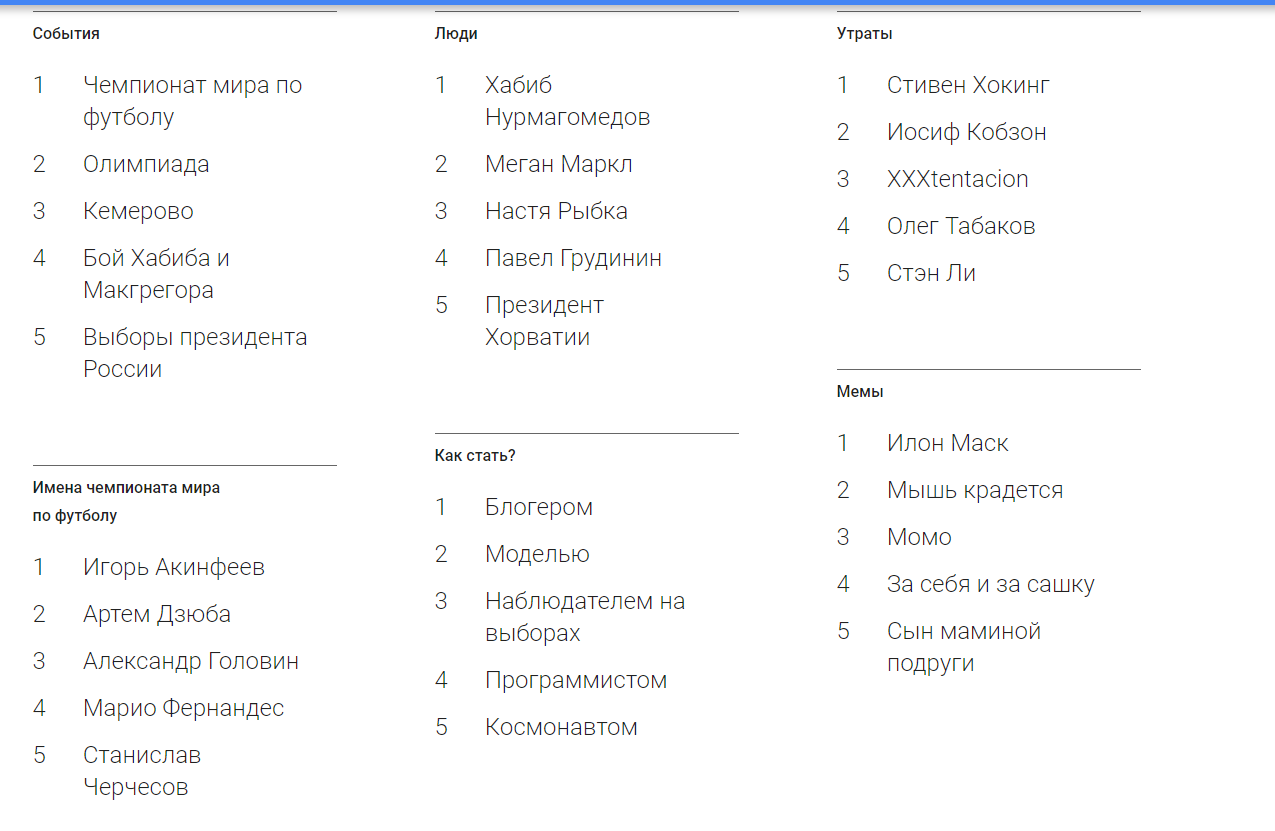
"Year in the search"
In this section, we find out what was popular with Google in 2018 (Statistics are available from 2008 to 2018)
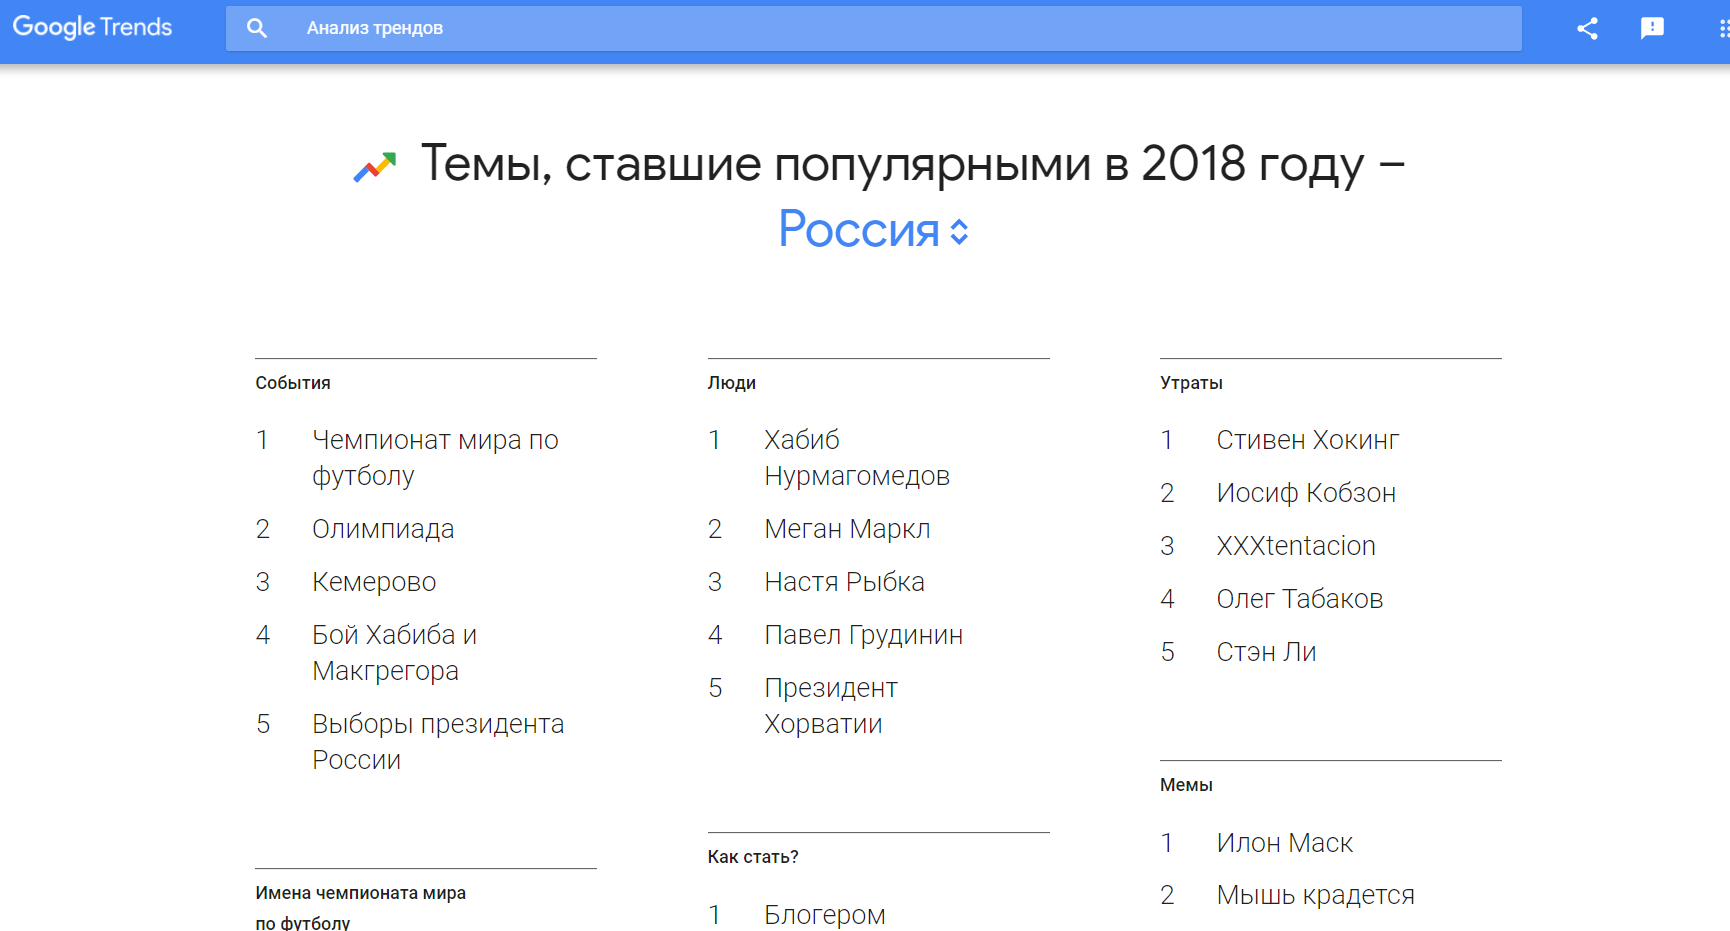
The section has six blocks, each of the blocks is expanded to ten positions.
Here you can explore trends around the world.
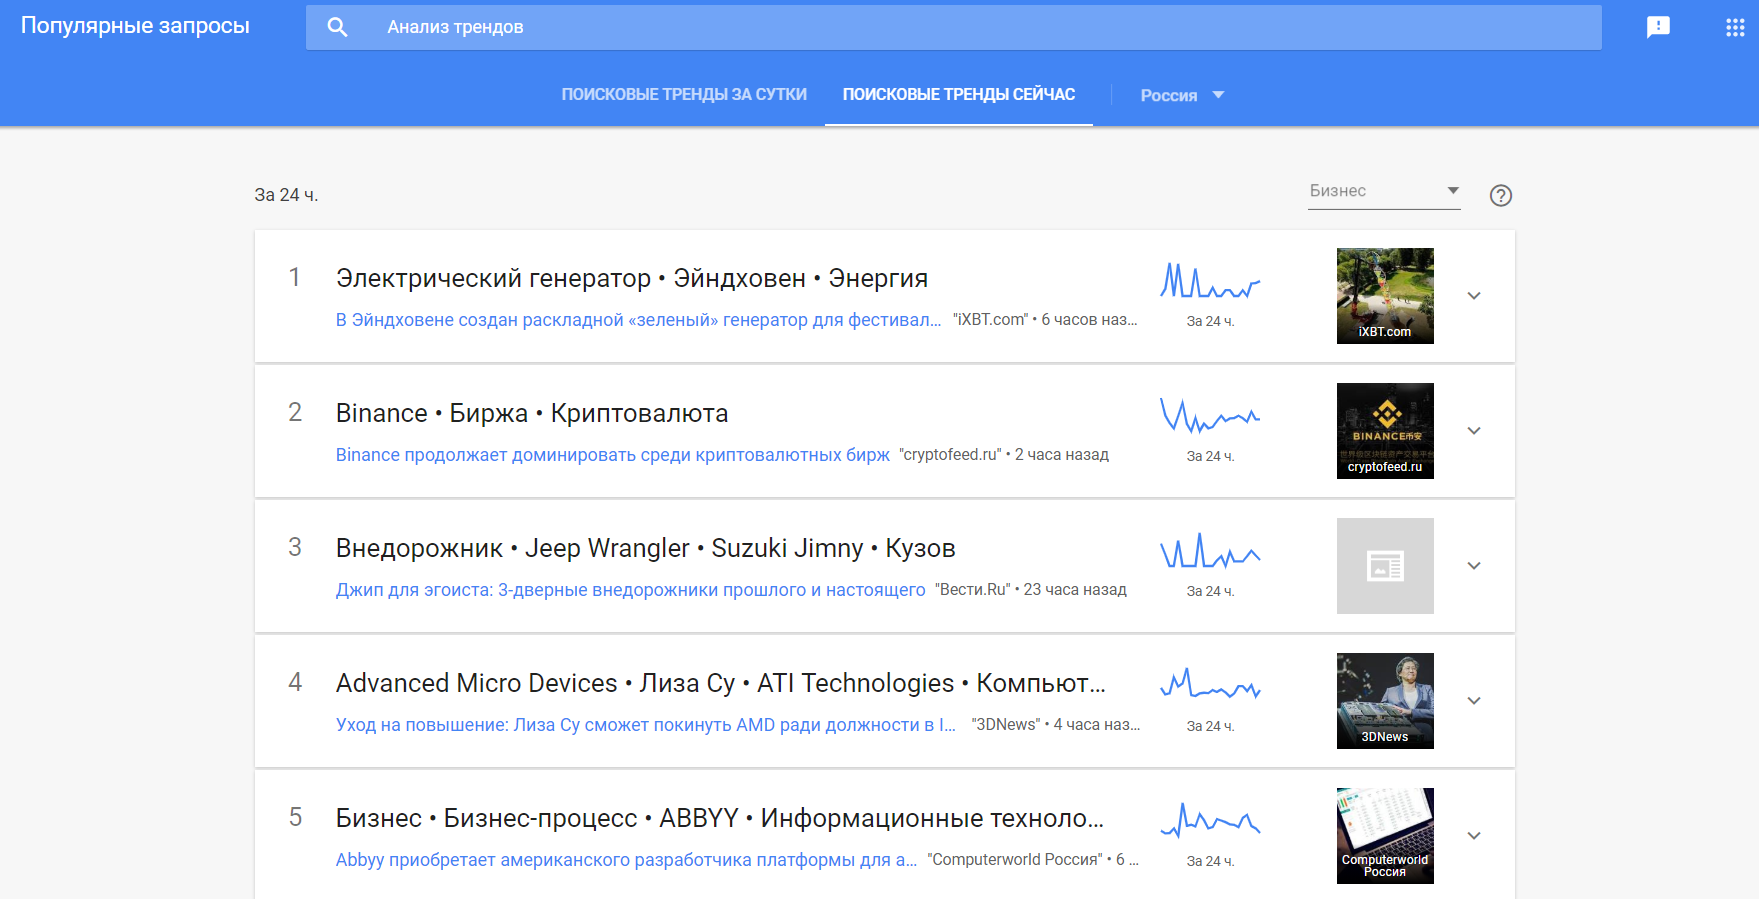
"Popular Queries"
In the “Popular Queries” section, you can find topics that are gaining popularity.
The algorithm is designed so that it determines hot trends until a peak is reached.
You have time to get into the trend and get a portion of visitors before the interest in it falls.
How data is calculated in Google Trends
Data for a specific time period or region is calculated as follows:
The relative popularity of queries is calculated by dividing by the total number of search queries in a particular area for a certain time. Otherwise, the first places would always be areas where users most actively search on Google.
The results are ranked on a 100-point scale, which reflects the popularity of the topic in relation to all other queries related to any topics.
In regions with the same number of queries for a particular phrase, the total volume of search queries may be different.
There are no queries in the analysis results:
Unpopular. Google Trends presents only queries that are common enough. For the rest, you will see zero values.
Duplicate We ignore the same requests from the same user for a short period of time.
With special characters. Requests with apostrophes and other special characters are filtered out.
Conclusion
Google Trends is one of the best free tools for analyzing seasonality, trends or forecasting demand.
More such articles can be read on my telegram channel (proroas). I write about digital marketing and web analytics.
Thank you and your high conversions!
All Articles