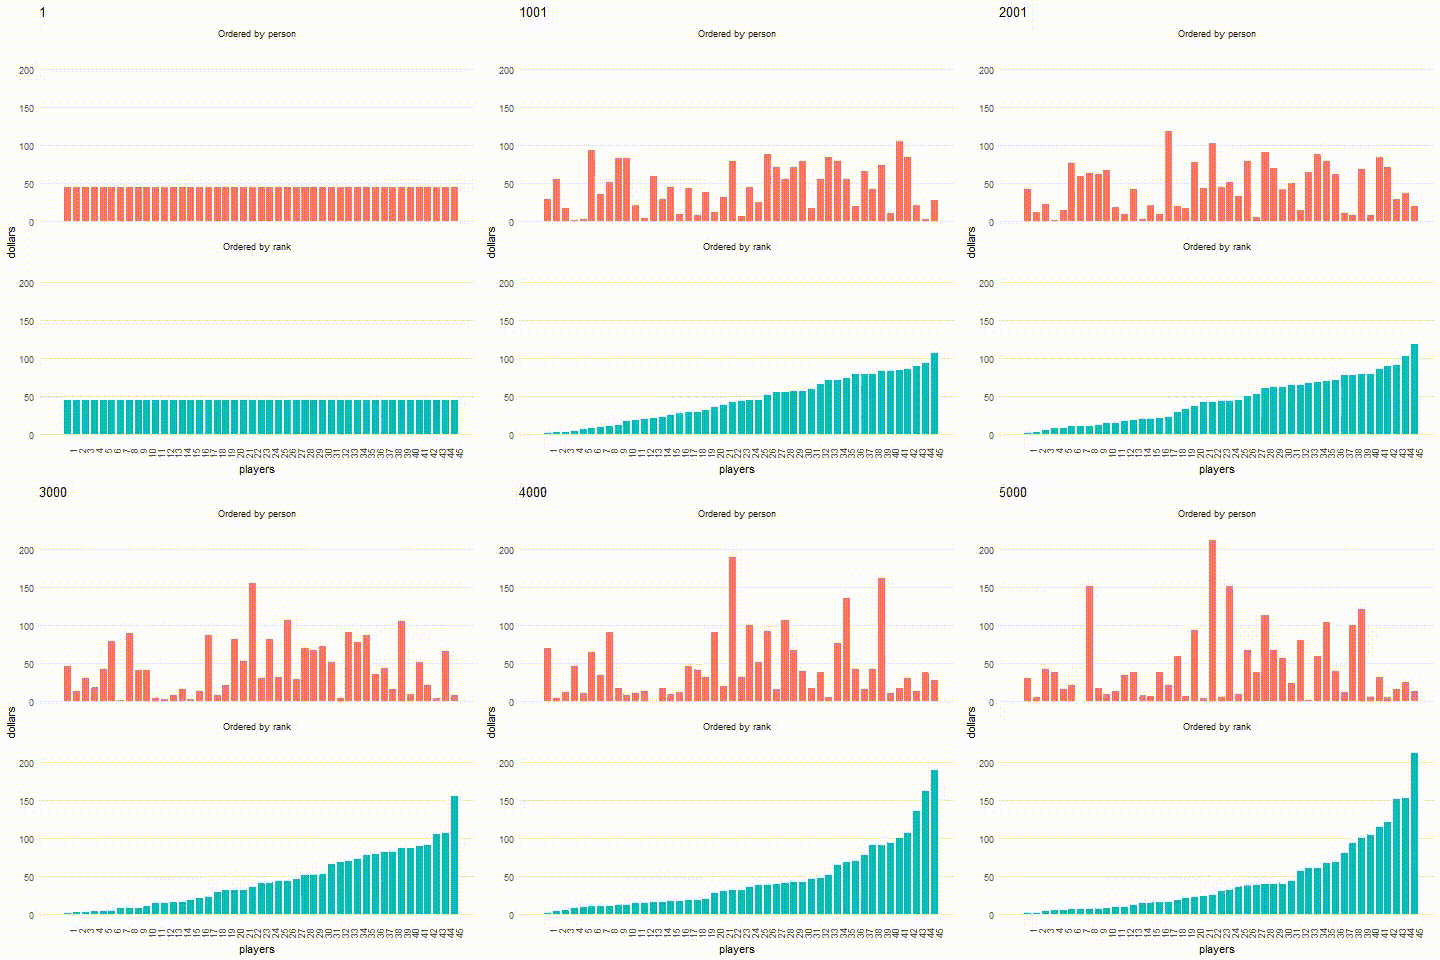
同じ部屋に閉じ込められた人々が単にお互いにお金を与えると想像してください。それぞれが他の誰かにランダムに1ドルを与えます。 これらの人々の間で資金はどのように分配されますか? 答えは驚くかもしれません。
タスク:ランダム分配の場合のお金の分配方法
Decision Science Newsは、異常な実験を説明する資料を公開しました。
「100人が同時にいる部屋を想像してください。 それらのそれぞれは100ドルを持っています。 毎秒、部屋の全員が無作為に選ばれた1人に1ドルを渡します。 しばらくすると、部屋の全員にお金が分配されますか?」
もちろん、この課題に直面した人々のほとんどは、最終的には誰もがほぼ同額のお金を受け取ると仮定していました。 Decision Science Newsのインタビューを受けた5人の理学博士でさえ、同じ最初の結論に達しました。 しかし、本当にそうですか?
分布はどのように見えるか
ここで資金がどのように分配されるかがはっきりと見えます。

インフォグラフィックは5000秒の時間間隔をカバーします。 Y軸は、思考実験の各参加者が持っている金額を示します。 カウントダウンは45ドルから始まります。 X軸は、部屋にいる人の数-45人を示しています。
赤い列は、各人が1秒間にどれだけのお金を持っているかを示しています。 青のストライプは、富がどのように分配されているかを示すために設計されています。 右端の青い列は、最も高い赤いバーに対応しています。
次のコードを使用して、実験の結果を自分で確認できます( R 、 tidyverseおよびgganimateが必要です )。
library(tidyverse) library(gganimate) NUMPLAYERS = 45 ROUNDS = 5000 INITWEALTH = 45 #initialize the bank #columns wealths of the NUMPLAYERS players #rows show wealths of each of the ROUNDS ticks of the clocks bank = matrix(0, nrow = ROUNDS, ncol = NUMPLAYERS) bank[1,] = c(rep(INITWEALTH, NUMPLAYERS)) #function to give a dollar to someone other than oneself get_recipient = function(player) { sample(setdiff(1:NUMPLAYERS, player), 1)} #execute trades and update the ledger for (i in 2:ROUNDS) { #every player with wealth chooses another person to receive a buck recipients = sapply(which(bank[i - 1,] > 0), get_recipient) #table of the dollars owed each person count_table = table(recipients) #get the indices of the people owed money indices = as.integer(names(count_table)) #everyone gives up a dollar, unless they are at zero bank[i,] = ifelse(bank[i - 1,] > 0, bank[i - 1,] - 1, bank[i - 1,]) #selected people receive dollars bank[i, indices] = bank[i, indices] + count_table } ####################Animate it #Make a suitable long data frame df = as.data.frame(bank) names(df) = 1:NUMPLAYERS df = df %>% mutate(frame = 1:ROUNDS) %>% gather(person, wealth, 1:NUMPLAYERS) %>% mutate(person = as.numeric(person)) %>% arrange(frame) %>% group_by(frame) %>% mutate(rank = rank(wealth, ties.method = "random")) %>% ungroup() %>% gather(histtype,playerid,c(person,rank)) %>% mutate(histtype = sprintf("Ordered by %s", histtype)) p <- ggplot(df, aes(x = playerid, y = wealth, frame = frame, fill=histtype)) + theme_minimal() + theme(panel.grid.major.x = element_blank(), panel.grid.minor = element_blank()) + geom_rect(aes( xmin = playerid - .4, xmax = playerid +.4, ymin = 0, ymax = wealth)) + scale_x_continuous(breaks = 1:NUMPLAYERS) + coord_cartesian(xlim = c(0, NUMPLAYERS), y = c(0, 5 * INITWEALTH)) + theme(axis.text.x = element_text(angle = 90, hjust = 1)) + labs(x='players',y='dollars') + facet_wrap( ~ histtype,ncol=1) + theme(legend.position = "none") p #set options for the animation package. Need ImageMagick installed on your computer animation::ani.options(nmax = ROUNDS, convert = 'C:\\Program Files\\ImageMagick-7.0.6-Q16') #save the movie gganimate(p, "dollar_stacked.mp4", interval = .01)
ご覧のように、最も安全に見えるシナリオでも不平等が生じます。 したがって、財政の分布を監視する必要があります。
金持ちは永遠に金持ちのままですか?
数学者のジョーダン・エレンバーグは 、多くの人が、ランダムに分配された場合、誰もがほぼ等しい金額を受け取ると考えると説明しています。 実際、財政の分配における不平等はほとんどすぐに現れることが判明しています。 さらに、人々がランダムにお互いにお金を与え続けると、それは持続します。
これは、結果として、一部の人が金持ちになり、最高位を失うことはないということですか? まったくありません。 それどころか、彼らの幸福は常に変化しています。それぞれの人は、時間とともに豊かになるか、貧しくなります。
したがって、長い目で見れば、お金を分配するためのすべてのオプションは等しくありそうです。 実験オブザーバーは、実験の開始時と同様に、ある人が9,901ドルを持ち、他の人がそれぞれ1ドルを持ち、すべての資金の分配が等しい状況を見ることができます。