はじめに
この記事では、Linuxで利用可能な組み込みの一般的なツールを使用してGoアプリケーションをプロファイルおよび最適化する方法を示します。
プロファイリングと最適化とは何ですか? プログラムが十分に速く動作せず、メモリを大量に使用し、プロセッサを最適に使用しない場合、問題を理解して修正します。これがプロファイリングと最適化です。
誤ったアプリケーション操作の問題をすぐに遮断するために、このような定義を与えました。 この記事では、マルチスレッドプログラミングの問題、データフライト(英語のデータレース )、エラーの検索(英語のデバッグ )については説明しません。 Goには、これらすべてのための独自のユーティリティとアプローチがありますが、将来のためにこのトピックを残しましょう。

CPU
プロセッサを使用して今日のレビューを始めましょう。
Goには組み込みのプロファイラーがあり、C / C ++用のツールのgperftoolsセットからプロファイラーのイメージと類似性で作成されています。 さらに、Goで記述されたプロファイリング結果を視覚化するために設計されたpprofユーティリティの類似物がメインバージョンになり、GoとC / C ++の両方の視覚化に推奨されます。
分類に関しては、Goプロファイラーは「 サンプリングプロファイラー 」です。 これは、一定の頻度でプログラムを中断し、スタックトレースを取得し、どこかに書き込むことを意味し、最終的には、スタックトレースで異なる関数が検出される頻度に基づいて、どの関数が使用されたかを理解しますより多くのプロセッサリソース、およびより少ないリソース。
ほとんどすべてのGoユーティリティとプロファイラーはいくつかの方法で起動できます。そのうちのいくつかはこの記事で説明します。
例から始めて、さらに詳しく話しましょう。
例
package perftest import ( "regexp" "strings" "testing" ) var haystack = `Lorem ipsum dolor sit amet, consectetur adipiscing elit. Cras accumsan nisl et iaculis fringilla. Integer sapien orci, facilisis ut venenatis nec, suscipit at massa. Cras suscipit lectus non neque molestie, et imperdiet sem ultricies. Donec sit amet mattis nisi, efficitur posuere enim. Aliquam erat volutpat. Curabitur mattis nunc nisi, eu maximus dui facilisis in. Quisque vel tortor mauris. Praesent tellus sapien, vestibulum nec purus ut, luctus egestas odio. Ut ac ipsum non ipsum elementum pretium in id enim. Aenean eu augue fringilla, molestie orci et, tincidunt ipsum. Nullam maximus odio vitae augue fermentum laoreet eget scelerisque ligula. Praesent pretium eu lacus in ornare. Maecenas fermentum id sapien non faucibus. Donec est tellus, auctor eu iaculis quis, accumsan vitae ligula. Fusce dolor nisl, pharetra eu facilisis non, hendrerit ac turpis. Pellentesque imperdiet aliquam quam in luctus. Curabitur ut orci sodales, faucibus nunc ac, maximus odio. Vivamus vitae nulla posuere, pellentesque quam posuere` func BenchmarkSubstring(b *testing.B) { for i := 0; i < bN; i++ { strings.Contains(haystack, "auctor") } } func BenchmarkRegex(b *testing.B) { for i := 0; i < bN; i++ { regexp.MatchString("auctor", haystack) } }
Nが文字列内の部分文字列をN回検索する2つのベンチマークを次に示します。 1つは正規表現パッケージを使用してこれを行い、もう1つは文字列パッケージを使用します。 auctorという単語を探しています。
ベンチマークを実行し、結果を確認します。
$ go test -bench=. testing: warning: no tests to run BenchmarkSubstring-8 10000000 194 ns/op BenchmarkRegex-8 200000 7516 ns/op PASS ok github.com/mkevac/perftest00 3.789s
結果が期待されます、なぜなら 正規表現ははるかに強力であるため低速なツールですが、このコードをプロファイルしてみましょう。
この場合にプロファイラーを使用する最も簡単な方法は、追加オプション-cpuprofile cpu.outを使用して同じベンチマークを実行することです 。 その結果、プロファイリング結果と、文字の取得、分解などに必要なバイナリを含むcpu.outファイルがディレクトリに表示されます。
実際、バイナリは常に作成されますが、通常の場合、一時ディレクトリに作成され、ベンチマークの直後に削除されます。 プロファイリングで起動する場合、結果のバイナリは削除されません。
したがって、プロファイリングを使用してBenchmarkRegex ベンチマークを実行します 。
$ GOGC=off go test -bench=BenchmarkRegex -cpuprofile cpu.out testing: warning: no tests to run BenchmarkRegex-8 200000 6773 ns/op PASS ok github.com/mkevac/perftest00 1.491s
ご覧のとおり、最初にプレフィックスGOGC = offを付けてベンチマークを開始しました。 GOGC環境変数をoffに設定すると、ガベージコレクターが無効になります。 ガベージコレクターとそのスタックトレースがストーリーの流れから私たちの注意をそらさないように、私は意識的にこれを行いました。
ちなみに、短命のスクリプトとプログラムのGCを無効にすることは、プログラムの実行時間を数倍短縮できる優れたソリューションです。 Goだけではありません。 PHPの場合、私が知る限り、この「フェイント」を使用することもあります。 実際、サーバーのメモリ使用量により、動作時間を短縮しています。
ここで、pprofユーティリティを使用して呼び出しグラフを視覚化します。
$ go tool pprof perftest00.test cpu.out
グラフを取得する最も簡単な方法は、SVGイメージを一時ディレクトリに自動的に保存し、ブラウザーを起動して表示するwebコマンドです。
リモートサーバーで作業している場合、このオプションは機能しません。 SSHの-Yスイッチを使用してXサーバーを終了するか、 go tool pprof -svg ./perftest00.test ./cpu.out> cpu.svgコマンドを使用してSVGファイルをディスクに保存し、コンピューターにコピーして、開いて
私のようなOSXの場合、SSH転送が機能するようにXQuartz Xサーバーをインストールする必要があります。
結果の呼び出しグラフを見てみましょう。
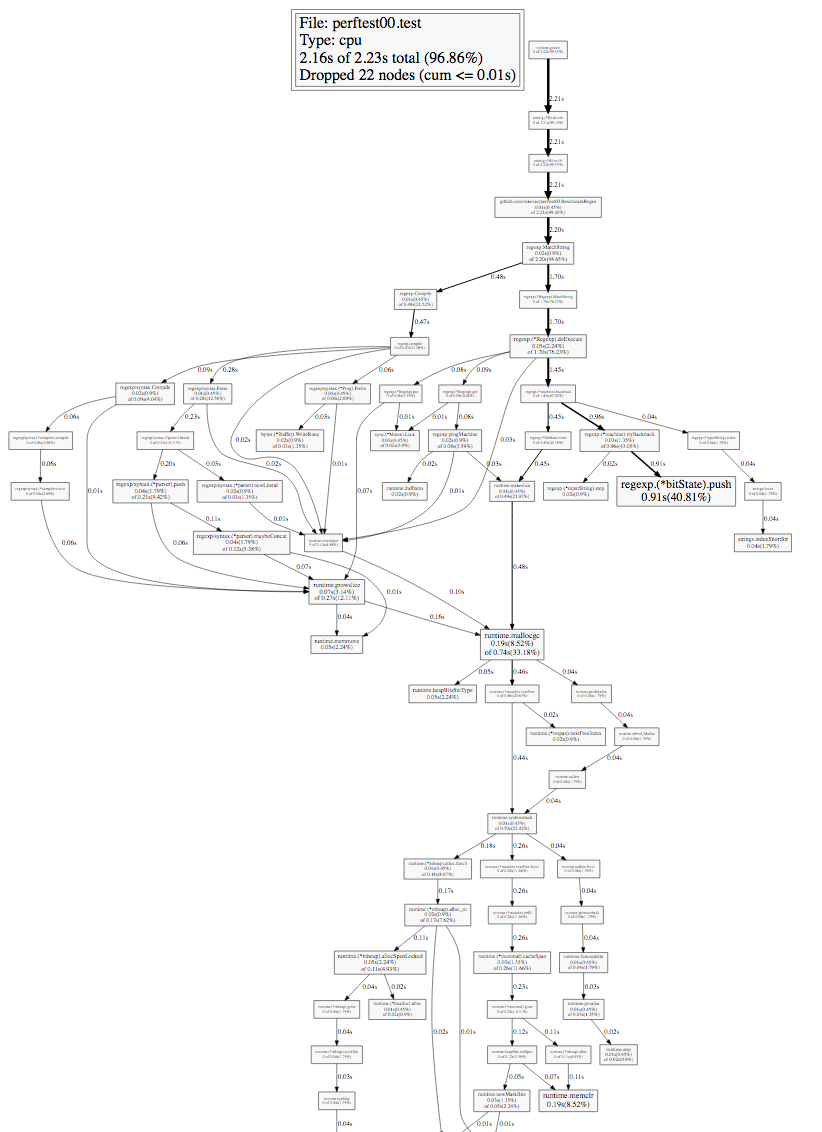
このようなグラフを検討する際には、まず、エッジの太さ(矢印)とグラフのノードのサイズ(四角)に注意する必要があります。 時間は端で署名されます。プロファイリング中にスタックトレースにある特定のノードまたは下位ノードの長さ。
最初の(一番上の)ノードから太字の矢印に沿って進み、最初の分岐点に行きましょう。
BenchmarkRegex関数、呼び出すregexp.MatchString関数、および分岐していることがわかります。
正規表現を使用したことがある場合、ほとんどの実装はプロセスを正規表現の初期文字列表現を何らかの中間バリアントにコンパイルし、実際にこの中間バリアントを使用する段階に分割することをご存じでしょう。
些細な最適化が頼りになります:コンパイルを1回実行しますが、繰り返しはしません。
それをやってみましょう:
package perftest import ( "regexp" "strings" "testing" ) var haystack = `Lorem ipsum dolor sit amet, consectetur adipiscing [...] Vivamus vitae nulla posuere, pellentesque quam posuere` var pattern = regexp.MustCompile("auctor") func BenchmarkSubstring(b *testing.B) { for i := 0; i < bN; i++ { strings.Contains(haystack, "auctor") } } func BenchmarkRegex(b *testing.B) { for i := 0; i < bN; i++ { pattern.MatchString(haystack) } }
そして、何が変わったのか見てみましょう:
$ go test -bench=. testing: warning: no tests to run BenchmarkSubstring-8 10000000 170 ns/op BenchmarkRegex-8 5000000 297 ns/op PASS ok github.com/mkevac/perftest01 3.685s
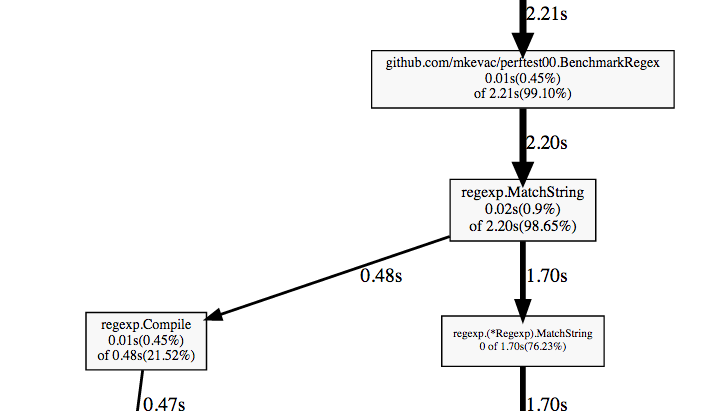
ご覧のとおり、正規表現を使用したバリアントは桁違いに高速化され、単純な部分文字列検索を使用してバリアントに近づきました。
しかし、コールグラフはどのように変化しましたか? 「ずっと簡単」になったのは、 現在、コンパイルは一度だけ行われます。 さらに、コンパイル呼び出しはグラフにまったくヒットしませんでした。 プロファイリングはサンプリングです。
素晴らしい。 CPU CPU Go Profilerを実行するために他にどのようなメソッドがあるのか見てみましょう。
プロファイラーを起動する方法
すでに確認した1つの方法は、 go testコマンドの-cpuprofileオプションです。
関数pprof.StartCPUProfile()およびpprof.StopCPUProfile()を使用して、プロファイラーを手動で開始することもできます。 Dave Cheney( https://github.com/pkg/profile )のこれらの関数に対して非常に便利なラッパーを使用する方が少し簡単です。これにより、ファイルが作成され、書き込みなどが行われます。
もう1つの優れた方法は、 net / http / pprofパッケージを使用することです。 インポートすると、URL / debug / pprofの HTTPハンドラーが自動的に追加され、同じgoツールpprofを使用して実行中のプログラムをリモートでプロファイルできます。 それがどのように見えるか見てみましょう。
簡単な例を書いてみましょう。
package main import ( "net/http" _ "net/http/pprof" ) func cpuhogger() { var acc uint64 for { acc += 1 if acc&1 == 0 { acc <<= 1 } } } func main() { go http.ListenAndServe("0.0.0.0:8080", nil) cpuhogger() }
ご覧のとおり、 net / http / pprofパッケージをインポートし、 http.ListenAndServe()コマンドでHTTPサーバーを起動しました。 これは、プログラムの実行中にプロファイラーを使用するのに十分です。
プログラムを実行してプロファイラーを使用してみましょう。
$ go tool pprof http://localhost:8080/debug/pprof/profile?seconds=5
ご覧のとおり、pprofユーティリティに、プロファイラーが「リッスン」するハンドラーへのパスを渡すだけです。 さらに、プロファイラの動作時間(デフォルトでは30秒)を転送できます。
webコマンドは正常に動作し、topコマンドは正常に動作しますが、listとdisasmは、プログラムのソースに関する情報がないと言います。
(pprof) web (pprof) top 4.99s of 4.99s total ( 100%) flat flat% sum% cum cum% 4.99s 100% 100% 4.99s 100% main.cpuhogger 0 0% 100% 4.99s 100% runtime.goexit 0 0% 100% 4.99s 100% runtime.main (pprof) list cpuhogger Total: 4.99s No source information for main.cpuhogger
ソースに関する情報を取得するには、pprofを少し異なる方法で実行する必要があります。 彼にバイナリへのパスを渡す必要があります。
$ go tool pprof pproftest http://localhost:8080/debug/pprof/profile?seconds=5
これで、listとdisasmの両方を使用して、現実が期待と一致するようにできます。
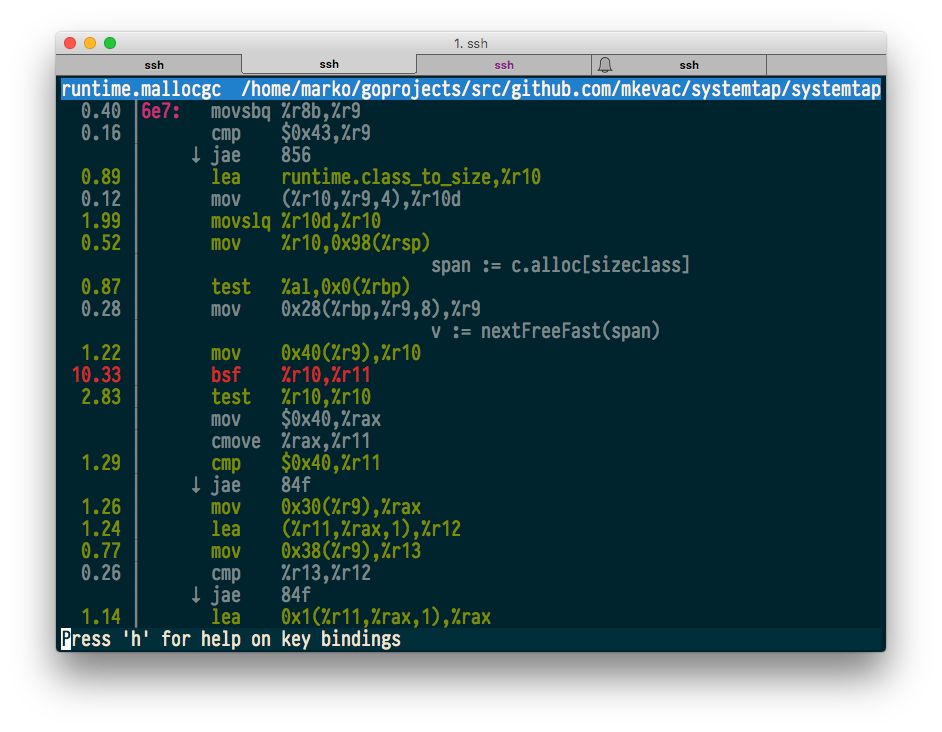
(pprof) list cpuhogger Total: 4.97s ROUTINE ======================== main.cpuhogger in /home/marko/goprojects/src/github.com/mkevac/pproftest/main.go 4.97s 4.97s (flat, cum) 100% of Total . . 6:) . . 7: . . 8:func cpuhogger() { . . 9: var acc uint64 . . 10: for { 2.29s 2.29s 11: acc += 1 1.14s 1.14s 12: if acc&1 == 0 { 1.54s 1.54s 13: acc <<= 1 . . 14: } . . 15: } . . 16:} . . 17: . . 18:func main() { (pprof) disasm cpuhogger Total: 4.97s ROUTINE ======================== main.cpuhogger 4.97s 4.97s (flat, cum) 100% of Total . . 401000: XORL AX, AX 1.75s 1.75s 401002: INCQ AX 1.14s 1.14s 401005: TESTQ $0x1, AX . . 40100b: JNE 0x401002 1.54s 1.54s 40100d: SHLQ $0x1, AX 540ms 540ms 401010: JMP 0x401002 . . 401012: INT $0x3
もっと楽しみましょう。 自分でURLを返すものを収縮させます:
$ curl http://localhost:8080/debug/pprof/profile?seconds=5 -o /tmp/cpu.log
go tool test -cpuprofileまたはStartCPUProfile()を使用すると、/ tmp / cpu.log内で同じバイナリデータが返されることが わかります。 このバイナリファイルに文字列コマンドを「設定」し、関数名やいわゆる文字が内部にないことを理解します。
$ strings /tmp/cpu.log | grep cpuhogger
では、最初の場合、バイナリなしでpprofを起動したとき、関数名はどこで取得されましたか? net / http / pprofをインポートすると、別のURL / debug / pprof / symbolが追加され 、関数のアドレスに名前が返されます。 このURLを照会することにより、pprofコマンドは関数名を取得します。
ただし、このURLは関数のソースコードを返さず、逆アセンブルもしません。 分解するには、バイナリが必要です。ソースコードには、ディスク上のバイナリとソースコードの両方が必要です。
注意:送信されたバイナリとソースコードは実行中のものでなければなりません。 そうしないと、期待するデータがまったく得られない可能性があり、存在しない問題を探します。
pprofはどのように機能しますか?
好奇心から、pprofがどのように機能し、使用するアプローチにどのような欠点があるかを正確に見てみましょう。
多くのプログラムの動作を同時に保証するために、最新のデスクトップおよびサーバーオペレーティングシステムは、いわゆるプリエンプティブマルチタスクを実装しています。 プログラムには、特定の期間と、それが機能する特定のプロセッサが割り当てられます。 この時間が経過すると、OSはプログラムの代わりになり、作業の準備ができていれば、代わりに別のプログラムを起動します。
しかし、割り込み機能はどのくらい正確に実装されていますか? 結局のところ、OSはほぼ同じプログラムです。 問題は、OSが特定の周波数の信号をアイロンに送信するように要求し、この信号にプロセッサを割り当てることです。 シグナルが到着すると、プロセッサは現在実行中のすべてを停止し、指定されたハンドラーを開始します。 このハンドラでは、OSが現在のプロセスを横取りしたり、別のプロセスに置き換えたりする場合があります。
Goプロファイラーも同じように機能します。 Goランタイムは、特定の頻度でシグナル(man setitimer)を送信するようOSに要求し、このシグナルにハンドラーを割り当てます。 ハンドラーは、すべてのゴルーチン(英語のゴルーチン )のスタックトレース、いくつかの追加情報を取得し、それをバッファーに書き込んで終了します。
以前のバージョンのOS Xの問題が関連しているのは、特定のスレッドにシグナルを配信するプロセスのバグです。
このアプローチの欠点は何ですか?
- 各シグナルはコンテキストの変化です。 物事は私たちの時代には非常に高価です。 したがって、現在、1秒あたり500を超える信号を受信するのは現実的です。 Goのデフォルト値は1秒あたり100です。 時にはこれで十分ではありません。
- たとえば、 -buildmode = c-archiveまたは-buildmode = c-sharedを使用するカスタムビルドの場合、プロファイラーはデフォルトでは機能しません。 これは、OSが送信するSIGPROFシグナルがGoによって制御されていないメインプログラムストリームに到達するという事実によるものです。
- Goプログラムであるユーザー空間プロセスは、核スタックトレースを受信できません。 非最適性と問題がコアにある場合があります。
もちろん、主な利点は、Goランタイムがその内部構造に関する完全な情報を持っていることです。 たとえば、外部ツールは、デフォルトではゴルーチンについて何も知りません。 彼らにとっては、プロセスとスレッドのみです。
システムプロファイラー
組み込みのGoプロファイラがどのように機能するかを調べました。 標準のperfおよびSystemTap Linuxプロファイラーがどのように適用できるかを見てみましょう。
この記事の最初のプログラムを取り上げます。ベンチマークから、無限に機能する通常のプログラムに変えます。
package main import ( "regexp" "strings" ) var haystack = `Lorem ipsum dolor sit amet, consectetur adipiscing [...] Vivamus vitae nulla posuere, pellentesque quam posuere` func UsingSubstring() bool { found := strings.Contains(haystack, "auctor") return found } func UsingRegex() bool { found, _ := regexp.MatchString("auctor", haystack) return found } func main() { go func() { for { UsingSubstring() } }() for { UsingRegex() } }
システムタップ
SystemTapは非常に強力なプロファイラーで、小さな言語のプログラムを擬似言語で作成できます。 その後、このプログラムは自動的にCに変換され、Linuxカーネルモジュールとしてアセンブルされ、ロード、実行、アンロードされます。
SystemTapが関数を認識しているかどうかを見てみましょう。
$ stap -l 'process("systemtap").function("main.*")' process("systemtap").function("main.UsingRegex@main.go:16") process("systemtap").function("main.UsingSubstring@main.go:11") process("systemtap").function("main.init@main.go:32") process("systemtap").function("main.main.func1@main.go:22") process("systemtap").function("main.main@main.go:21")
彼は見ます。 予想どおり、すべての関数にはmainというプレフィックスが付いています。
2つの関数の動作時間を測定し、結果をヒストグラムで表示してみましょう。
SystemTap言語で次の簡単なスクリプトを作成します。 関数の入り口の時間を記憶し、出口の時間を測定し、差を計算して保存します。 ジョブの完了後、彼はこの情報を印刷します。
global etime global intervals probe $1.call { etime = gettimeofday_ns() } probe $1.return { intervals <<< (gettimeofday_ns() - etime)/1000 } probe end { printf("Duration min:%dus avg:%dus max:%dus count:%d\n", @min(intervals), @avg(intervals), @max(intervals), @count(intervals)) printf("Duration (us):\n") print(@hist_log(intervals)); printf("\n") }
あるターミナルでプログラムを実行し、別のターミナルでホチキスで留めます。
$ sudo stap main.stap 'process("systemtap").function("main.UsingSubstring")' ^CDuration min:0us avg:1us max:586us count:1628362 Duration (us): value |-------------------------------------------------- count 0 | 10 1 |@@@@@@@@@@@@@@@@@@@@@@@@@@@@@@@@@@@@@@@@@@@@@@@@@ 1443040 2 |@@@@@ 173089 4 | 6982 8 | 4321 16 | 631 32 | 197 64 | 74 128 | 13 256 | 4 512 | 1 1024 | 0 2048 | 0
結果は得られましたが、プログラムは非常にうまく機能したため、エラーが発生しました。
$ ./systemtap runtime: unexpected return pc for main.UsingSubstring called from 0x7fffffffe000 fatal error: unknown caller pc runtime stack: runtime.throw(0x494e40, 0x11) /home/marko/go/src/runtime/panic.go:566 +0x8b runtime.gentraceback(0xffffffffffffffff, 0xc8200337a8, 0x0, 0xc820001d40, 0x0, 0x0, 0x7fffffff, 0x7fff2fa88030, 0x0, 0x0, ...) /home/marko/go/src/runtime/traceback.go:311 +0x138c runtime.scanstack(0xc820001d40) /home/marko/go/src/runtime/mgcmark.go:755 +0x249 runtime.scang(0xc820001d40) /home/marko/go/src/runtime/proc.go:836 +0x132 runtime.markroot.func1() /home/marko/go/src/runtime/mgcmark.go:234 +0x55 runtime.systemstack(0x4e4f00) /home/marko/go/src/runtime/asm_amd64.s:298 +0x79 runtime.mstart() /home/marko/go/src/runtime/proc.go:1087
go-nutsでそれに関するスレッドを見つけましたが、まだ解決策はありません。 どうやら、SystemTapがプログラムコードを変更して関数をインターセプトする方法は、GCでスタックトレースを受信するときのGoランタイムを好まないようです。
例外を処理するときに、C ++でも同じ問題が発生します。 Uretprobesは完璧ではありません。
さて、しかし、.returnサンプルを使用しない場合、大丈夫ですか? やってみましょう。
乱数を取得して文字列に変換し、バッファに格納するプログラムを次に示します。
package main import ( "bytes" "fmt" "math/rand" "time" ) func ToString(number int) string { return fmt.Sprintf("%d", number) } func main() { r := rand.New(rand.NewSource(time.Now().UnixNano())) var buf bytes.Buffer for i := 0; i < 1000; i++ { value := r.Int() % 1000 value = value - 500 buf.WriteString(ToString(value)) } }
文字列に変換する数値の分布を作成するスクリプトを作成しましょう。
global intervals probe process("systemtap02").function("main.ToString").call { intervals <<< $number } probe end { printf("Variables min:%dus avg:%dus max:%dus count:%d\n", @min(intervals), @avg(intervals), @max(intervals), @count(intervals)) printf("Variables:\n") print(@hist_log(intervals)); printf("\n") }
前のプログラムとは異なり、プログラムは.returnプローブを使用しませんが、引数番号を取り、使用します。
実行して何が起こったのかを見てください:
$ sudo stap main.stap -c ./systemtap02 Variables min:-499us avg:8us max:497us count:1000 Variables: value |-------------------------------------------------- count -1024 | 0 -512 | 0 -256 |@@@@@@@@@@@@@@@@@@@@@@@@@@@@@@@@@@@@@@@@@ 249 -128 |@@@@@@@@@@@@@@@@@@@@ 121 -64 |@@@@@@@@@@ 60 -32 |@@@@@@ 36 -16 |@@ 12 -8 |@ 8 -4 | 5 -2 | 3 -1 | 2 0 | 2 1 | 2 2 | 3 4 |@ 7 8 | 4 16 |@@@ 20 32 |@@@@@ 33 64 |@@@@@@@ 44 128 |@@@@@@@@@@@@@@@@@@ 110 256 |@@@@@@@@@@@@@@@@@@@@@@@@@@@@@@@@@@@@@@@@@@@@@@ 279 512 | 0 1024 | 0
配布のスケジュールがきれいになりました。
性能
perfユーティリティとperf_eventsサブシステムは現在、Linuxのデフォルトのプロファイラーです。 ソースと開発は主にカーネルリポジトリに行き、カーネルと同等になります。
perf topは、topと同様に、最もホットなコードをリアルタイムで表示するコマンドです。 テストプログラムを実行し、perf topが表示するものを確認します。
$ sudo perf top -p $(pidof systemtap)
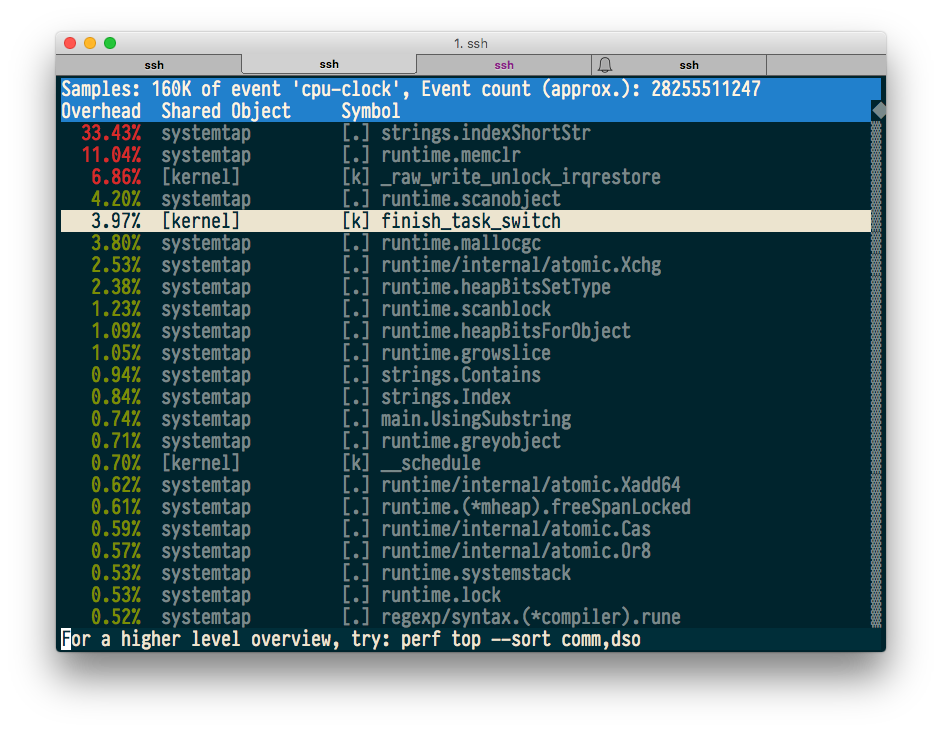
すべてがうまくいくようで、ソースおよびマシンコードを使用した注釈も機能します。
それでは、Brendan Greggによって普及した、いわゆるFlameGraphを構築してみましょう。 Brendanは現在Netflixで働いており、Linuxの革新的なプロファイリングの主要なプロモーターおよび「エンジン」の1つです。
再度、プログラムを実行し、10秒以内にスタックトレースをファイルに収集します。
$ sudo perf record -F 99 -g -p $(pidof systemtap) -- sleep 10 [ perf record: Woken up 1 times to write data ] [ perf record: Captured and wrote 0.149 MB perf.data (1719 samples) ]
Brendanのユーティリティを使用して、パフォーマンスデータをFlameGraphに変換します。
$ sudo perf script | ~/tmp/FlameGraph/stackcollapse-perf.pl > out.perf-folded $ ~/tmp/FlameGraph/flamegraph.pl out.perf-folded > perf-kernel.svg
そして、ここに私たちが得たものがあります:
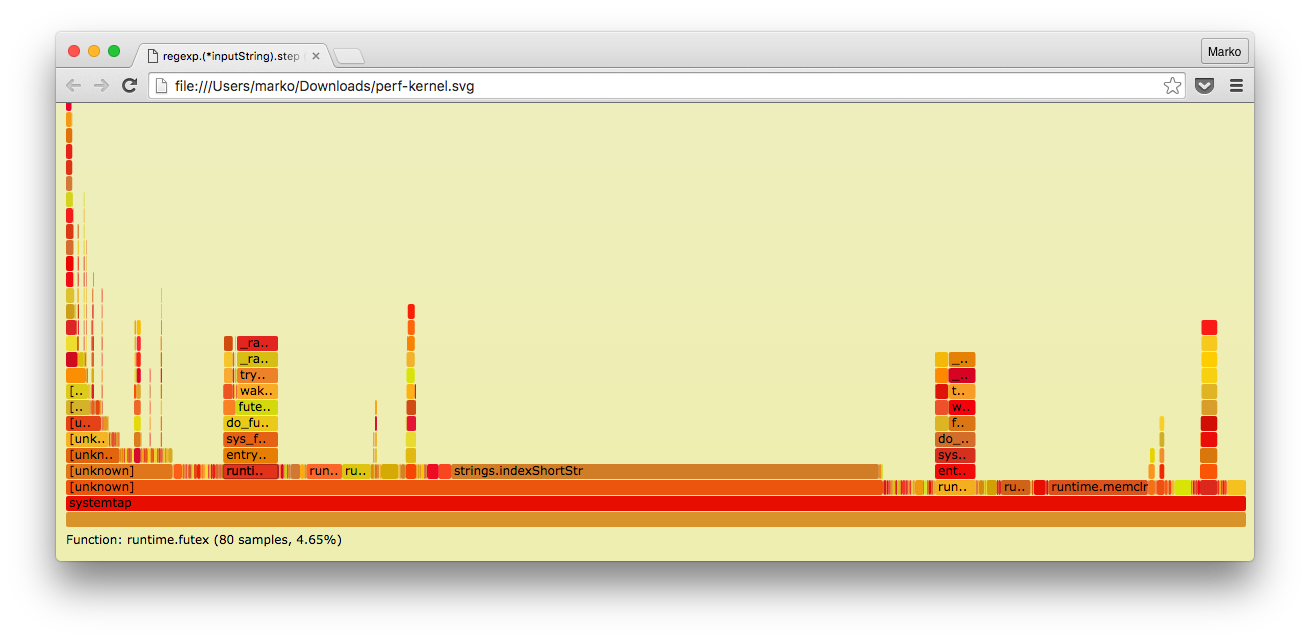
ご覧のとおり、Goの組み込みプロファイラーとは異なり、ここにはカーネルスタックトレースもあります。
記憶
CまたはC ++でプログラミングした場合、メモリ使用量をどのようにプロファイルしますか?
C / C ++の世界には、メモリを使用するときにエラーを検索するように設計されたユーティリティであるValgrindがあります:リーク、配列の境界外への移動、すでに解放されたメモリの使用など。 これはすべて必要ありません。なぜなら Goでは、このような問題がないことが保証されています(もちろんcgoを使用する場合を除く)。
しかし、Valgrindは、組み込みのMassifサブシステムを使用して、メモリ消費を便利なタイムスケジュールの形式で表示する方法も知っています。
単純に割り当ててから20 MiBのメモリを解放する単純なCプログラムを使用する場合
#include <stdlib.h> #include <unistd.h> #include <string.h> int main() { const size_t MB = 1024*1024; const unsigned count = 20; char **buf = calloc(count, sizeof(*buf)); for (unsigned i = 0; i < count; i++) { buf[i] = calloc(1, MB); memset(buf[i], 0xFF, MB); sleep(1); } for (unsigned i = 0; i < count; i++) { free(buf[i]); sleep(1); } free(buf); }
Massifの下で実行すると、メモリの割り当てが開始された場所のスタックトレースでこのグラフのようなものが得られます。
-------------------------------------------------------------------------------- Command: ./main Massif arguments: --pages-as-heap=yes --time-unit=ms ms_print arguments: massif.out.15091 -------------------------------------------------------------------------------- MB 26.20^ :: | ::: # | @@: : #:: | ::@ : : #: :: | ::::: @ : : #: : :::: | :: : : @ : : #: : : : :: | :::: : : @ : : #: : : : : : | ::::: :: : : @ : : #: : : : : ::::: | ::: : : :: : : @ : : #: : : : : :: : @@ | ::: : : : :: : : @ : : #: : : : : :: : @ :: | ::@: : : : : :: : : @ : : #: : : : : :: : @ : ::: | ::: @: : : : : :: : : @ : : #: : : : : :: : @ : : ::: | ::: : @: : : : : :: : : @ : : #: : : : : :: : @ : : :: :: | ::: : : @: : : : : :: : : @ : : #: : : : : :: : @ : : :: : :: | ::::: : : : @: : : : : :: : : @ : : #: : : : : :: : @ : : :: : : :::: |:: : : : : : @: : : : : :: : : @ : : #: : : : : :: : @ : : :: : : : : : |@: : : : : : @: : : : : :: : : @ : : #: : : : : :: : @ : : :: : : : : :@ |@: : : : : : @: : : : : :: : : @ : : #: : : : : :: : @ : : :: : : : : :@ |@: : : : : : @: : : : : :: : : @ : : #: : : : : :: : @ : : :: : : : : :@ |@: : : : : : @: : : : : :: : : @ : : #: : : : : :: : @ : : :: : : : : :@ 0 +----------------------------------------------------------------------->s 0 39.13 Number of snapshots: 66 Detailed snapshots: [9, 10, 20, 22, 32, 42, 45 (peak), 55, 65]
Massifは、メモリを操作するための主要な関数(malloc、calloc、realloc、memalign、new、new [])を独自に再定義するように機能します。
Goはこれらの機能を使用しません。 Goソースには独自のアロケーターがあり、これはmmapまたはsbrkシステムコールを使用してOSからメモリを直接要求し、すでにそれを小さな断片に分割しています。
Valgrindは特別なコマンドラインパラメーターで要求するとmmap / sbrkをキャッチできますが、それでも役に立たないのは、第1に、これらの最高の割り当てとリリースが表示されず、第2に、理解できないためです。参照されなくなったメモリと、まだ「ライブ」であるメモリ。
C / C ++の世界の他の一般的なユーティリティもほとんど役に立たない それらのほとんどは同様の方法で動作します。 メモリの割り当てと解放の機能を傍受することにより。
基本的に2つのオプションがあります。
- 理論的には、Goプログラムの外部(perfやSystemTapなど)でGoランタイムからメモリを割り当てたり解放したりする機能をインターセプトし、これらの呼び出しに基づいて何かを理解しようとします。
- 組み込みのGoランタイムメモリ使用量アカウンティングを使用します。
Goは、定期的にメモリ割り当てに関する情報を収集できます。 この頻度は手動で設定できますが、デフォルトでは、割り当てられたメモリ512キロバイトにつき1回です。
いつものように、例を見てみましょう。
例
プロセッサのプロファイリングと同様に、メモリのプロファイリングは、 go test 、 runtime.MemProfile()への直接呼び出し、またはnet / http / pprofパッケージを使用して開始できます 。 今回は、最後のオプションを使用しましょう。
そのため、ここでは、ゴルーチンの1つで絶えず配列を割り当てて別の配列に格納するプログラムを示します。他のゴルーチンでは同じことを行いますが、配列の配列を定期的に「忘れ」ます。
package main import ( "net/http" _ "net/http/pprof" "time" ) func allocAndKeep() { var b [][]byte for { b = append(b, make([]byte, 1024)) time.Sleep(time.Millisecond) } } func allocAndLeave() { var b [][]byte for { b = append(b, make([]byte, 1024)) if len(b) == 20 { b = nil } time.Sleep(time.Millisecond) } } func main() { go allocAndKeep() go allocAndLeave() http.ListenAndServe("0.0.0.0:8080", nil) }
つまり , , , .
, .
go tool pprof , :
- alloc_space — ;
- alloc_objects — ;
- inuse_space — ;
- inuse_objects — .
, — .
, inuse allocAndKeep(), alloc :
$ go tool pprof -inuse_space memtest http://localhost:8080/debug/pprof/heap Fetching profile from http://localhost:8080/debug/pprof/heap Saved profile in /home/marko/pprof/pprof.memtest.localhost:8080.inuse_objects.inuse_space.005.pb.gz Entering interactive mode (type "help" for commands) (pprof) top 15.36MB of 15.36MB total ( 100%) Dropped 2 nodes (cum <= 0.08MB) flat flat% sum% cum cum% 15.36MB 100% 100% 15.36MB 100% main.allocAndKeep 0 0% 100% 15.36MB 100% runtime.goexit $ go tool pprof -alloc_space memtest http://localhost:8080/debug/pprof/heap Fetching profile from http://localhost:8080/debug/pprof/heap Saved profile in /home/marko/pprof/pprof.memtest.localhost:8080.alloc_objects.alloc_space.008.pb.gz Entering interactive mode (type "help" for commands) (pprof) top 54.49MB of 54.49MB total ( 100%) Dropped 8 nodes (cum <= 0.27MB) flat flat% sum% cum cum% 27.97MB 51.33% 51.33% 29.47MB 54.08% main.allocAndKeep 23.52MB 43.17% 94.49% 25.02MB 45.92% main.allocAndLeave 3MB 5.51% 100% 3MB 5.51% time.Sleep 0 0% 100% 54.49MB 100% runtime.goexit
. , Sleep() - . .
(pprof) list time.Sleep Total: 54.49MB ROUTINE ======================== time.Sleep in /home/marko/go/src/runtime/time.go 3MB 3MB (flat, cum) 5.51% of Total . . 48:func timeSleep(ns int64) { . . 49: if ns <= 0 { . . 50: return . . 51: } . . 52: 3MB 3MB 53: t := new(timer) . . 54: t.when = nanotime() + ns . . 55: tf = goroutineReady . . 56: t.arg = getg() . . 57: lock(&timers.lock) . . 58: addtimerLocked(t)
, , time.Sleep() new().
(1)
, , — . , .
, .
package printtest import ( "bytes" "fmt" "testing" ) func BenchmarkPrint(b *testing.B) { var buf bytes.Buffer var s string = "test string" for i := 0; i < bN; i++ { buf.Reset() fmt.Fprintf(&buf, "string is: %s", s) } }
fmt.Fprintf() .
-benchmem test .
$ go test -bench=. -benchmem testing: warning: no tests to run BenchmarkPrint-8 10000000 128 ns/op 16 B/op 1 allocs/op PASS ok github.com/mkevac/converttest 1.420s
, 1 16 . ?
:
$ go test -bench=. -memprofile=mem.out -memprofilerate=1
memprofilerate , . , . , . .
:
$ go tool pprof -alloc_space converttest.test mem.out (pprof) top 15.41MB of 15.48MB total (99.59%) Dropped 73 nodes (cum <= 0.08MB) flat flat% sum% cum cum% 15.41MB 99.59% 99.59% 15.43MB 99.67% github.com/mkevac/converttest.BenchmarkPrint 0 0% 99.59% 15.47MB 99.93% runtime.goexit 0 0% 99.59% 15.42MB 99.66% testing.(*B).launch 0 0% 99.59% 15.43MB 99.67% testing.(*B).runN
, 15 MiB . どこ?
(pprof) list BenchmarkPrint Total: 15.48MB ROUTINE ======================== github.com/mkevac/converttest.BenchmarkPrint in /home/marko/goprojects/src/github.com/mkevac/converttest/convert_test.go 15.41MB 15.43MB (flat, cum) 99.67% of Total . . 9:func BenchmarkPrint(b *testing.B) { . . 10: var buf bytes.Buffer . . 11: var s string = "test string" . . 12: for i := 0; i < bN; i++ { . . 13: buf.Reset() 15.41MB 15.43MB 14: fmt.Fprintf(&buf, "string is: %s", s) . . 15: } . . 16:}
fmt.Fprintf(). いいね そしてどこ?
(pprof) list fmt.Fprintf Total: 15.48MB ROUTINE ======================== fmt.Fprintf in /home/marko/go/src/fmt/print.go 0 12.02kB (flat, cum) 0.076% of Total . . 175:// These routines end in 'f' and take a format string. . . 176: . . 177:// Fprintf formats according to a format specifier and writes to w. . . 178:// It returns the number of bytes written and any write error encountered. . . 179:func Fprintf(w io.Writer, format string, a ...interface{}) (n int, err error) { . 11.55kB 180: p := newPrinter() . 480B 181: p.doPrintf(format, a) . . 182: n, err = w.Write(p.buf) . . 183: p.free() . . 184: return . . 185:} . . 186:
. , , … - . 15 , 12 . - .
:
. . 466edb: CALL bytes.(*Buffer).Reset(SB) . . 466ee0: LEAQ 0x98b6b(IP), AX . . 466ee7: MOVQ AX, 0x70(SP) . . 466eec: MOVQ $0xb, 0x78(SP) . . 466ef5: MOVQ $0x0, 0x60(SP) . . 466efe: MOVQ $0x0, 0x68(SP) . . 466f07: LEAQ 0x70d92(IP), AX . . 466f0e: MOVQ AX, 0(SP) . . 466f12: LEAQ 0x70(SP), AX . . 466f17: MOVQ AX, 0x8(SP) . . 466f1c: MOVQ $0x0, 0x10(SP) 15.41MB 15.41MB 466f25: CALL runtime.convT2E(SB) . . 466f2a: MOVQ 0x18(SP), AX . . 466f2f: MOVQ 0x20(SP), CX . . 466f34: MOVQ AX, 0x60(SP) . . 466f39: MOVQ CX, 0x68(SP) . . 466f3e: LEAQ 0x10b35b(IP), AX . . 466f45: MOVQ AX, 0(SP) . . 466f49: MOVQ 0x58(SP), AX . . 466f4e: MOVQ AX, 0x8(SP) . . 466f53: LEAQ 0x99046(IP), CX . . 466f5a: MOVQ CX, 0x10(SP) . . 466f5f: MOVQ $0xd, 0x18(SP) . . 466f68: LEAQ 0x60(SP), CX . . 466f6d: MOVQ CX, 0x20(SP) . . 466f72: MOVQ $0x1, 0x28(SP) . . 466f7b: MOVQ $0x1, 0x30(SP) . 12.02kB 466f84: CALL fmt.Fprintf(SB)
- runtime.convT2E . これは何ですか
, fmt.Fprintf():
func Fprintf(w io.Writer, format string, a ...interface{}) (n int, err error)
, . , , void* .
«» , .. . , ? なんで? Go.
Go , string, chan, func, slice, interface .. .
, string, .. :
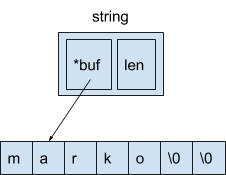
— 16 . 8 — , , , , 8 — .
interface. Interface 8- .
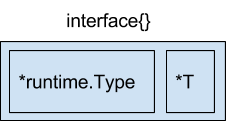
8 — , , 8 — .
var s string = "marko" var a interface{} = &s
, 8 .
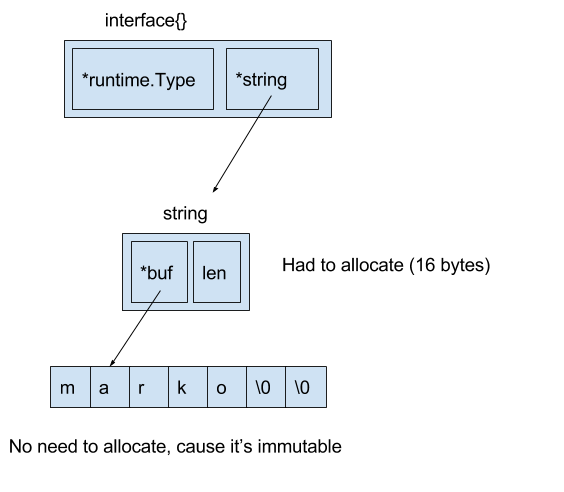
. , :
var s string = "marko" var a interface{} = s
Go runtime.convT2E.
:
16 go test.
«» .
fmt.Fprintf :
package main import ( "bytes" "testing" ) func BenchmarkPrint(b *testing.B) { var buf bytes.Buffer var s string = "test string" for i := 0; i < bN; i++ { buf.Reset() buf.WriteString("string is: ") buf.WriteString(s) } }
0 :
$ go test -bench=BenchmarkPrint -benchmem testing: warning: no tests to run BenchmarkPrint-8 50000000 27.5 ns/op 0 B/op 0 allocs/op PASS ok github.com/mkevac/converttest01 1.413s
4 .
(2)
«» , cgo. ( char * ) — , , . , .
Go, , . — , .
package main import ( "fmt" ) func main() { var array = []byte{'m', 'a', 'r', 'k', 'o'} if string(array) == "marko" { fmt.Println("equal") } }
, . . git-blame , . , , (do not escapes to heap), , .
. , , , , . runtime. , , , , 2010 , , .
.
- , Go- , escapes to heap.
:
package main import ( "bytes" "testing" "unsafe" ) var s string func BenchmarkConvert(b *testing.B) { var buf bytes.Buffer var array = []byte{'m', 'a', 'r', 'k', 'o', 0} for i := 0; i < bN; i++ { buf.Reset() s = string(array) buf.WriteString(s) } }
$ go test -bench=. -benchmem testing: warning: no tests to run BenchmarkConvert-8 30000000 42.1 ns/op 8 B/op 1 allocs/op
reflect unsafe.
func BytesToString(b []byte) string { bh := (*reflect.SliceHeader)(unsafe.Pointer(&b)) sh := reflect.StringHeader{bh.Data, bh.Len} return *(*string)(unsafe.Pointer(&sh)) } func BenchmarkNoConvert(b *testing.B) { var buf bytes.Buffer var array = []byte{'m', 'a', 'r', 'k', 'o', 0} for i := 0; i < bN; i++ { buf.Reset() s = BytesToString(array) buf.WriteString(s) } }
.
$ go test -bench=. -benchmem testing: warning: no tests to run BenchmarkConvert-8 30000000 44.5 ns/op 8 B/op 1 allocs/op BenchmarkNoConvert-8 100000000 19.2 ns/op 0 B/op 0 allocs/op PASS ok github.com/mkevac/bytetostring 3.332s
, Go — . , Go runtime , , , : , , , .. Go runtime/trace.go .
— . , Chrome -.
, , .
例
- GC- debugcharts.
runtime.ReadMemStats() , GC- .
, « », debugcharts.
package main import ( "net/http" _ "net/http/pprof" "time" _ "github.com/mkevac/debugcharts" ) func CPUHogger() { var acc uint64 t := time.Tick(2 * time.Second) for { select { case <-t: time.Sleep(50 * time.Millisecond) default: acc++ } } } func main() { go CPUHogger() go CPUHogger() http.ListenAndServe("0.0.0.0:8181", nil) }
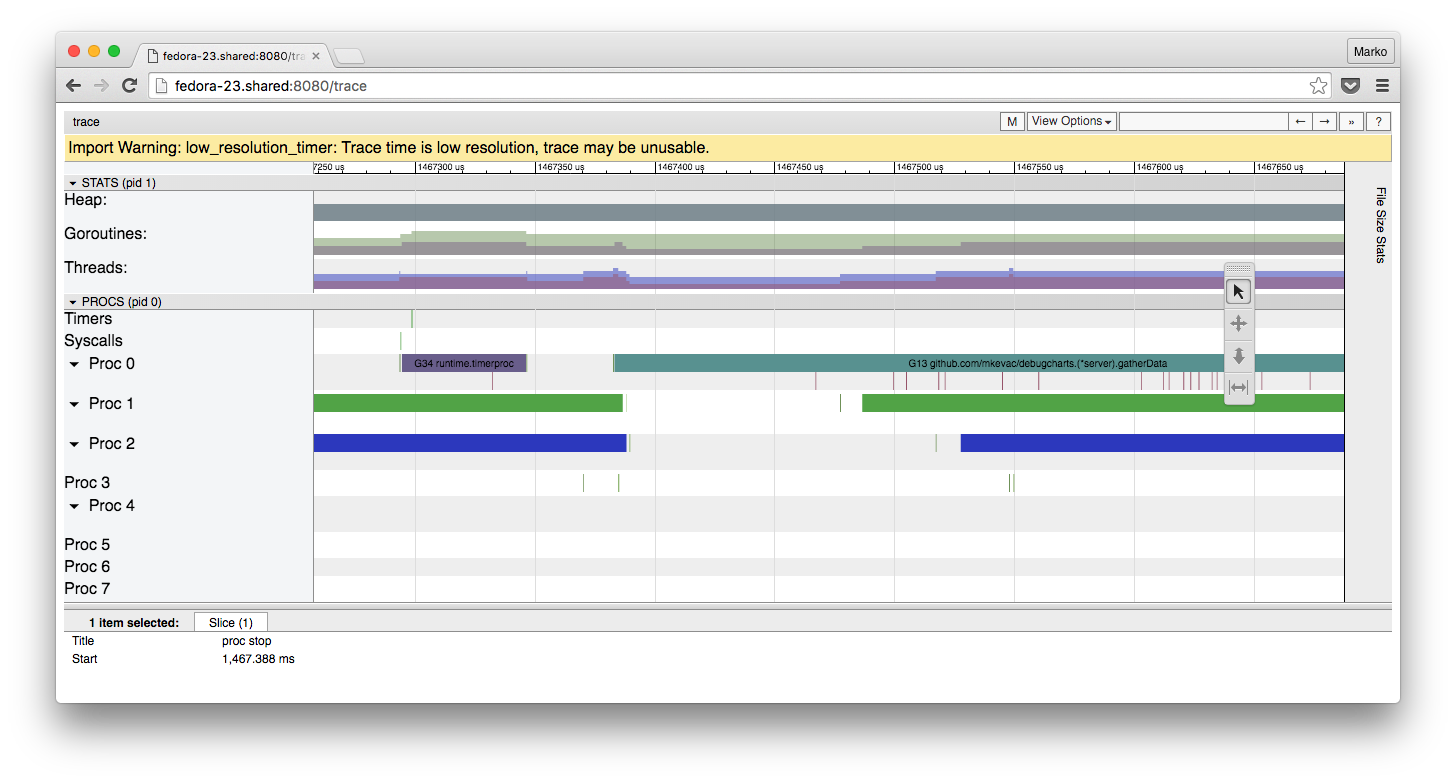
trace, , .
10 . : runtime - , 1-3 . , Chrome JavaScript .
curl http://localhost:8181/debug/pprof/trace?seconds=10 -o trace.out
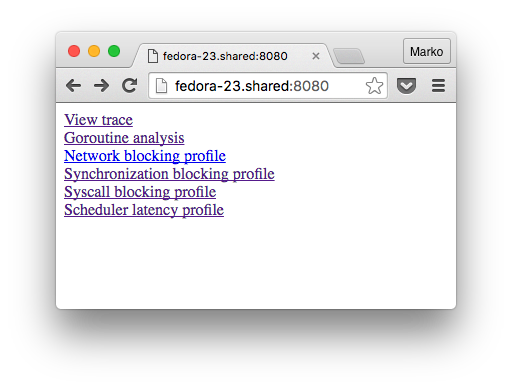
go tool trace , :
go tool trace -http "0.0.0.0:8080" ./tracetest trace.out
, :
:
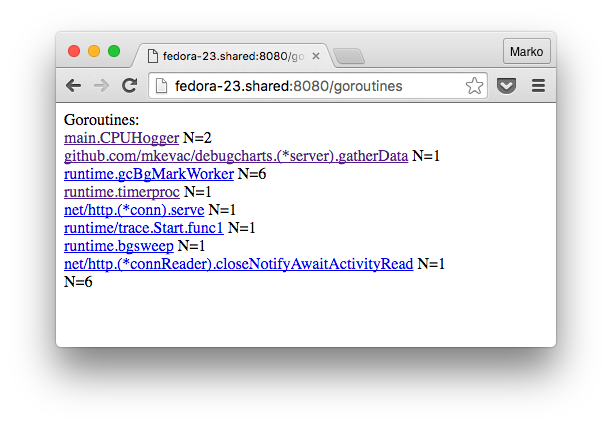
, , , . , , .
, , , , :

, 4 , , 2 50 , . , - , , , debugcharts. , .
, debugcharts:
- . Debugcharts , , , . .
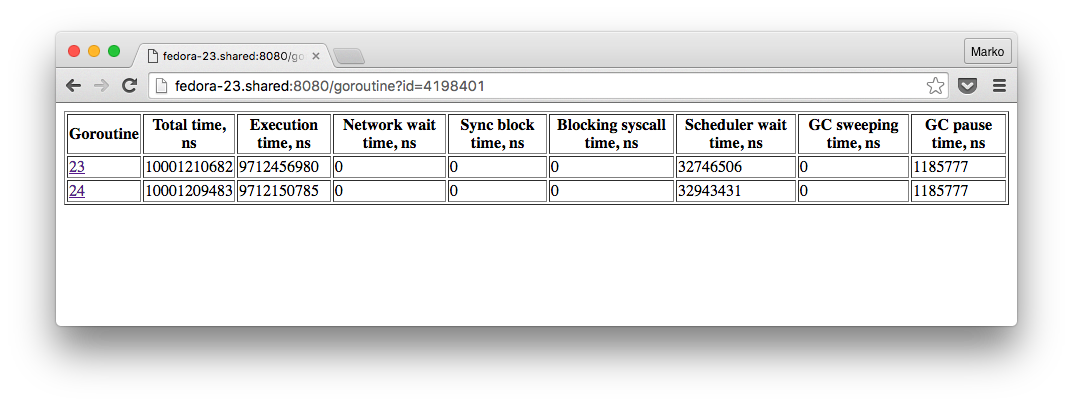
, , , proc stop proc start .
, , debugcharts . latency .
runtime.ReadMemStats() , .
180 // ReadMemStats populates m with memory allocator statistics. 181 func ReadMemStats(m *MemStats) { 182 stopTheWorld("read mem stats") 183 184 systemstack(func() { 185 readmemstats_m(m) 186 }) 187 188 startTheWorld() 189 }
. .
, debugcharts .
おわりに
, , .

, Go:
- CPU;
- ;
- ;
- escape-;
- ;
- ;
- ;
- ;
- , CPU GC .
, Go , , , .
Go, , . perf SystemTap. .
, — , , , — .
, . Stay curious!
, C/C++