On the Toaster, they often ask about how to make an interactive diagram of a house, a plan of its internal structure, the ability to select floors or apartments with information about them, display information about the details of a particular product when you mouse over them in a photograph, etc. This is not about a three-dimensional model, but about a picture with the ability to highlight certain details. All these tasks are similar and solved quite simply, but nonetheless questions continue to appear, so today we will look at how such things are done using SVG, a graphical editor and a pinch of javascript.
The choice of SVG is due to the fact that this is the simplest option for development and debugging. I met people who advised all this to be done on canvas, but there it is much more difficult to understand what is happening, and the coordinates of all the points on the curves need to be calculated in advance somehow, but here I opened the developer’s tools and immediately see the whole structure, all the objects, with which there is interaction, and everything else can be clicked with a mouse in a human-friendly interface. Performance between the usual 2d canvas and SVG will hardly differ. WebGL may give some bonus in this regard, but the development timeline will increase significantly, not to mention further support, which does not always fit into the budget. I would even say “never fits.”
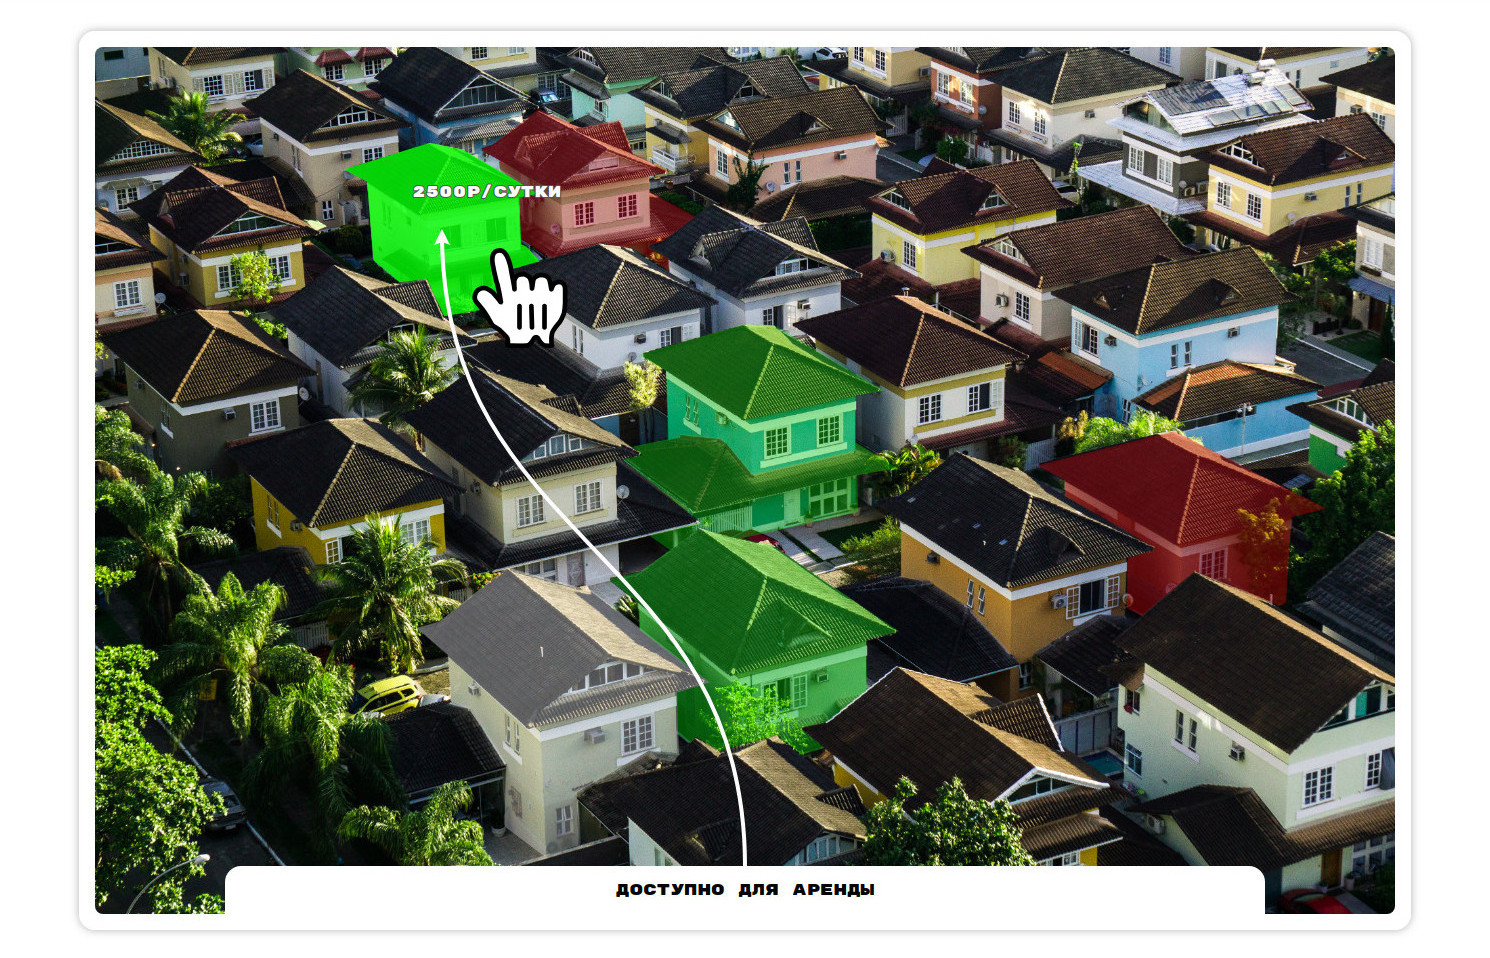
In this tutorial, we’ll do something like a widget for a fictitious site for renting private houses in a certain area, but it’s clear that the principles for creating such things in question apply to any subject.
Getting started
I will show everything with Inkscape as an example, but all the same actions can be performed in any other editor using similar functions.
To work, we need two main dialog boxes:
- XML Editor (Ctrl + Shift + X or an icon with angle brackets) - to view the structure of the document in the form of markup and edit individual elements.
- Fill and Stroke (Ctrl + Shift + F or the icon with a brush in the frame) - mainly for filling outlines.
Immediately launch them and proceed to the creation of the document.
If you accidentally dragged them into a separate window, you can click under the upper frame of this window (where there is nothing), and drag them back to the main one. This is not entirely intuitive, but rather convenient.
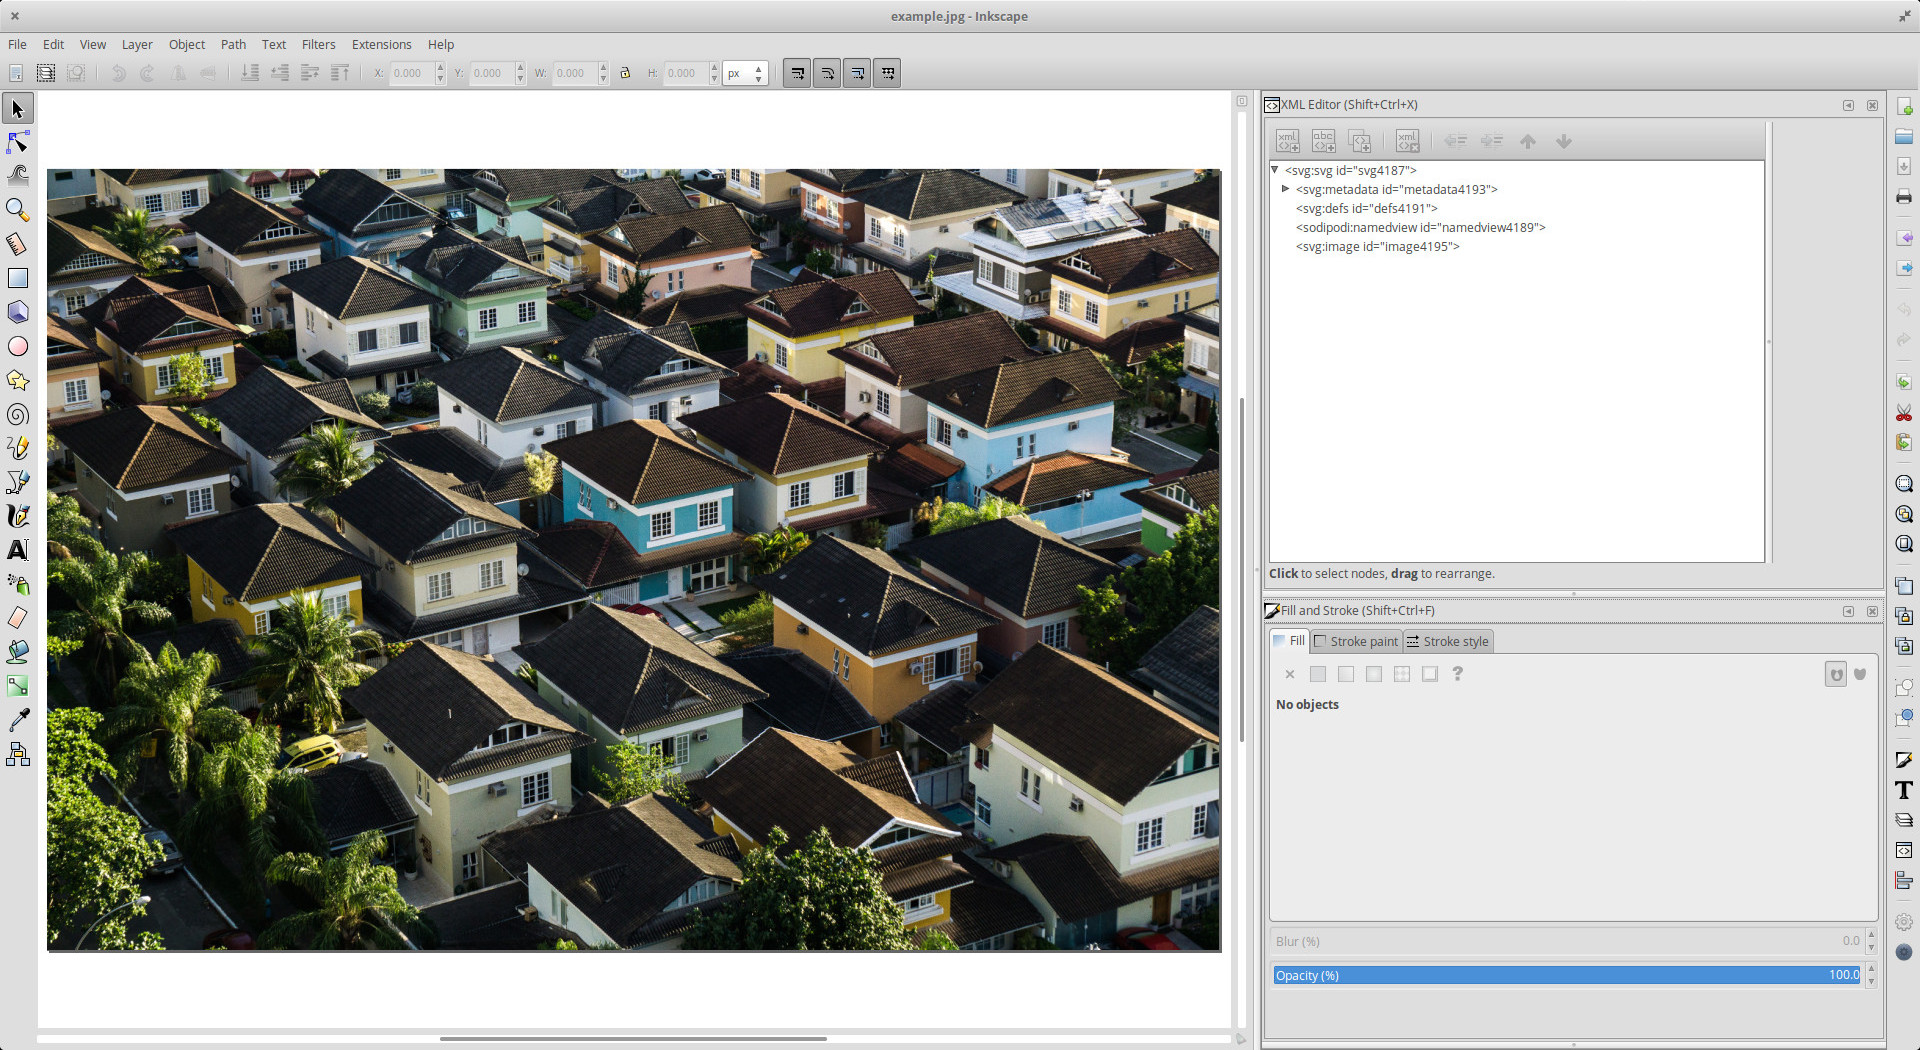
Open a photo with a view of the area. We can choose to insert the picture itself as a base64 string or an external link. Since it is large, select the link. Then we change the path to the picture with our hands when introducing everything into the pages of the site. An SVG document is created in which the photo will be embedded via the image tag.
For raster images embedded in SVG, embedded in HTML, you can use lazy loading, as well as for ordinary images on pages. In this example, we will not dwell on such optimizations, but do not forget about them in practical work.
At the current stage, we see in front of us something like this:
Now create a new layer (Ctrl + Shift + N or Menu> Layer> Add layer). In the XML editor, we see that the regular g element has appeared. While we haven’t gone far, we can give it a class, which we will use later in scripts.
Do not rely on id. The more complicated the interface, the easier it is to get them repeating and get strange bugs. And in our task, they still have no benefit. So classes or data attributes are our choice.
If you look closely at the structure of the document in the XML editor, you will notice that there is a lot of superfluous. Any more or less complex vector graphics editor will add something of its own to documents. To remove all this with your hands is a long and thankless task, the editor will constantly add something again. So cleaning SVG from garbage is done only at the end of the work. And preferably in an automated form, since there are ready-made options, the same svgo for example.
Find a tool called Draw Bezier curves and Straight Lines (Shift + F6). With it, we will draw closed contours around the objects. In our task, we need to outline all the buildings. For example, we restrict ourselves to six, but in real conditions it would be worthwhile to pre-allocate time in order to accurately outline all the necessary objects. Although it often happens that there are many similar entities, the same floors on a building can be absolutely identical. In such cases, you can speed up a little and copy-paste the curves.
After we circled the necessary buildings, we return to the XML editor, add classes or, most likely, it will be even more convenient, data attributes with indexes for them (it is possible with addresses, but since we have a fictitious area, there is only indexes), and move everything to the previously created layer so that everything is “laid out on shelves”. And the picture, by the way, will also be useful to move there, so that everything is in one place, but these are trifles.
Now, having chosen one path - a curve around the building, you can select them all with Ctrl + A or Menu> Edit> Select All and edit at the same time. You need to paint them all in the Fill and Stroke window, and at the same time remove the extra stroke there. Well, or add it if you need it for design reasons.
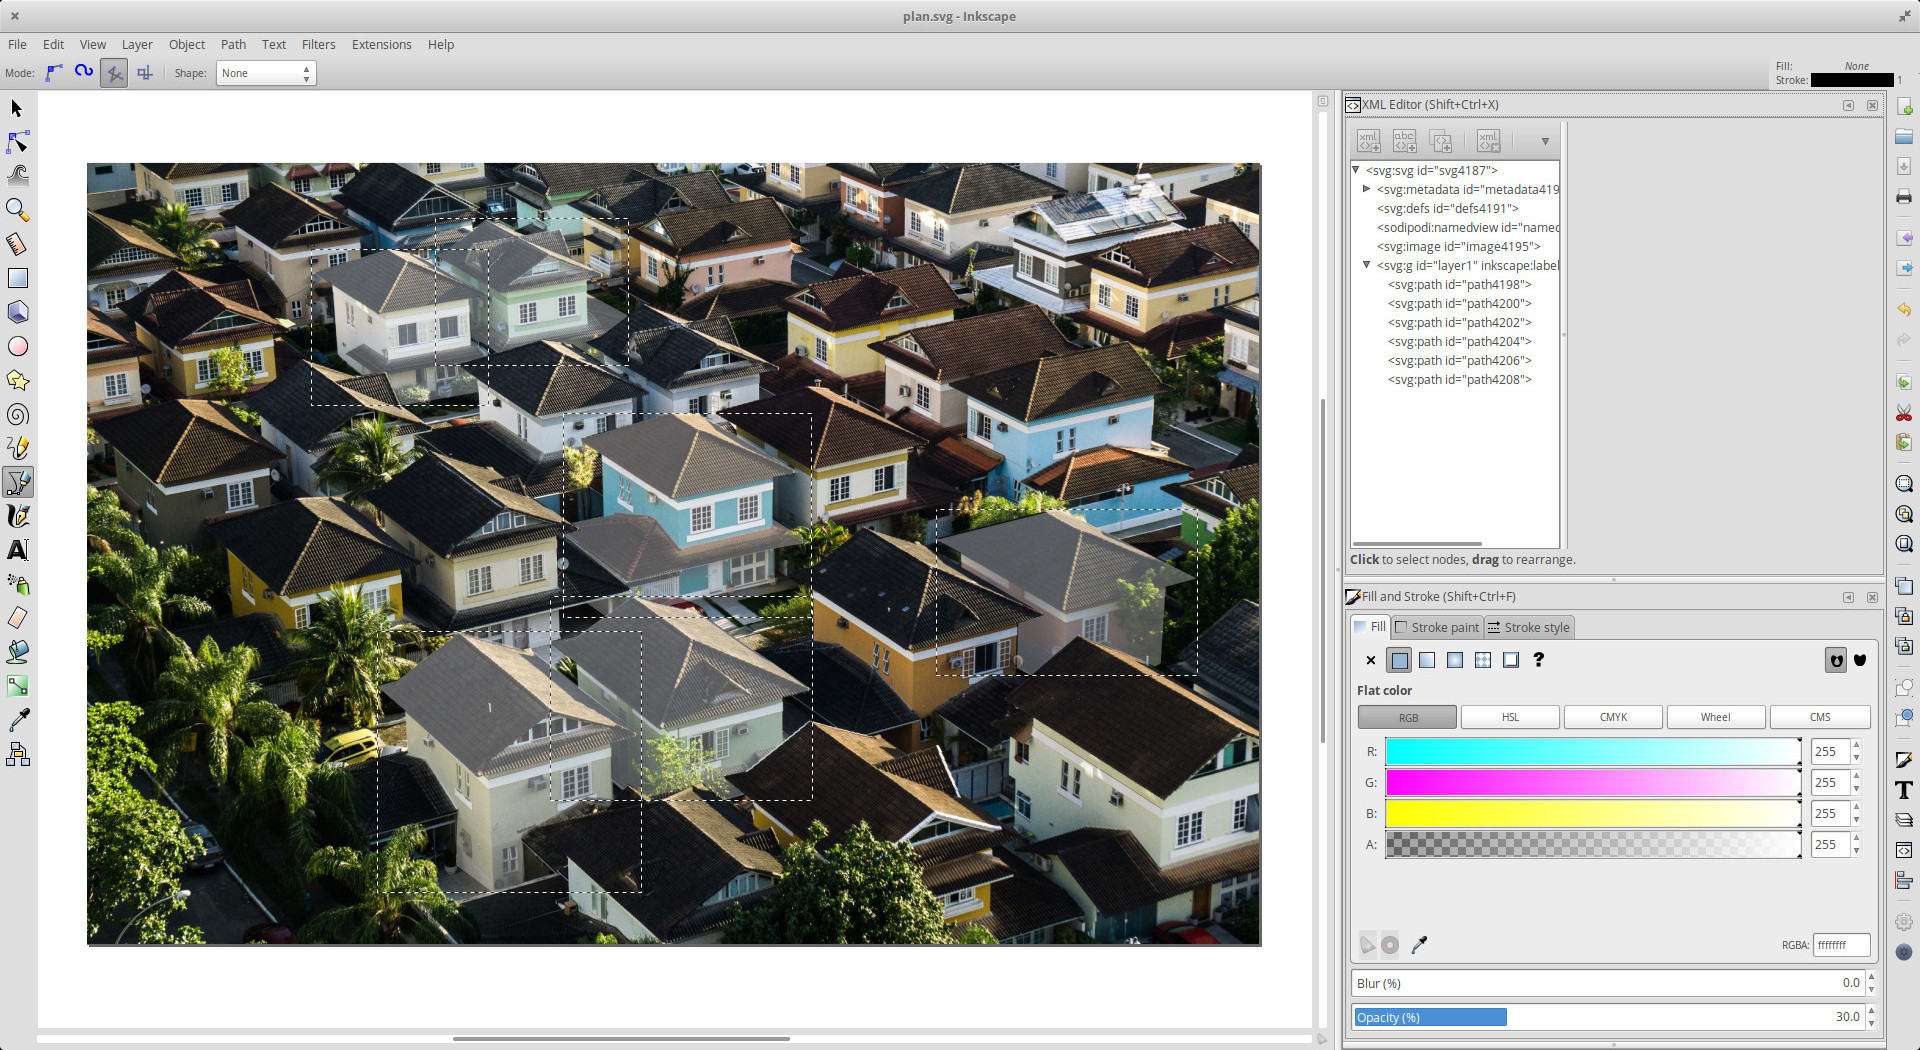
It makes sense to paint all the contours with some color with a minimum opacity value for them, even if this is not necessary in terms of design. The fact is that smart browsers believe that you can’t click on an empty path, but on a flooded path - you can, even if no one sees this fill.
In our example, we’ll leave a little highlight in white to better see which buildings we work with, save everything and smoothly move to the browser and the more familiar code editor.
Basic example
Let's create an empty html page, paste the resulting SVG directly into it and add some CSS so that nothing gets out of the screen. There’s nothing to comment on.
.map { width: 90%; max-width: 1300px; margin: 2rem auto; border: 1rem solid #fff; border-radius: 1rem; box-shadow: 0 0 .5rem rgba(0, 0, 0, .3); } .map > svg { width: 100%; height: auto; border-radius: .5rem; }
We recall that we added classes to buildings and use them so that CSS is more or less structured.
.building { transition: opacity .3s ease-in-out; } .building:hover { cursor: pointer; opacity: .8 !important; } .building.-available { fill: #0f0 !important; } .building.-reserved { fill: #f00 !important; } .building.-service { fill: #fff !important; }
Since we defined inline styles in Inkscape, we need to interrupt them in CSS. Would it be more convenient to do everything in CSS? Yes and no. Depends on the situation. Sometimes there is no choice. For example, if a designer drew a lot of everything colorful and wrap everything in CSS and inflate it to the impossibility of somehow not comme il faut. In this example, I use the “inconvenient” option to show that it is not particularly scary in the context of the problem being solved.

Suppose that we received fresh data on houses, and add different classes to them, depending on their current status:
const data = { id_0: { status: 'service' }, id_1: { status: 'available' }, id_2: { status: 'reserved' }, id_3: { status: 'available' }, id_4: { status: 'available' }, id_5: { status: 'reserved' }, messages: { 'available': ' ', 'reserved': '', 'service': ' 1-2 ' } }; const map = document.getElementById('my-map'); const buildings = map.querySelectorAll('.building'); for (building of buildings) { const id = building.getAttribute('data-building-id'); const status = data[`id_${id}`].status; building.classList.add(`-${status}`); }
We get something like this:

Something similar to what we need is already visible. At this stage, we have highlighted objects on the terrain that respond to mouse hover. And it’s easy to add for them a response to a mouse click through the standard addEventListener.
Leader line
Often there is the task of making lines that will connect the objects on the map and some elements on the page with additional information, as well as making minimal tooltips when hovering over these same objects. To solve these problems, the leader-line mini-library is very well suited, which creates vector arrows for every taste and color.
Let's add prices for tooltips to the data and draw these lines.
const data = { id_0: { price: '3000', status: 'service' }, id_1: { price: '3000', status: 'available' }, id_2: { price: '2000', status: 'reserved' }, id_3: { price: '5000', status: 'available' }, id_4: { price: '2500', status: 'available' }, id_5: { price: '2500', status: 'reserved' }, messages: { 'available': ' ', 'reserved': '', 'service': ' (1-2 )' } }; const map = document.getElementById('my-map'); const buildings = map.querySelectorAll('.building'); const info = map.querySelector('.info'); const lines = []; for (building of buildings) { const id = building.getAttribute('data-building-id'); const status = data[`id_${id}`].status; const price = data[`id_${id}`].price; building.classList.add(`-${status}`); const line = new LeaderLine( LeaderLine.pointAnchor(building, { x: '50%', y: '50%' }), LeaderLine.pointAnchor(info, { x: '50%', y: 0 }), { color: '#fff', startPlug: 'arrow1', endPlug: 'behind', endSocket: 'top' } ); lines.push(line); }
As you can see, nothing complicated happens. The line has “attachment points” to the elements. The coordinates of these points relative to the elements are usually convenient to determine in percent. In general, there are many different options, it does not make sense to list and remember, so I recommend just looking through the documentation. One of these options - startLabel - will be needed for us to create a small tooltip with a price.
const line = new LeaderLine( LeaderLine.pointAnchor(building, { x: '50%', y: '50%' }), LeaderLine.pointAnchor(info, { x: '50%', y: 0 }), { startLabel: LeaderLine.captionLabel(`${price}/`, { fontFamily: 'Rubik Mono One', fontWeight: 400, offset: [-30, -50], outlineColor: '#555' }), color: '#fff', startPlug: 'arrow1', endPlug: 'behind', endSocket: 'top', hide: true } );
No one bothers to draw all the tips in a graphical editor. If they are supposed to have consistent content, then it can even be convenient. Especially if there is a desire to ask them different positions for different objects.
We can also add the hide option so that all lines are not displayed as a broom. We will show them one at a time when you hover over the buildings to which they correspond:
building.addEventListener('mouseover', () => { line.show(); }); building.addEventListener('mouseout', () => { line.hide(); });
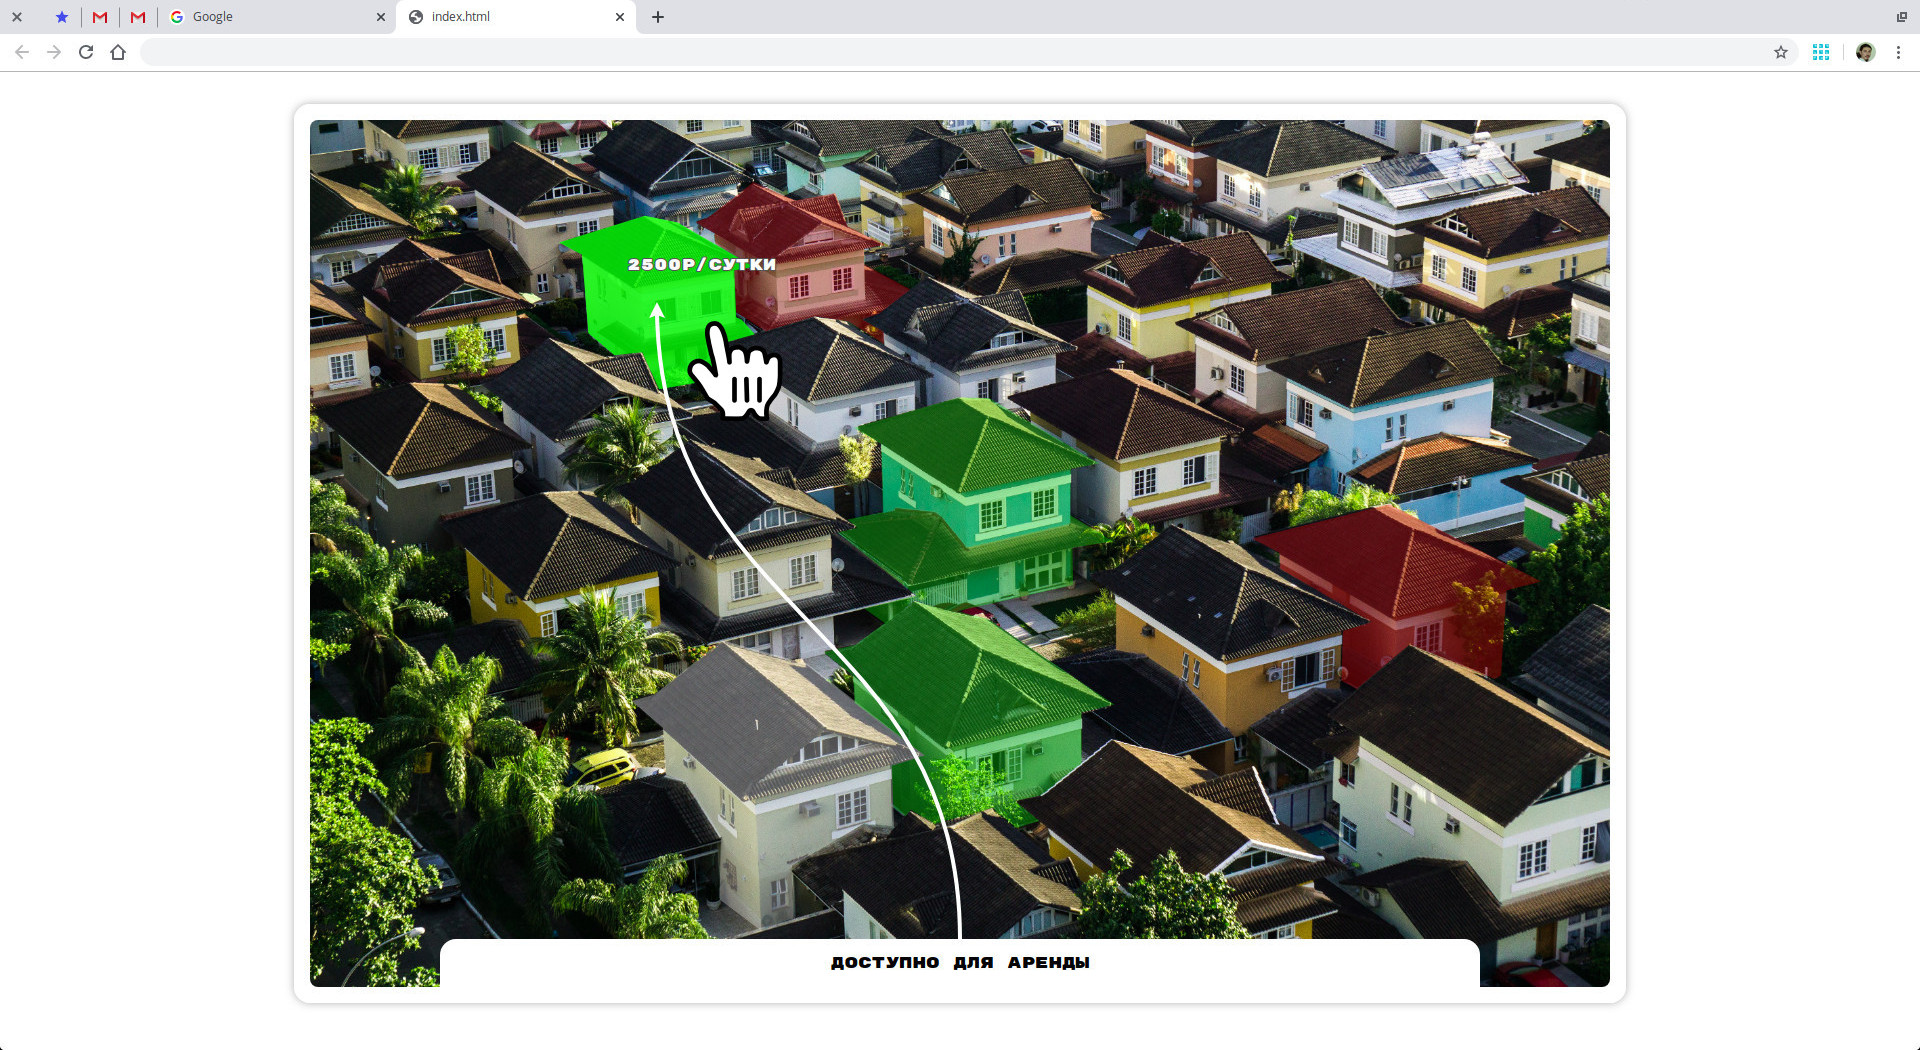
Here you can display additional information (in our case, simply the current status of the object) in the place for information. It will turn out almost what is needed:
Such things are rarely designed for mobile devices, but it is worth remembering that they are often made full-screen on the desktop, and even with some panels on the side for additional information and you need to stretch everything beautifully. Something like this for example:
svg { width: 100%; height: 100%; }
In this case, the proportions of the SVG element will definitely not coincide with the proportions of the image inside. What to do?
Mismatching proportions
The first thing that comes to mind is the object-fit: cover property from CSS. But there is one point: it is absolutely not able to work with SVG. And even if it worked, then the houses along the edges of the plan could get out of the edges of the scheme and become completely inaccessible. So here you need to go a little more complicated way.
Step one. SVG has a preserveAspectRatio attribute, which is somewhat similar to the object-fit property (not quite, of course, but ...). By preserveAspectRatio="xMinYMin slice"
for the main SVG element of our plan, we get an extended circuit without voids at the edges and without distortion.
Step Two You need to make a drag and drop with the mouse. Technically, we still have such an opportunity. Here the task is more complicated, especially for beginners. In theory, we have standard events for the mouse and touchscreen that can be processed and get the value of how much the map needs to be moved. But in practice, this can be bogged down for a very long time. Hammer.js will come to the rescue - another small library that takes the entire internal kitchen onto itself and provides a simple interface for working with drag and drop, swipe, etc.
We need to move the layer with the buildings and the picture in all directions. Make it easy:
const buildingsLayer = map.querySelector('.buildings_layer'); const hammertime = new Hammer(buildingsLayer); hammertime.get('pan').set({ direction: Hammer.DIRECTION_ALL });
By default, hammer.js also includes swipe recognition, but we do not need them on the map, so turn them off right away so that we don’t fool our heads:
hammertime.get('swipe').set({ enable: false });
Now you need to somehow understand what exactly you need to post to move the map only to its edges, but not further. With a simple representation of two rectangles in the head, we understand that for this we need to find out the indentation of the layer with buildings from the parent element (SVG in our case) from all four sides. GetBoundingClientRect comes to the rescue:
const layer = buildingsLayer.getBoundingClientRect(); const parent = svg.getBoundingClientRect(); const offsets = { top: layer.top - parent.top, bottom: layer.bottom - parent.bottom, right: layer.right - parent.right, left: layer.left - parent.left, };
And why do we still have no more civilized (and stable working) way to do this? Each time, getting getBoundingClientRect is very bad in terms of performance, but the choice is not very rich, and it’s almost impossible to notice inhibition, so we won’t come up with premature optimizations where everything works just fine. One way or another, this allows us to check the position of the layer with buildings and move everything only if it makes sense:
let translateX = 0; let translateY = 0; hammertime.on('pan', (e) => { const layer = buildingsLayer.getBoundingClientRect(); const parent = svg.getBoundingClientRect(); const offsets = { top: layer.top - parent.top, bottom: layer.bottom - parent.bottom, right: layer.right - parent.right, left: layer.left - parent.left, }; const speedX = e.velocityX * 10; const speedY = e.velocityY * 10; if (speedX > 0 && offsets.left < 0) { // } else if (speedX < 0 && offsets.right > 0) { // } if (speedY > 0 && offsets.top < 0) { // } else if (speedY < 0 && offsets.bottom > 0) { // } buildingsLayer.setAttribute('transform', `translate(${translateX} ${translateY})`); });
At the edges it is usually worth slowing down so that there are no sudden stops or jerks. Thus, everything goes back and forth into something like this:
if (speedX < -offsets.left) { translateX += speedX; } else { translateX += -offsets.left * speedX / 10; }
There are many options for slowdowns. This one is the easiest. And yes, it’s not very beautiful, but it’s dumb as a cork and clear. Coefficients in such examples are usually matched by eye, depending on the desired behavior of the card.
If you open a browser and play with the window size in the developer’s tools, you can find that something went wrong ...
Impure forces
Everything works on desktop devices, but magic happens on mobile devices, namely, instead of moving the map, the body element moves. Oooooooo! Only the cast there is not enough. Although okay, this happens because something is overflowing somewhere and some overwrite was not set to overflow: hidden. But in our case, it may happen that nothing moves at all.
A riddle for green typesetters: there is the g element, inside the svg element, inside the div element, inside the body element, inside the html element. Doctype naturally html. If you add transform: translate (...) to it to drag the g element, then on the laptop it will move as intended, but on the phone it will not even move. There are no errors in the console. But there is definitely a bug. The browser is the last Chrome both there and there. The question is why?
I suggest you think about 10 minutes without Google before looking at the answer.
Haha I deceived you. More precisely, not so. I described what we would observe with manual testing. But in fact, everything works as it should. This is not a bug, but a feature related to the CSS property of touch-action . In the context of our task (all of a sudden!) It is revealed that it exists, and, moreover, has a certain value that breaks the whole logic of interaction with the map. So we deal with him very rudely:
svg { touch-action: none !important; }
But back to our sheep and look at the result (it is better, of course, to open in a separate tab):
I decided not to customize the code for any of the fashionable frameworks, so that it remains in the form of a neutral formless blank, from which you can build on when creating your components.
What is the result?
Having spent quite a bit of time, we made a plan on which there is a bitmap picture, highlighting its various details, connecting unconnected objects with arrows and reactions to the mouse. I hope that I managed to convey the basic idea of how all this is done in the “budget” version. As we noted at the beginning of the article, there are many different applications, including those that are not related to some kind of confused design sites (although this approach is used very often on them). Well, if you are looking for something to read about interactive, but already three-dimensional things, then I leave a link to an article on the topic - Three - dimensional product presentations on Three.js for the smallest .