The author of the article, the translation of which we publish, says that recently he decided to take up the profiling of his open-source Go-project Flipt . He wanted to find code in the project that could be optimized effortlessly and thereby speed up the program. During profiling, he discovered some unexpected problems in the popular open source project that Flipt used to organize routing and middleware support. As a result, it was possible to reduce the amount of memory allocated by the application during operation by 100 times. This, in turn, reduced the number of garbage collection operations and improved the overall performance of the project. Here is how it was.
High traffic generation
Before I could start profiling, I knew that first I needed to generate a large amount of traffic entering the application, which would help me see some patterns of its behavior. Then I immediately ran into a problem, since I have nothing that would use Flipt in production and get some traffic that allows me to evaluate the work of the project under load. As a result, I found a great tool for load testing projects. This is Vegeta . The authors of the project say that Vegeta is a universal HTTP tool for load testing. This project was born from the need to load HTTP services with a large number of requests coming to services with a given frequency.
The Vegeta project turned out to be exactly the tool that I needed, since it allowed me to create a continuous stream of requests to the application. With these requests, you could “shell” the application as much as needed in order to find out indicators such as allocation / memory usage on the heap, features of goroutines, time spent on garbage collection.
After conducting some experiments, I went to the following configuration of the Vegeta launch:
echo 'POST http://localhost:8080/api/v1/evaluate' | vegeta attack -rate 1000 -duration 1m -body evaluate.json
This command launches Vegeta in
attack
mode, sending HTTP POST REST API Flipt requests at a speed of 1000 requests per second (and this, admittedly, is a serious load) for a minute. JSON data sent by Flipt is not particularly important. They are needed only for the correct formation of the request body. Such a request was received by the Flipt server, which could perform the request verification procedure.
Please note that I first decided to test the Flipt
/evaluate
. The fact is that it runs most of the code that implements the logic of the project and performs "complex" server calculations. I thought that analyzing the results of this endpoint would give me the most valuable data on areas of the application that could be improved.
Measurements
Now that I had a tool for generating a sufficiently large amount of traffic, I needed to find a way to measure the impact that this traffic had on a running application. Fortunately, Go has a pretty good standard set of tools that can measure program performance. It's about the pprof package.
I will not go into the details of using pprof. I don’t think I’ll do it better than Julia Evans, who wrote this wonderful article about profiling Go programs with pprof (if you haven’t read it, I definitely recommend you take a look at it).
Since the HTTP router in Flipt is implemented using go-chi / chi , it was not hard for me to enable pprof using the appropriate Chi intermediate handler.
So, in one window Flipt worked for me, and Vegeta, filling up Flipt with requests, worked in another window. I launched the third terminal window in order to collect and examine heap profiling data:
pprof -http=localhost:9090 localhost:8080/debug/pprof/heap
It uses the Google pprof tool, which can visualize profiling data directly in the browser.
First I checked the
inuse_objects
and
inuse_space
in order to understand what is happening on the heap. However, I could not find anything remarkable. But when I decided to take a look at the
alloc_objects
and
alloc_space
, something alerted me.
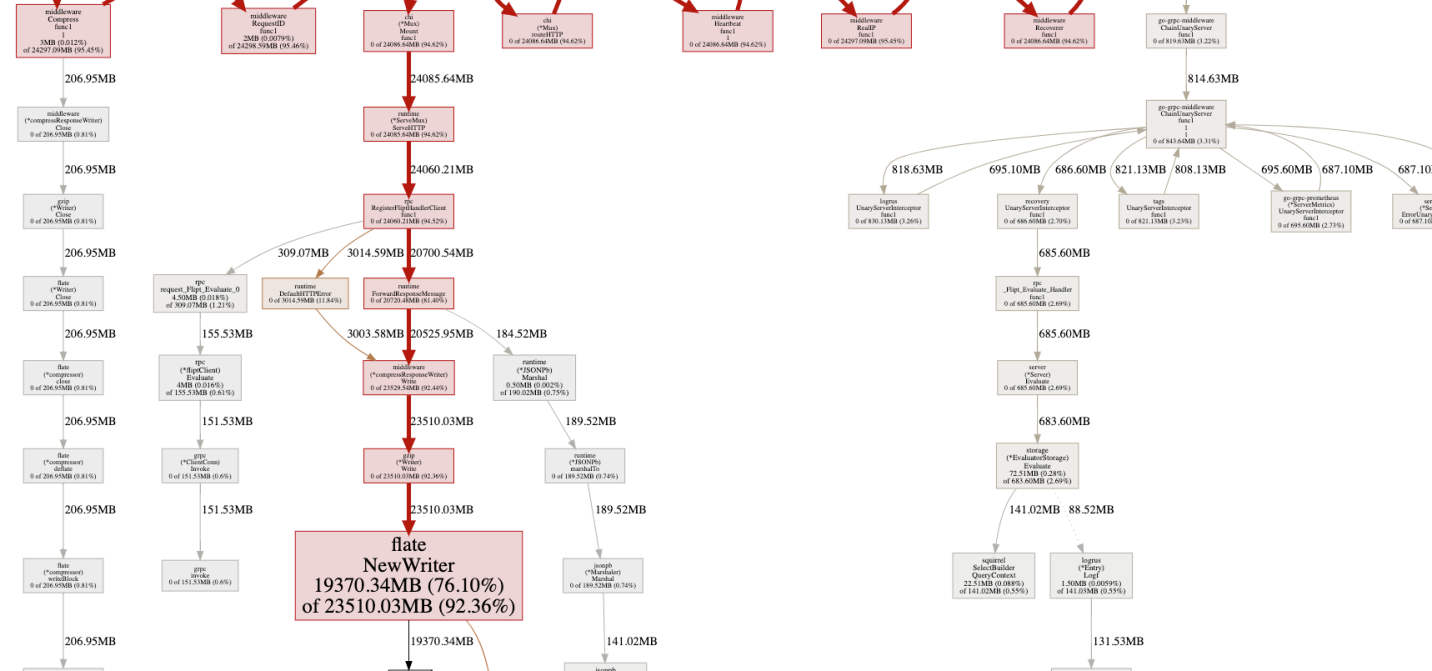
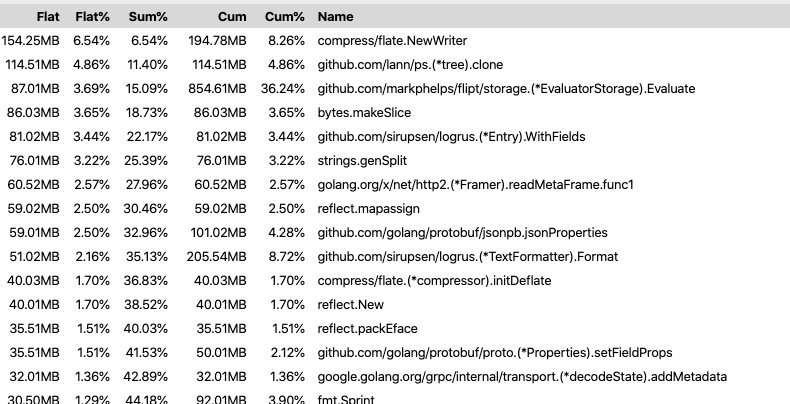
Analysis of profiling results ( original )
There was a feeling that something called
flate.NewWriter
allocated 19370 MB of memory for a minute. And this, by the way, is more than 19 gigabytes! Here, obviously, something strange was happening. But what exactly? If you look at the original of the above diagram, it turns out that
flate.NewWriter
is called from
gzip.(*Writer).Write
, which, in turn, is called from
middleware.(*compressResponseWriter).Write
. I quickly realized that what was happening had nothing to do with Flipt code. The problem was somewhere in the Chi middleware code used to compress responses from the API.
// r.Use(middleware.Compress(gzip.DefaultCompression))
I commented out the line above and ran the tests again. As expected, a huge number of memory allocation operations have disappeared.
Before I set about finding a solution to this problem, I wanted to look at these memory allocation operations on the other hand and understand how they affect performance. In particular, I was interested in their impact on the time it takes for the program to collect garbage. I remembered that Go still has a trace tool that allows you to analyze programs during their execution and collect information about them for certain periods of time. The data collected by trace includes such important indicators as heap usage, the number of goroutines being executed, information about network and system requests, and, which was especially valuable to me, information about the time spent in the garbage collector.
To effectively collect information about a running program, I needed to reduce the number of requests per second sent to the application using Vegeta, since the server regularly gave me
socket: too many open files
errors. I assumed that this is because
ulimit
was set too low on my computer, but I didn’t want to go into it then.
So, I restarted Vegeta with this command:
echo 'POST http://localhost:8080/api/v1/evaluate' | vegeta attack -rate 100 -duration 2m -body evaluate.json
As a result, if we compare this with the previous scenario, only a tenth of the requests were sent to the server, but this was done for a longer period of time. This allowed me to collect high-quality data on the work of the program.
In another terminal window, I ran this command:
wget 'http://localhost:8080/debug/pprof/trace?seconds=60' -O profile/trace
As a result, I had at my disposal a file with trace data collected in 60 seconds. You could examine this file using the following command:
go tool trace profile/trace
The execution of this command led to the discovery of the collected information in the browser. They were presented in a convenient graphic form for study.
Details about
go tool trace
can be found in this good article.
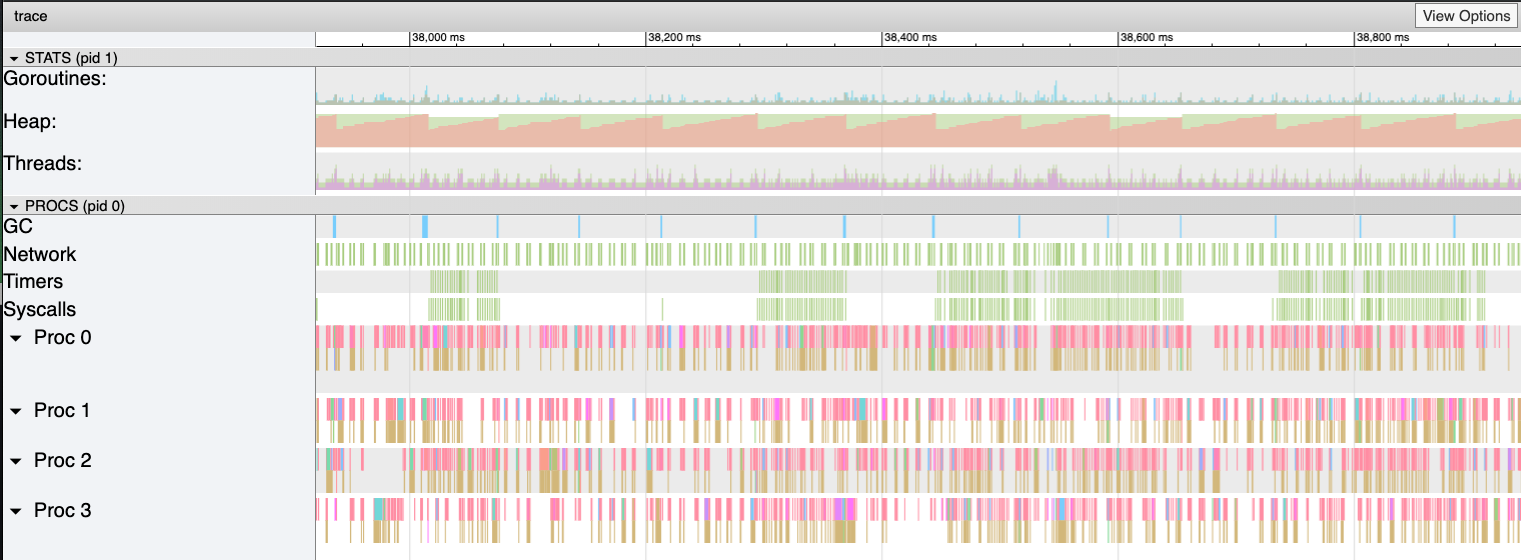
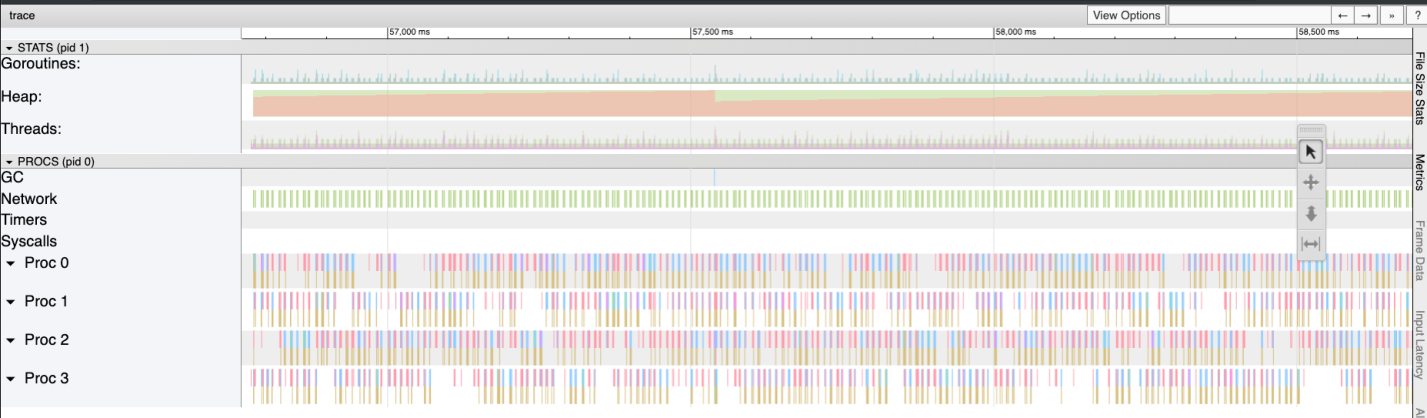
Flipt trace results. A sawtooth graph of memory allocation on the heap is clearly visible ( original )
On this graph, it is easy to see that the amount of memory allocated on the heap tends to grow quite rapidly. In this case, after growth, a sharp drop follows. The places where the allocated memory falls are garbage collection operations. Here you can see the pronounced blue columns in the GC area, representing the time spent on garbage collection.
Now I have collected all the evidence I needed for the “crime” and could begin to search for a solution to the problem of allocating memory.
Solution
In order to find out the reason why calling
flate.NewWriter
led to so many memory allocation operations, I needed to look at the Chi source code. In order to find out which version of Chi I am using, I ran the following command:
go list -m all | grep chi github.com/go-chi/chi v3.3.4+incompatible
Having reached the source code chi / middleware / compress.go @ v3.3.4 , I was able to find the following method:
func encoderDeflate(w http.ResponseWriter, level int) io.Writer { dw, err := flate.NewWriter(w, level) if err != nil { return nil } return dw }
In further research, I found out that the
flate.NewWriter
method, through an intermediate handler, was called for each response. This corresponded to the huge amount of memory allocation operations that I saw earlier, loading the API with a thousand requests per second.
I didn’t want to refuse to compress API responses or look for a new HTTP router and a new middleware support library. Therefore, I first of all decided to find out whether it is possible to cope with my problem simply by updating Chi.
I ran
go get -u -v "github.com/go-chi/chi"
, upgraded to Chi 4.0.2, but the middleware code for data compression looked, as it seemed to me, the same as before. When I ran the tests again, the problem did not go away.
Before putting an end to this issue, I decided to look for issues or PR messages in the Chi repository that mention something like “compression middleware”. I came across one PR with the following heading: “Re-wrote the middleware compression library”. The author of this PR said the following: “In addition, sync.Pool is used for encoders, which has a Reset method (io.Writer), which reduces the memory load.”
Here it is! Fortunately for me, this PR was added to the
master
branch, but since no new Chi release was created, I needed to update like this:
go get -u -v "github.com/go-chi/chi@master"
This update, which pleased me very much, was backward compatible, its use did not require changes in the code of my application.
results
I ran the load tests and profiling again. This allowed me to verify that the Chi update resolved the issue.
Now flate.NewWriter uses one-hundredth of the previously used amount of allocated memory ( original )
Looking again at the trace results, I saw that the heap size is now growing much more slowly. In addition, the time required for garbage collection has decreased.
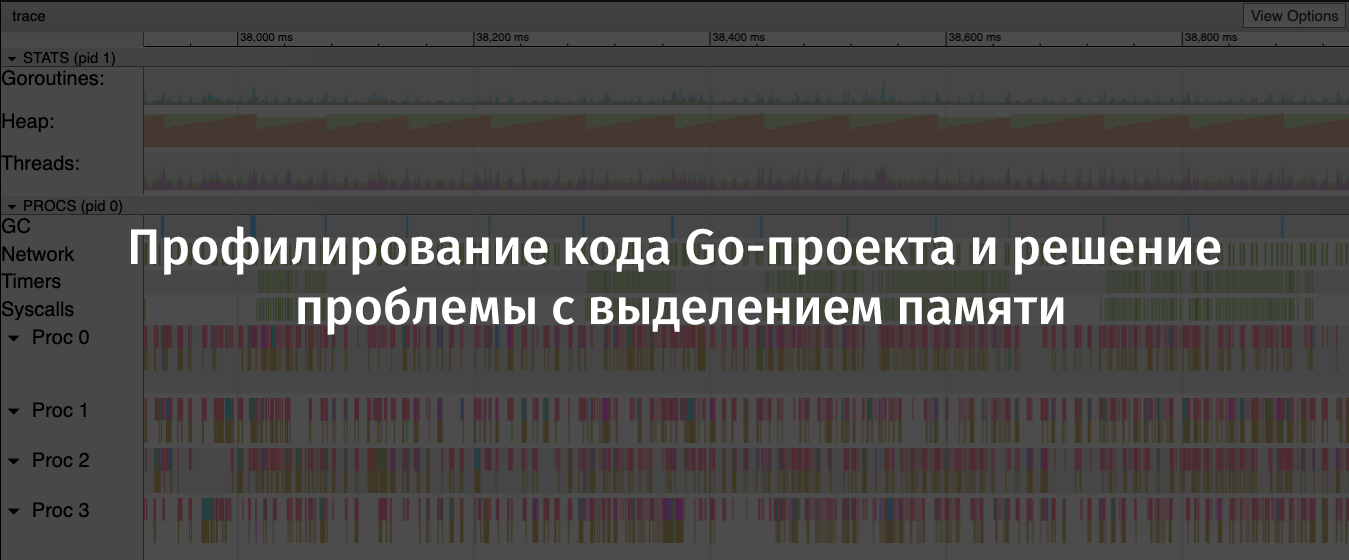
Goodbye - “saw” ( original )
After some time, I updated the Flipt repository, having more confidence than before that my project will be able to adequately cope with the high load.
Summary
Here are the conclusions I made after I managed to find and fix the above problems:
- You should not rely on the assumption that open source libraries (even popular ones) have been optimized, or that they have no obvious problems.
- An innocent problem can lead to serious consequences, to manifestations of the "domino effect", especially under heavy load.
- If possible, you should use sync.Pool .
- It’s useful to keep on hand tools for testing projects under load and for profiling them.
- Go Tooling and OpenSource - Great!
Dear readers! How do you research the performance of your Go projects?