In our blog, we talked a lot about foreign solutions for monitoring and auditing, and now it's time for domestic development. MONQ is an umbrella system with connectors for common monitoring systems, resource-service models, data analysis, high AI potential and a special licensing model. We were given a distribution to look at and we decided to share how it is there under the hood and whether everything is as nanotechnological as the vendor says (the project, after all, is a Skolkovo resident). The honor of testing fell to me and I'll tell you about the installation, the capabilities of the system and a little about licensing. I ask for cat.
Introduction
In 2018, Gartner introduced a new term to describe how artificial intelligence (AI) can be applied to IT support. "AIOps (Artificial Intelligence for IT Operations) promises to save the time and effort of IT services in identifying various issues in the increasingly complex environment in which they have to work." Gartner suggests that AI will be used to automatically identify problems and resolve them. In 2019, this seems like a fairy tale, and I have not yet seen any real cases of fully automatic IT support.
I got the MONQ platform from MONQ Digital lab . The developer himself positions it as an AIOps solution. But I would call it a system of umbrella monitoring, event management, and launching automation scripts. There is not much intelligence in it yet.
On duty, I support more than 100 different systems, servers, services, services. My casual monitoring tools are Zabbix and Prometheus, as they cover most of the performance monitoring tasks. A couple of systems in the monitoring loop sometimes stop responding, it is treated by rebooting the server (there is no other way, nobody will rewrite the curve code). I always wanted to try to implement a case when the monitoring system identifies a problem from two independent sources and restarts the server itself. For such tasks, umbrella systems with scripting subsystems are usually used, as it is now fashionably called RPA (Robotic Process Automation). I don’t know free systems, but commercial ones are like a cast-iron bridge.
Today we will try to install MONQ together, connect Zabbix and Prometheus to it, configure alerts and write a server reboot script. So that tomorrow you can calmly throw your feet on the table, only occasionally watching the process of treating one machine with another machine and drink coffee with a croissant.
Solution Architecture
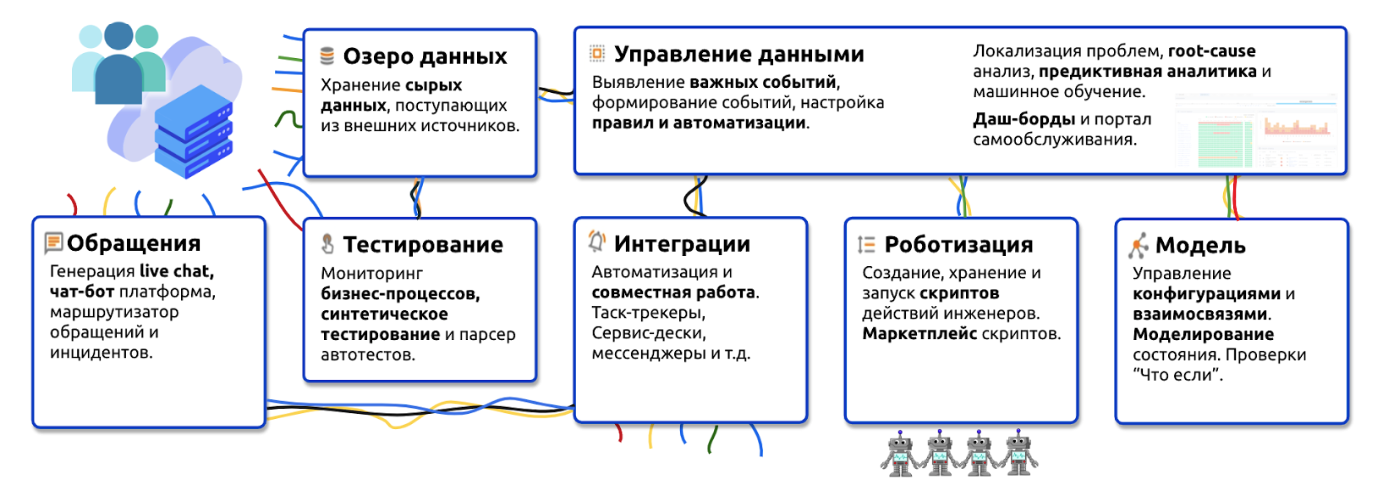
MONQ Architecture
The system is deployed in docker containers in the kubernetes cluster. Microservice sets are combined into functional blocks. All data from users, technical information, events, logs after enrichment with various useful tags fly into the data lake on ClickHouse, then the process of calculation and analysis takes place. Patterns, important events are detected, composite triggers are formed and various important processes can be launched for important events: from alerts and incidents to complex user scripts.
Unpacking
Youtube is full of videos unpacking something. Now I will try to do the same, but in a text-picture format and not with a physical product, but with a distribution. To get started, prepare - install the kubernetes cluster.
You can read about setting up a kubernetes cluster, for example, here . I’ll tell you about the configuration features:
- coredns is used as cluster DNS;
- nginx-ingress-controller;
- rbac authorization in a cluster;
- shared storage (pv / pvc) is used.
For each project, the vendor provides technical requirements for hardware. The minimum configuration for installation is 4 servers. This is enough to conduct a pilot, subject to integration with one monitoring system. For my purposes, checking the functionality of the system, this option will also work.
In combat conditions, as I was told, the system scales to the customer’s needs depending on the load and the required fault tolerance.
My configuration for the system at the minimum:
| Server | CPU cores | Memory gb | Storage, Gb |
| kubernetes master | one | 2 | fifty |
| kubernetes worker 1 | 4 | 8 | one hundred |
| kubernetes worker 2 | 4 | 8 | one hundred |
| DB server | 4 | 7 | 300 |
| Total | thirteen | 25 | 550 |
After the platform is ready, I launch the vendor's ansible playbook to install the basic infrastructure and launch the system. Playbook does the following:
- installs the necessary packages on the servers;
- launches kubernetes;
- installs and configures applications on the database server. Among them: Clickhouse, RabbitMQ, PostgreSQL, ArangoDB, Redis and all this in docker containers;
- installs Consul for centralized storage of microservice configurations;
- adds endpoint, service ingress entities for DBMS and infrastructure parts of the system;
- generates a table with authorization data.
In order not to start the microservice application manually, the vendor has prepared a built-in microservice registry that adds and updates microservices, configures the DBMS and interservice authorization.
Starting the system boils down to the following actions:
- the system installer is launched with a pre-prepared configuration file (it contains authorization data in kubernetes, DBMS and Consul, the domain name of the system);
- the installer starts the microservice registry;
- using the registry, microservices are started one by one, the registry generates a configuration of microservices in consul, entities deployment, service, ingress in kubernetes;
- at startup, each microservice loads a schema for its own database.
The result of the installer that I launched is in the picture below.
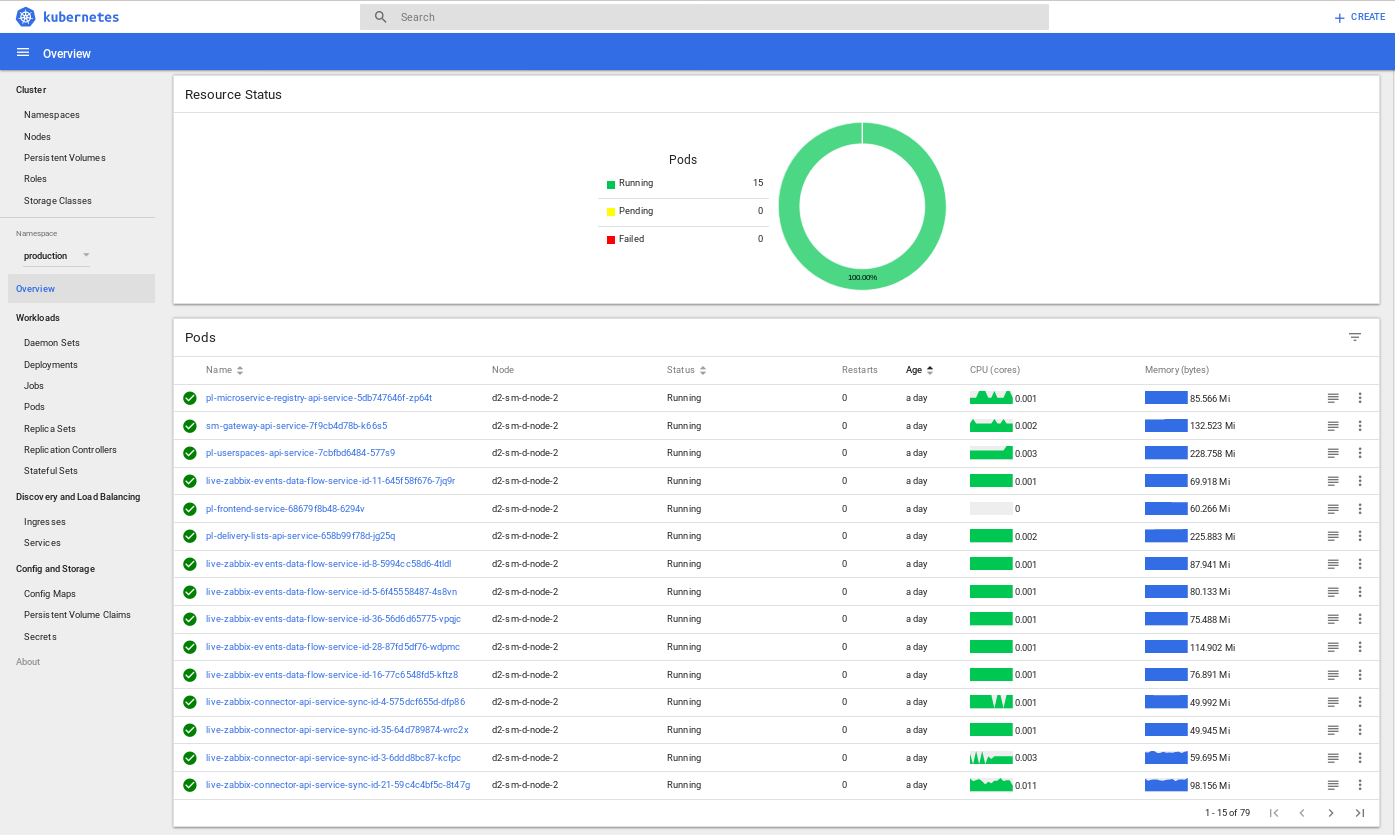
Kubernetes dashboard: the result of the installer
After the installation process is complete, MONQ will be available by the domain name that I specified in the installer configuration file. And here he is.
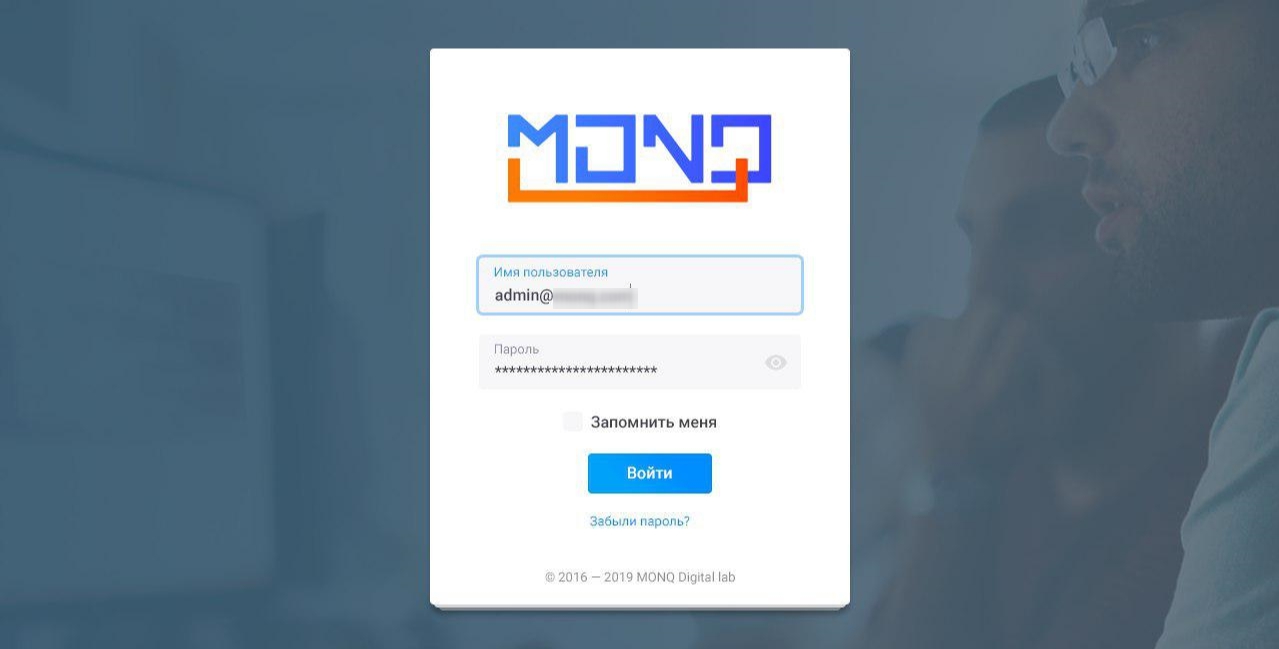
MONQ Login Interface
Customization
In the initial setup of the system, there is already a user with full control rights. I log in under it and look at what MONQ is capable of.
Creating users in the system and setting up work groups
There are two user authorization methods in the system:
- Active Directory
- Built in.
For the first acquaintance, built-in authorization is suitable.
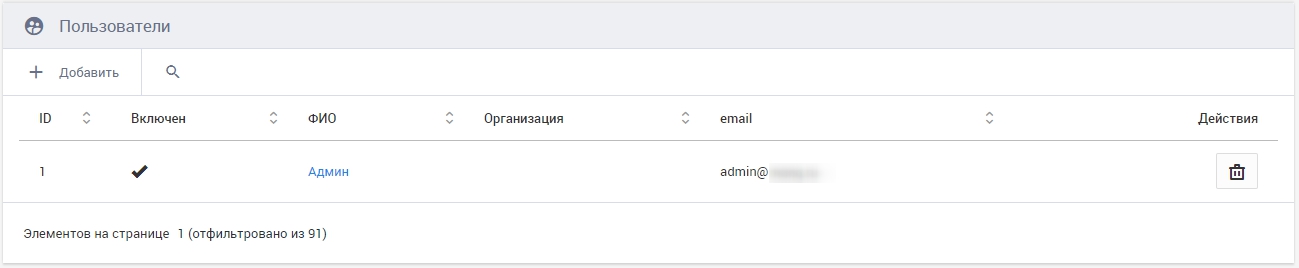
Preset System User
Access rights to the objects and resources of the system (integration, configuration units (KE), synthetic triggers, scripts, etc.) are issued at the level of working groups (WGs). Any WG can be the owner of the object or have the rights to read or write. There are several access levels:
- Members of the WG with the level of owner rights can perform any actions with the object (WG with this level of rights, the object can have only one);
- A WG with the right to record can manage the object, but cannot delete it and give it rights to other WGs;
- A WG with the right to read can view information on an object;
- A WG without an access right to an object is not at all aware of its existence.
By default, the system has been created WP "Administrators of the space", which just settled my user. This WG has full rights to all objects that will be created in this entity. For colleagues who also want to take a look at the system, created an additional Super Administrators WP.
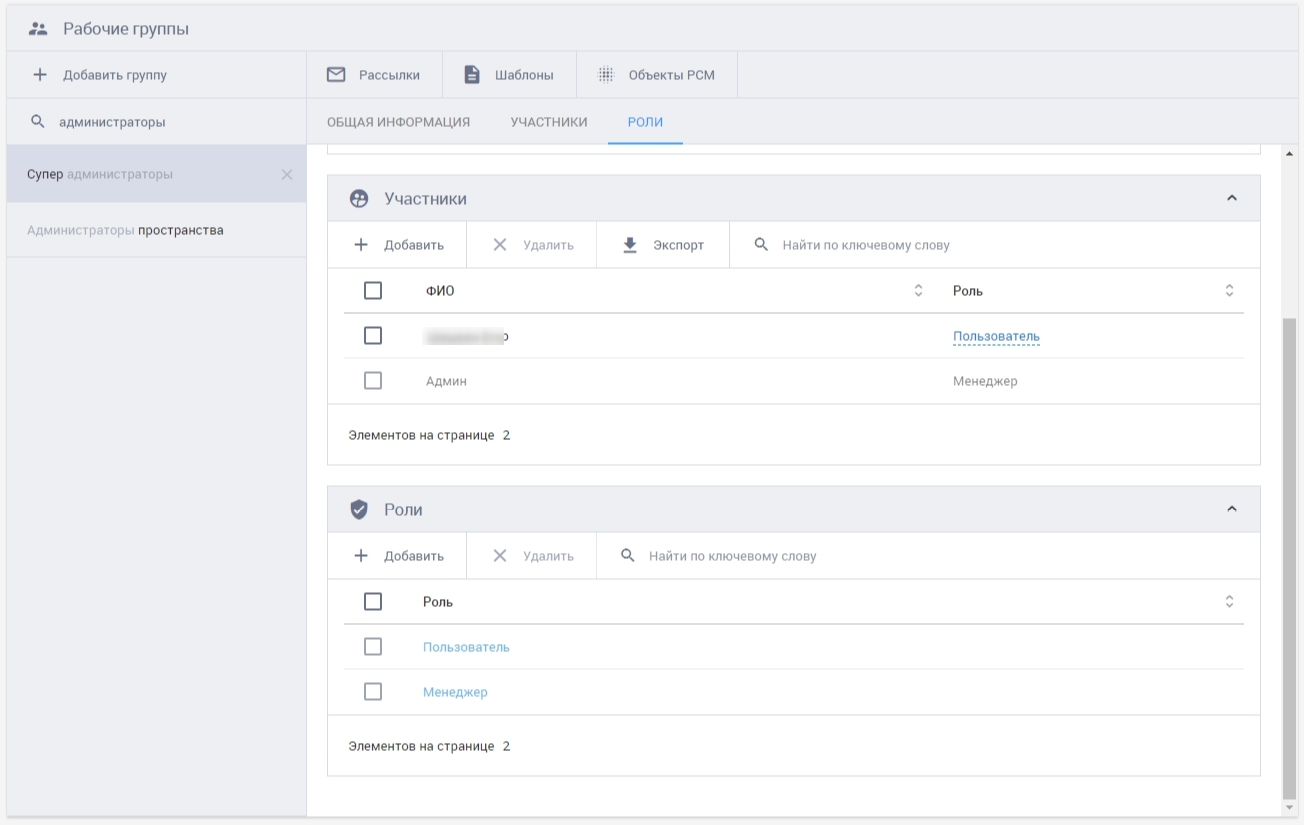
Working groups, roles and participants
The rights of specific users are configured within the framework of the WG in the form of roles.
PCM setup
It's about the resource-service model. This is a logical service model that describes the composition and relationships of KEs with KE resources, which together provide a service at an agreed level. PCM is needed to store information about objects, entities and the relationships between them. PCM in MONQ is a network graph containing information about KEs and their relationships.
The main difference and, in my opinion, the advantage of implementing PCM in the system is the focus on business services. This helps to present the complete structure of the service or service that the end user uses, and not focus on the infrastructure system on which the service or service is based.
For testing purposes, I made a simplified PCM "User’s Personal Account".
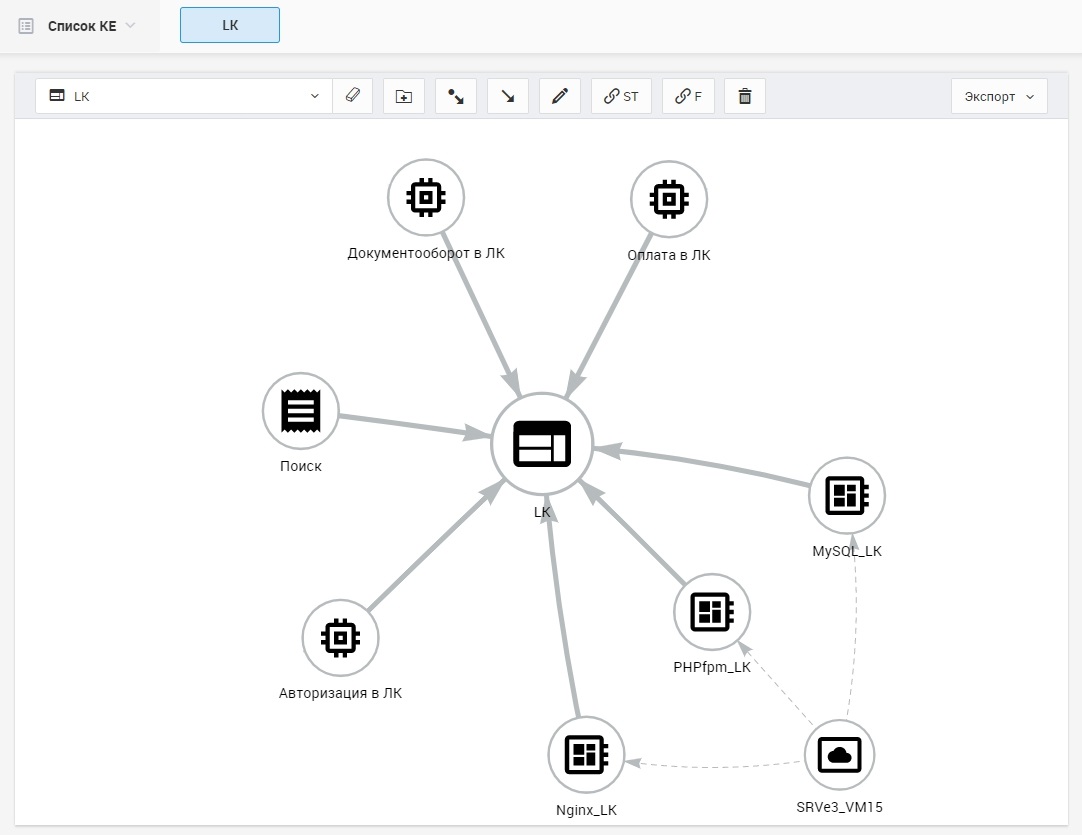
PCM "User’s personal account"
After setting up the monitoring, I will show how it will be transformed.
Composition of PCM:
- The virtual machine on which the information system (IS) SRVe3_VM15 is running;
- STR: Nginx_LK, PHP-fpm_LK, MySQL_LK;
- Our service (IS) - LK (personal account);
- IP Modules: Authorization, Search, Document Management, Payment. In fact, there are more of them, but so far only created these.
Integration Setup
MONQ provides connection of various types of systems:
- Monitoring systems (Zabbix, Prometheus, SCOM and others);
- Log collection systems (Splunk, Logstash and others);
- Autotest launch systems (Jenkins, Gitlab CI and others)
- Service desks, task trackers (Microfocus SM, Jira, Redmine, Naumen and others).
I connected monitoring systems Zabbix, Prometheus. These connectors are configured in the Integration section.
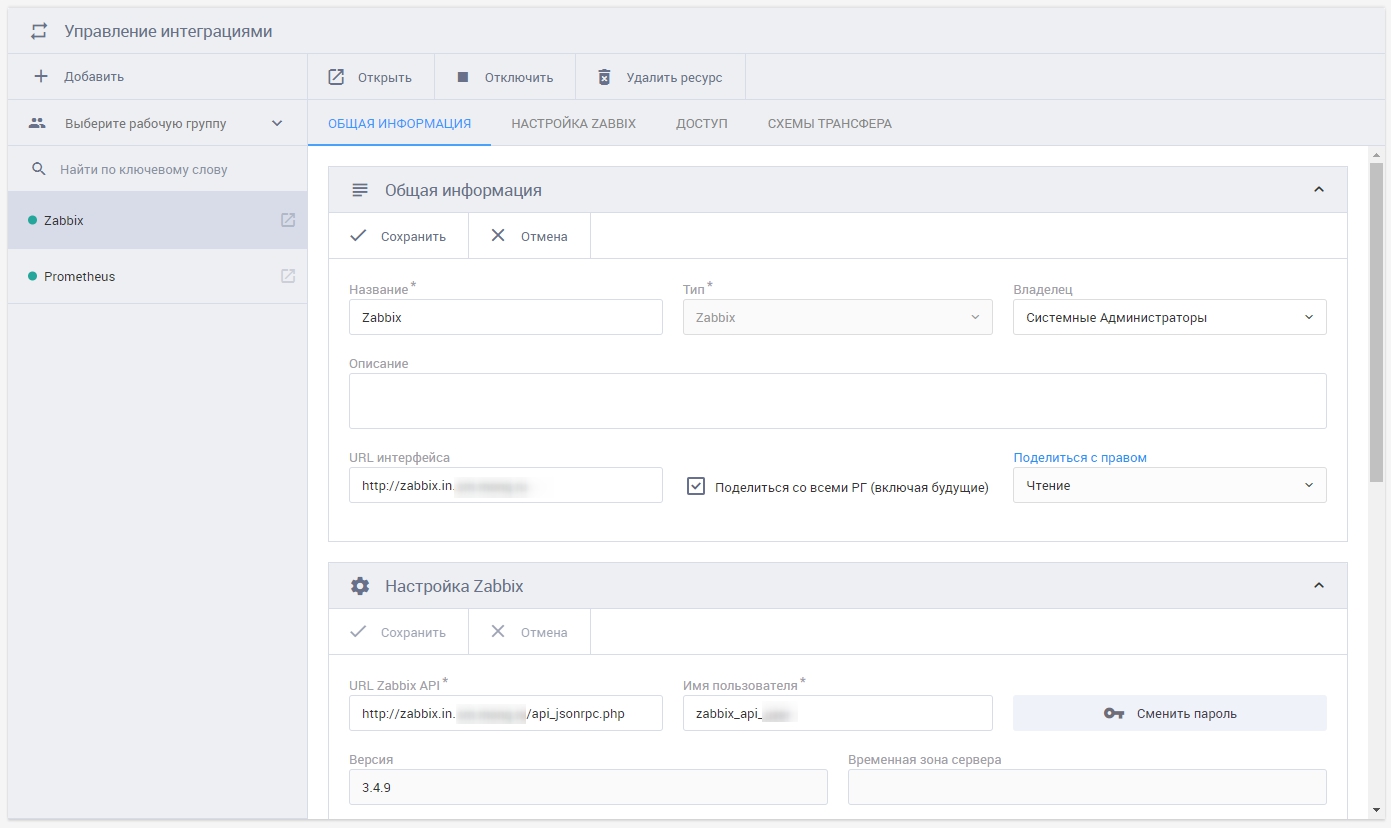
Integration with monitoring systems
Metrics and events come from Zabbix and Prometheus to MONQ.
Connection of synthetic monitoring (automated functional testing)
In MONQ, you can also configure functional testing of applications. In my example, this is a personal account. I have connected several builds of autotests from Jenkins.

Functional monitoring module “FMON projects”
Functional monitoring in MONQ is a separate module with its own “Functional Testing” screen. And here is an example of a report on the execution of one of my tests:
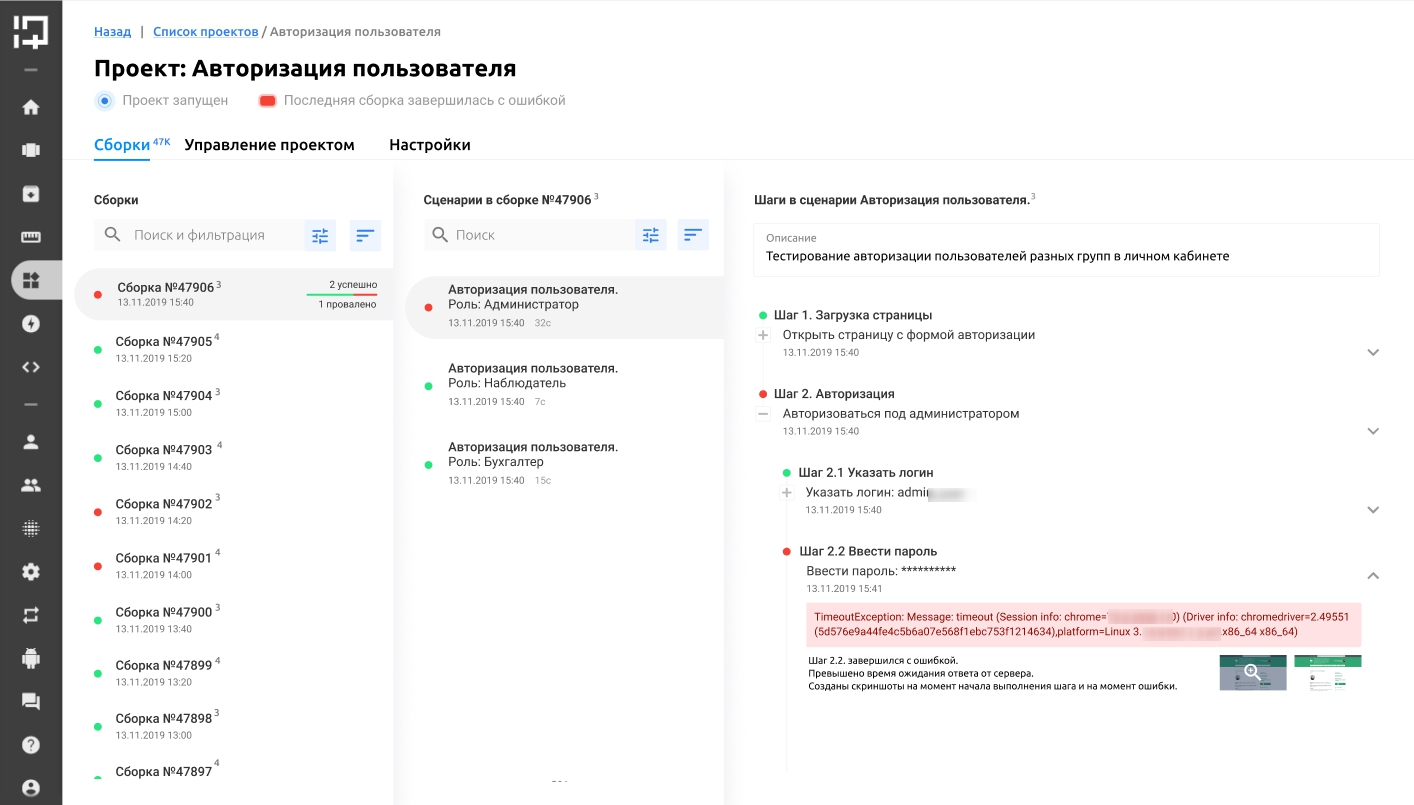
FMON User Authorization Project, failed assembly
Configure monitoring and alerts
Using standard templates (several ready-made templates for synthetic triggers for each integration are available from the box) he created synthetic triggers for primary events from Zabbix and Prometheus. Synthetic triggers here are triggers created inside the platform that work with primary data from different sources. Next, I linked the resulting triggers to the PCM elements (KE).
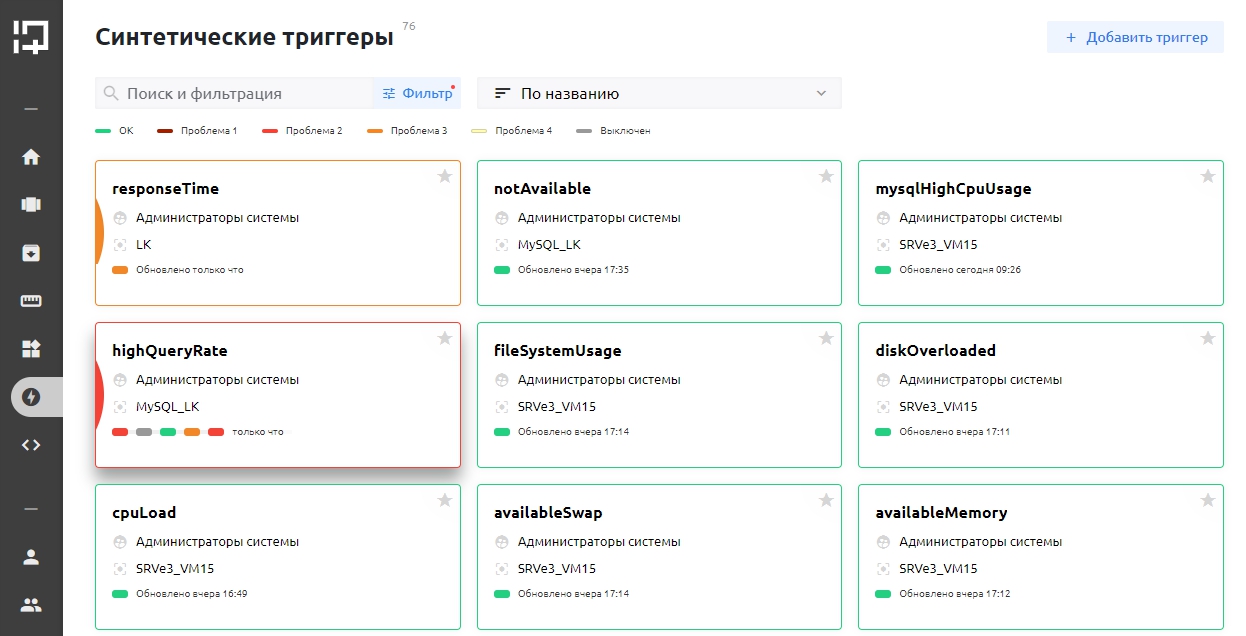
Section "Synthetic triggers"
And it looks like a synthetic trigger created by the template.
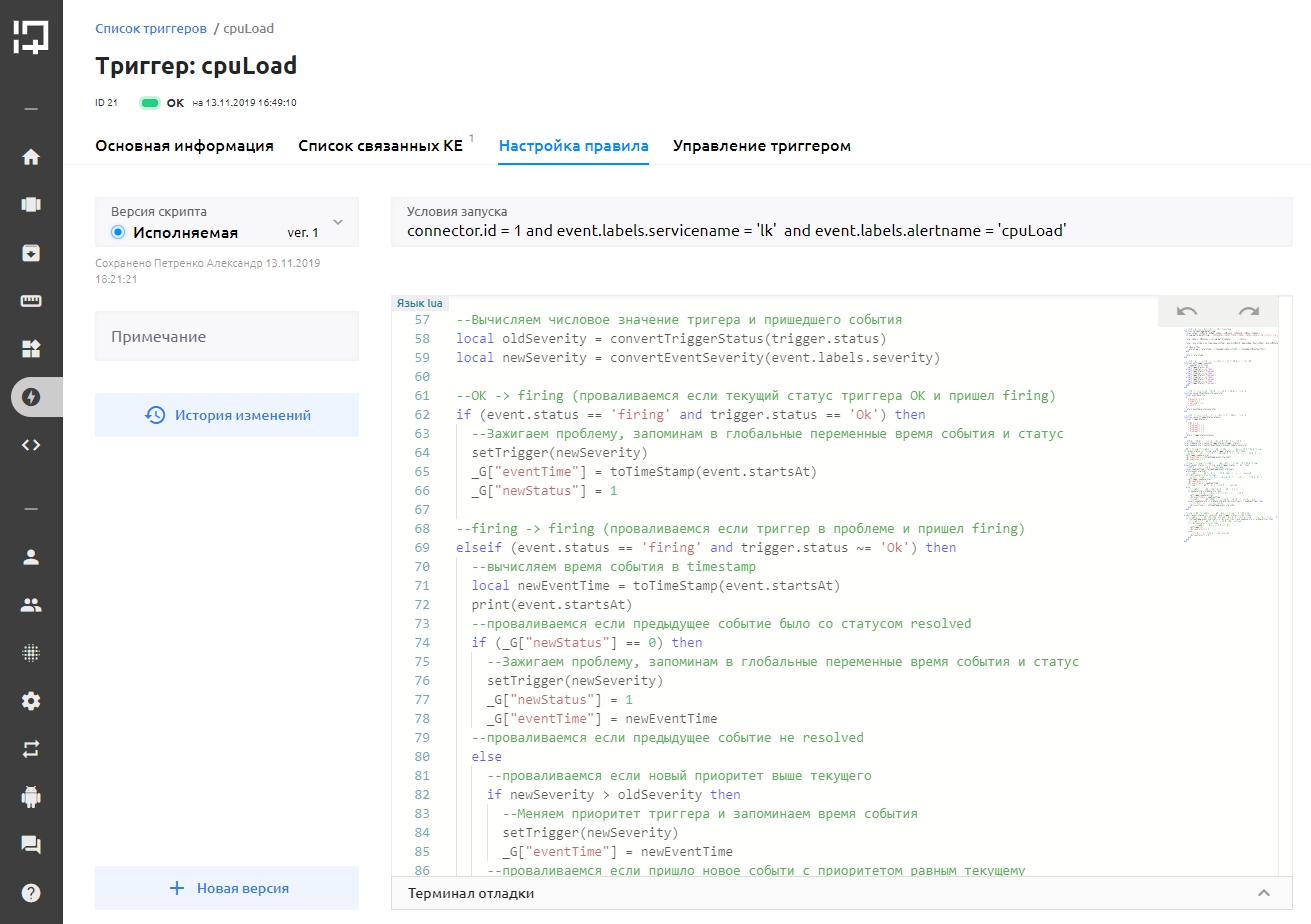
An example of a synthetic trigger created by the template for Prometheus
In the "My Scripts" section, for example, there is already a script that restarts the server. The script itself is written in Lua and can be changed. Based on it, I made my own script to restart the service.

Service reboot script on the server
In addition to the usual integration with the mail client, out of the box you can configure the sending of notifications to various instant messengers. In this case, you can set up a chat bot that will write to a special group, for example, to the administrators chat in a telegram.
To use integrations with instant messengers, you need to open access to the Microsoft Azure cloud.
Advanced users can write their own notification plugins on Lua. Below is an example of my script for sending SMS notifications.
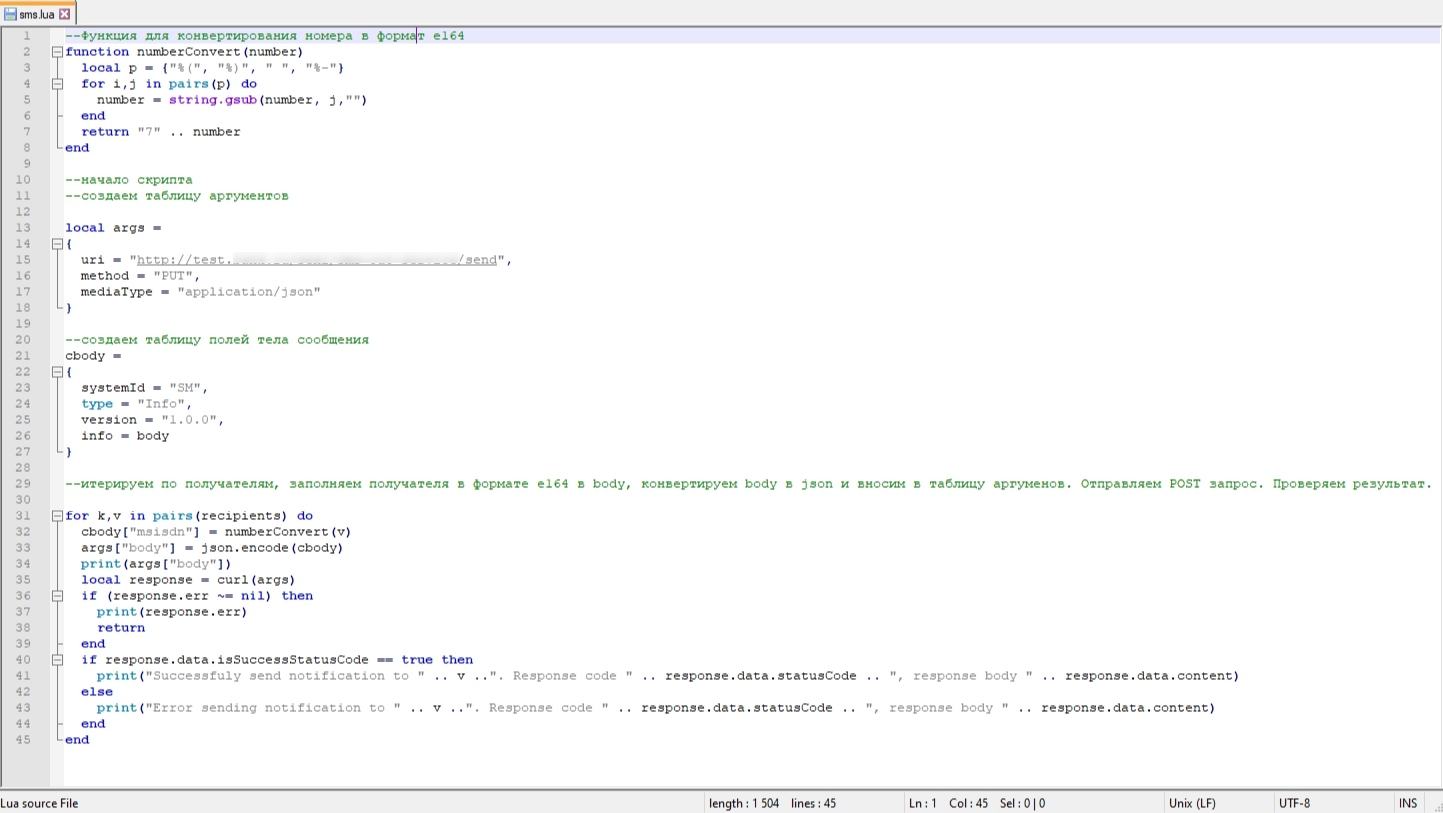
SMS sending plugin for MONQ platform
Monitoring visualization
After tuning, my PCM changed a little, three more systems were placed for general monitoring, the state of which determines the performance of the IS “Personal User Account”. Also added several services.
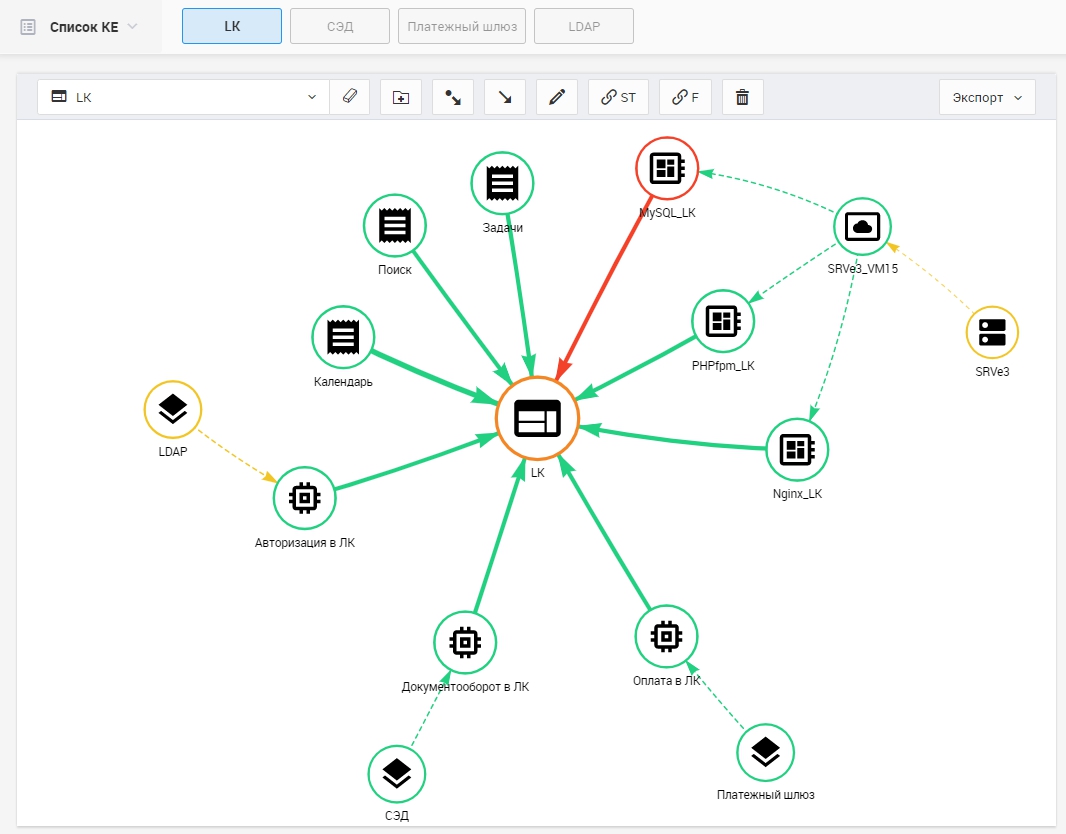
PCM “User’s Personal Account” with attached triggers
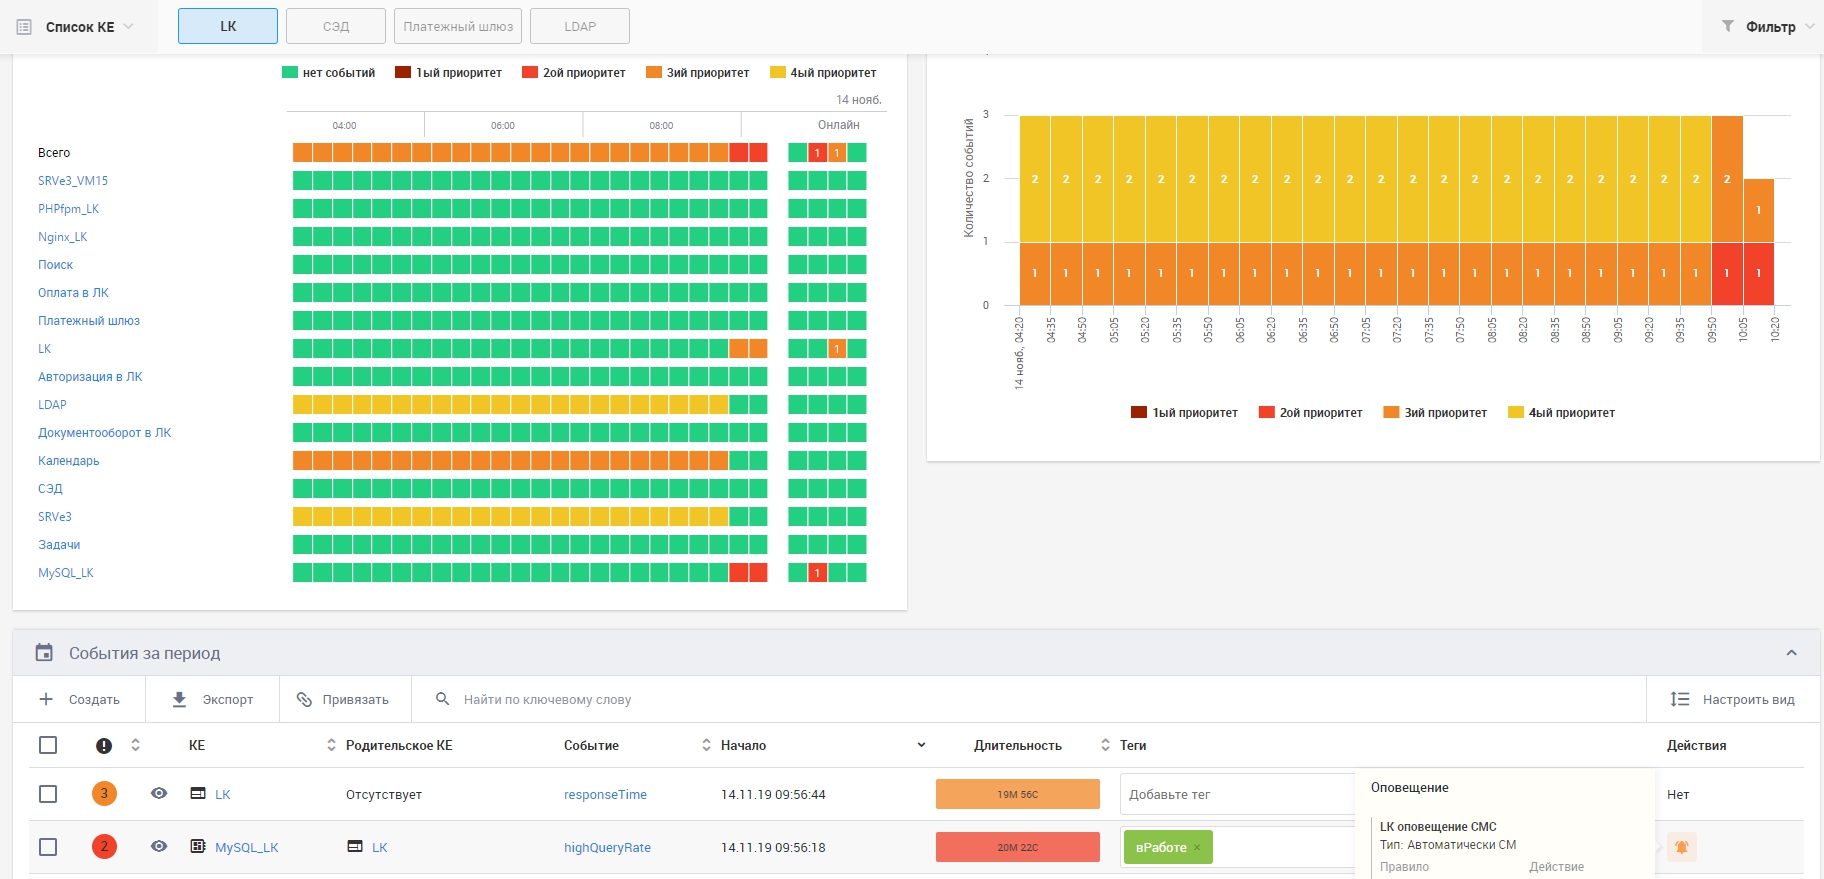
General information about the state of objects under monitoring is displayed on the main view in the form of custom widgets.
The main presentation for the IS "Personal Account"
At the time of taking the screenshot, there is a problem with a large number of queries in the database, because of which the response of the pages in the IS "Personal User Account" has increased. The system informs about this on the screen and sends SMS.
For operational monitoring, the “Operational screen” is used on which there is only one widget with the current list of events (active events and events that closed 15 minutes ago).
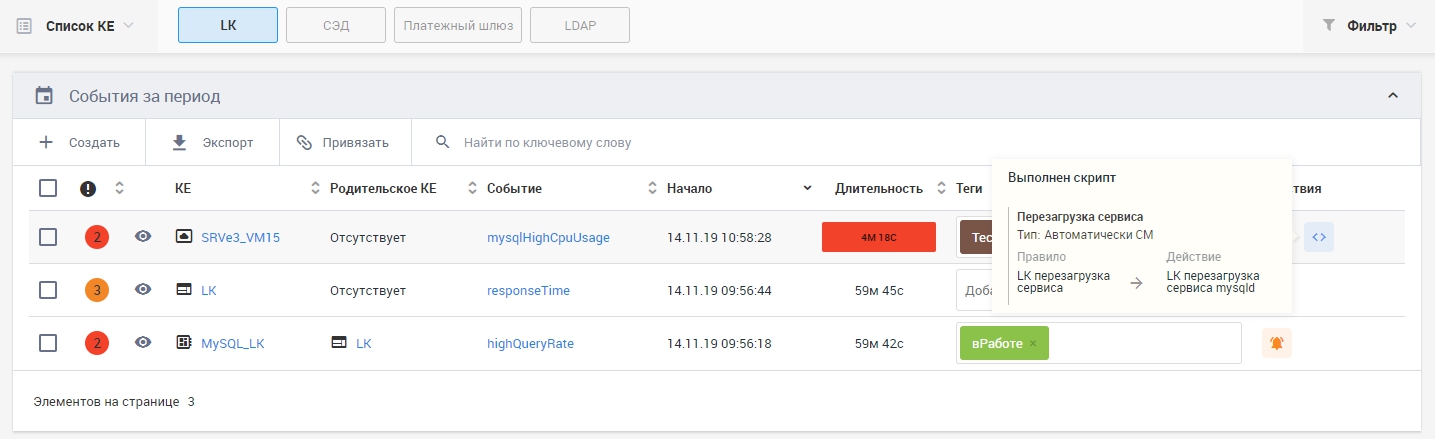
Live Screen Presentation
For testing, I generated a high load on the CPU of the virtual machine using MySQL. The system caught the event and launched the action with a pre-prepared script to restart the mysqld service. If after 15 minutes the event is still active, a reboot will occur.

The service rebooted properly, and I received a notification that everything is OK.
All events in time can be viewed in the "Timeline" section. And if ITSM system is still connected, then it will display the work that is planned according to the KE.
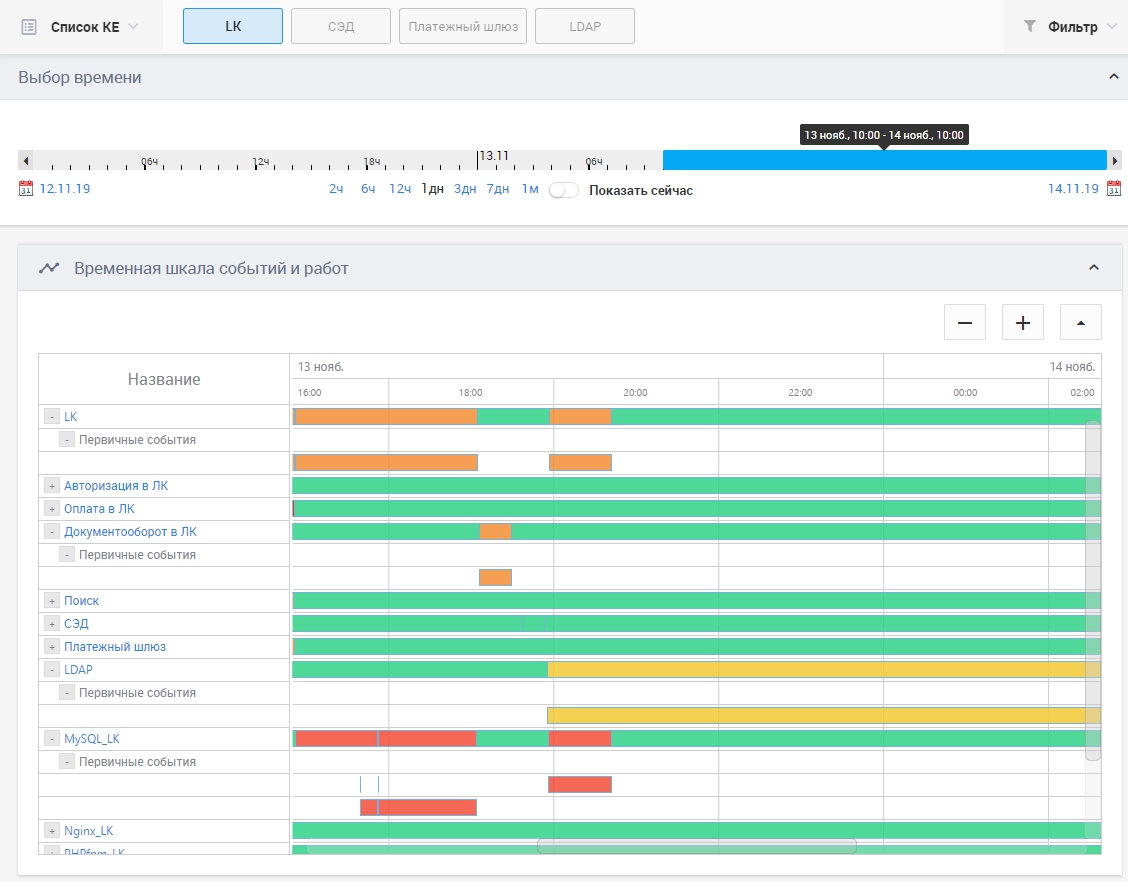
Monitoring Events on the Timeline View
Information on the availability of systems that were installed for monitoring can be found in the “SLA Reports” view.

Report SLA on IP "User’s Personal Account"
For clarity, I generated a report for two weeks excluding from it events with priorities 3 and 4, well, test ones, of course. If you believe the report, the system works fine. The report is exported to PDF and XLS.
Screens show information on filters that are pre-configured by the user. Any event on the screens can be tagged for quick search or filtering.
Licensing
I saved the non-functional, but no less key advantage of MONQ for the end of the article. This is licensing. The vast majority of foreign umbrella monitoring solutions are licensed by the number of devices (usually called per endpoints, per OS Instance or something else) from which events or metrics are processed. Regardless of whether you collect data from the final monitoring objects, or another monitoring system does it. If the collection of metrics is performed using a commercial system, double payment for the same thing is inevitable. MONQ is licensed by the number of connectors used to external systems. That is, if you use two systems, from where you want to collect information - these are two used connectors or two licenses. Thus, from the point of view of “fee for collection”, when using MONQ nothing will change. You pay only the cost of integrating with these systems. In this I see a great advantage and potential.
As I was told, the plans for the development of the system are many improvements that are constantly being introduced. Of the notable innovations in the next six months there will appear: a dashboard constructor, a master for creating synthetic triggers, increased detail when calculating SLA (you will see which factor and how much influenced the object's accessibility) and an external public API.
conclusions
I liked that the guys from the developer company easily make contact, talk and share information, and I liked the system. It still does not have much functionality and it’s hard to directly compare with Splunk or AppDynamics in terms of AIOps, but, clearly, if everything they say comes true, this system will take its rightful place among the market leaders and the Gartner quadrant.
If you want to evaluate the system yourself, get a presentation, watch a demo, or have been looking for an umbrella solution for a long time and are ready for a pilot project, please leave a request in the feedback form on our website.