
Why monitor a workflow system
Since 2005, the CompanyMedia system “manages” the documentation support at VTB Bank. The SDO employs over 60 thousand users who monthly create more than a million new documents. Our servers should function 24 hours a day: at almost any moment in the system there are 2500-3000 people who connect across the country, from Petropavlovsk-Kamchatsky to Kaliningrad. Every second of the LMS operation is 10-15 changes.
In order for the system to clearly fulfill the tasks assigned to it, we have deployed a fault-tolerant infrastructure using proxy servers, query balancing, information protection, full-text search, integration routes and backups. Enormous resources are required to support and administer a project of this magnitude. Administrators around the clock monitor basic information about the operation of servers, loading of RAM, processor time, input-output subsystem, and so on. But, besides this, more subtle analytics are needed:
- Calculation of the time spent on executing business scenarios;
- tracking the dynamics of system performance and load on it;
- Search for deviations in system components from approved non-functional requirements.
11 years after the introduction of the LMS, the issue of proactive response to various kinds of errors arose especially sharply. The bank management realized that working without monitors and the console of the system’s life is to play with fire: the slightest failure in a business system of this level is fraught with millions of losses.
In 2016, we began introducing tools for the rapid identification of problems in the functioning of the LMS, including monitoring real-time parameters of interest to us. Previously, the application monitoring system was deployed and tested within the framework of the InterTrust company infrastructure.
How it all began
Today, a centralized application monitoring system for VTB SDO based on open source software helps prevent most of the errors associated with document management, quickly and accurately classify problems, and quickly respond to any incidents. It includes two subsystems:
- to monitor the IT infrastructure of system services;
- to monitor the occurrence of errors in the operation of the LMS.
It all started with the only free monitoring app. After going through several options, we settled on Zabbix - free software, which was originally written for banking services and equipment. This PHP web-based system, which can store data in MySQL, PostgreSQL, SQLite, or Oracle Database, perfectly fits our needs.
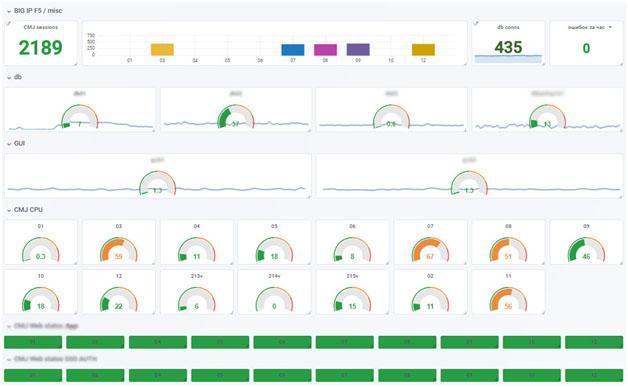
Zabbix runs its agents on each server and collects information on the metrics of interest in real time in a single database. Using the application, it is convenient to collect data on the load on processors and RAM, on the use of the network and other components, check the availability and response of standard services (SMTP or HTTP), execute external programs, and support monitoring via SNMP.
By deploying Zabbix, we set up standard hardware metrics, and at first it was enough. But VTB SDO is constantly developing and growing: in 2016, the number of servers increased noticeably, migration processes appeared, the Bank of Moscow, VTB Capital, VTB24 connected to the system. There are fewer standard metrics, and we taught Zabbix to track information about the presence of queues on each of the volumes connected to the server (from the Zabbix box it reflects only the general disk queue), as well as about the time it takes to process a particular procedure.
In addition, we equipped the system with multiple triggers - the conditions under which a notification is sent to the administrator (message to Telegram, SMS to a phone number or e-mail). Triggers are customizable for any set of parameters. For example, you can specify a certain percentage of free disk space, and the system will notify the administrator when the specified threshold is reached, or inform if any background procedure takes longer than usual.
Java connectivity and data visualization
We significantly expanded the range of data analyzed, but soon this was not enough for effective monitoring. Taking advantage of the fact that CompanyMedia DLS is a Java application, we connected to the Java Virtual Machine through the JMX interface and were able to take Java metrics directly. Moreover, not only the standard Java vital functions, such as the intensity of the GC or Heap consumption, but also specific samples related directly to the executable code of the application.
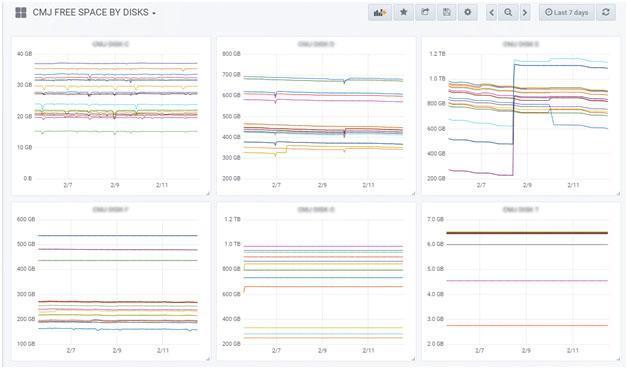
In 2017, about a year after the introduction of the monitoring system, it became clear that for normal work with the colossal data array that is collected in Zabbix, there is not enough visualization - complex screens. The best solution to this problem was again free software - Grafana, a convenient dashboard for metrics that allows you to aggregate all the data on one screen.
Grafana's interactive interface is reminiscent of an OLAP system. The subsystem displays the data that Zabbix receives on a single screen, presenting the information in the form of graphs and charts convenient for analysis. The administrator can easily customize the slices that he needs.
Monitoring and preventive troubleshooting in the LMS system
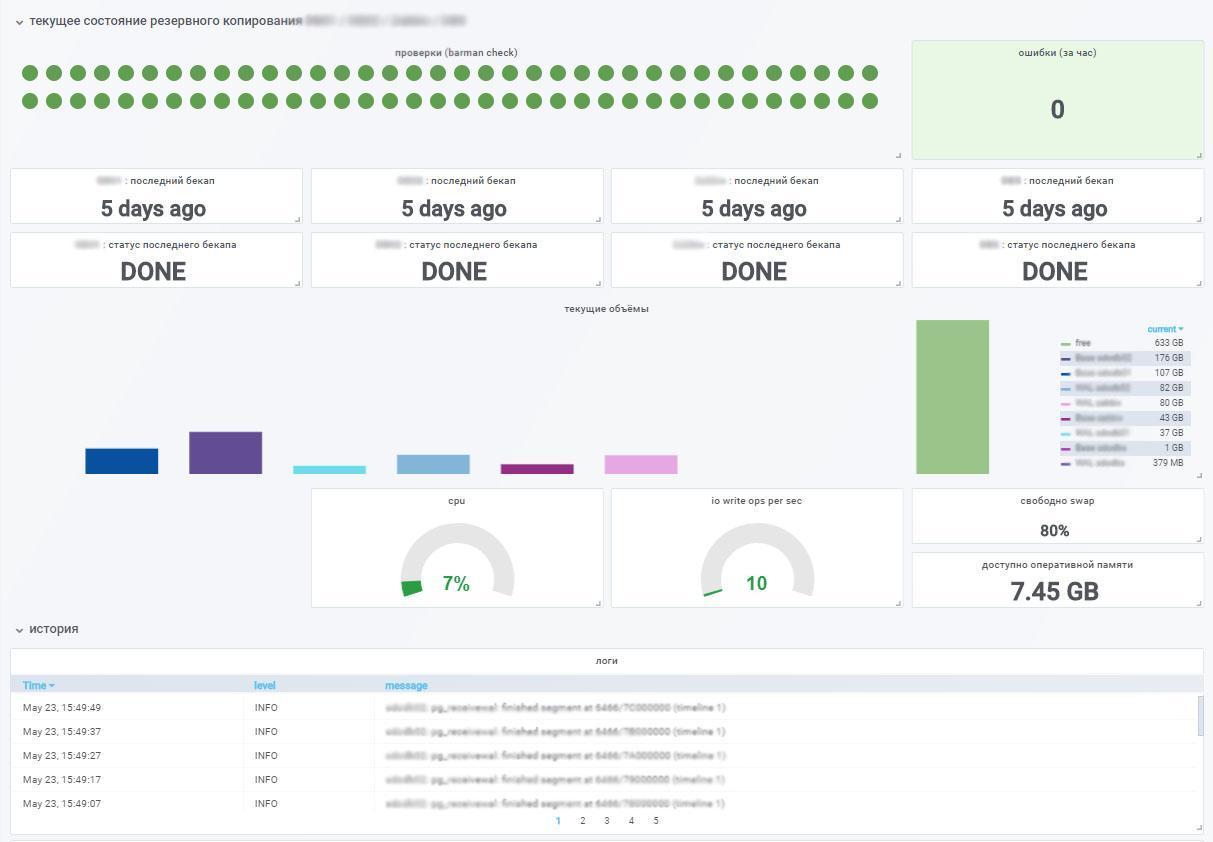
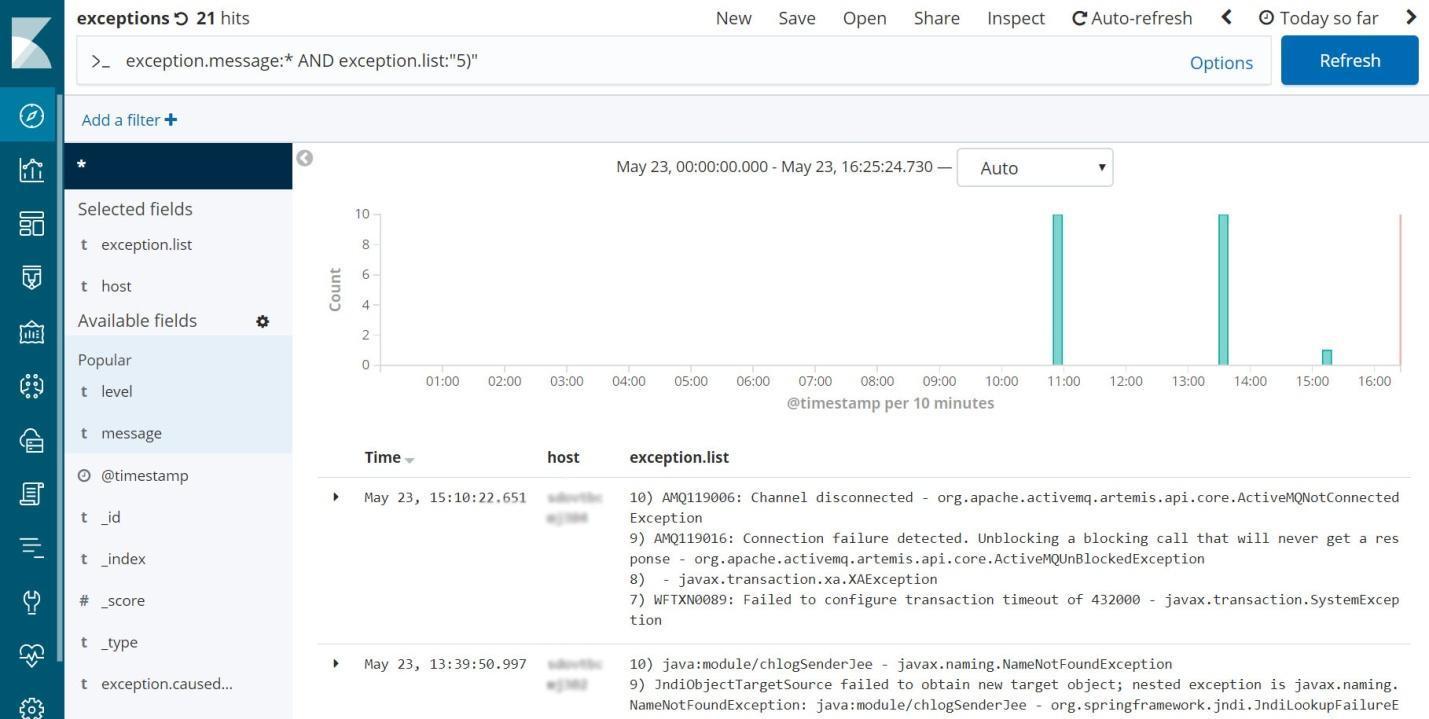
Filtering and analyzing information received during monitoring helps the ELK open source software platform. This opensource product consists of three powerful tools for collecting, storing and analyzing data: Elasticsearch, Logstash and Kibana. The implementation of this subsystem allows, in particular, to see in real time how many errors occurred in the system, on which servers and whether these errors are repeated.
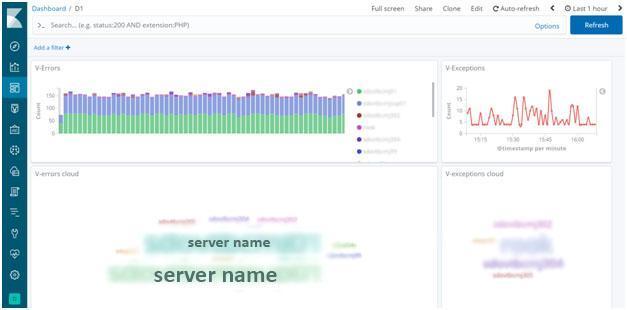
Now the administrator can detect the problem at an early stage, even before the user encounters it. Such proactive monitoring can prevent system malfunctions, timely eliminating errors. In addition, we can understand how the behavior of the system has changed after the update, as well as detect new problems if they arise.
Business Operations Monitoring
In addition to the basic functions of monitoring resource consumption, the system has the ability to analyze and control business operations.
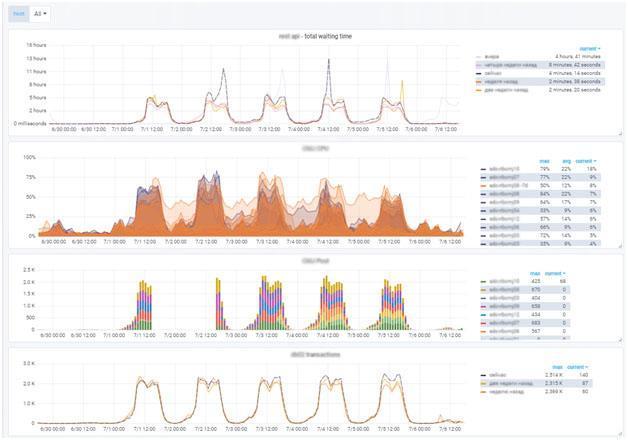
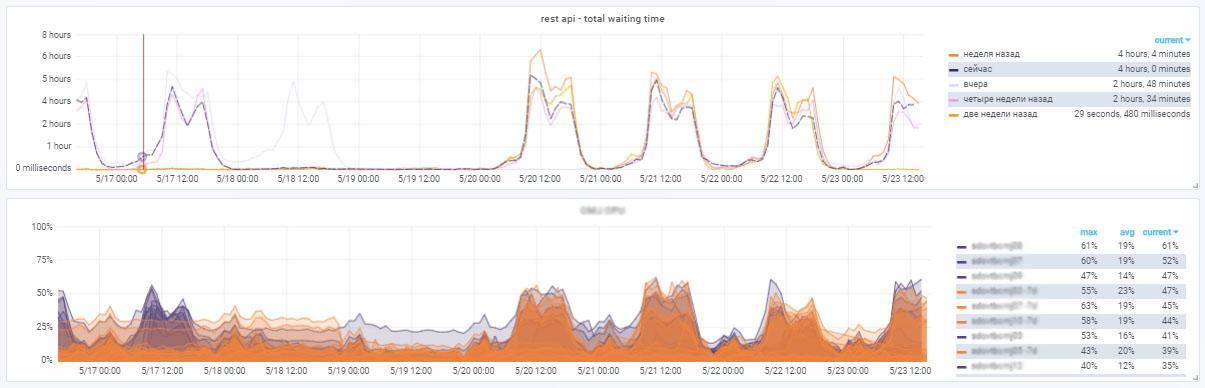
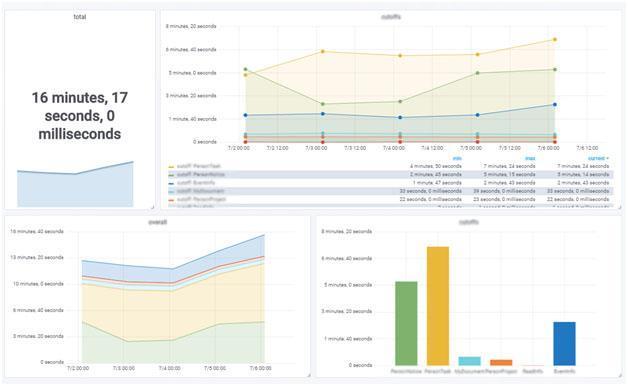
Monitoring the total time of business operations allows you to identify new factors and understand what impact they have on the system.
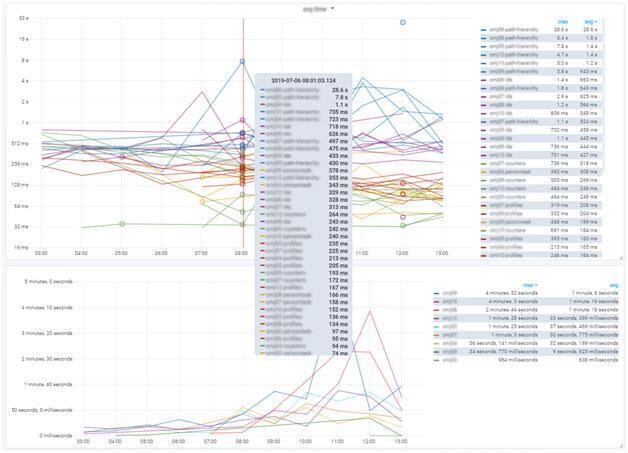
Monitoring the time of execution of requests in the context of each business service makes it possible to detect operations that have a deviation from the norm.
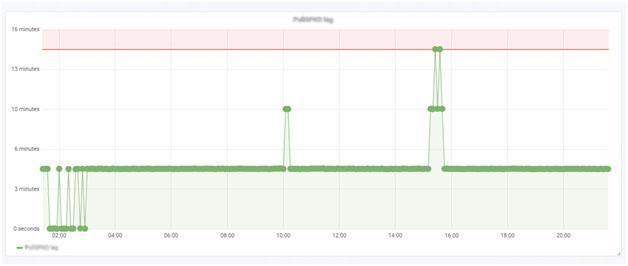
The screenshot above shows an example of monitoring a background task in terms of its deviation from the norm.
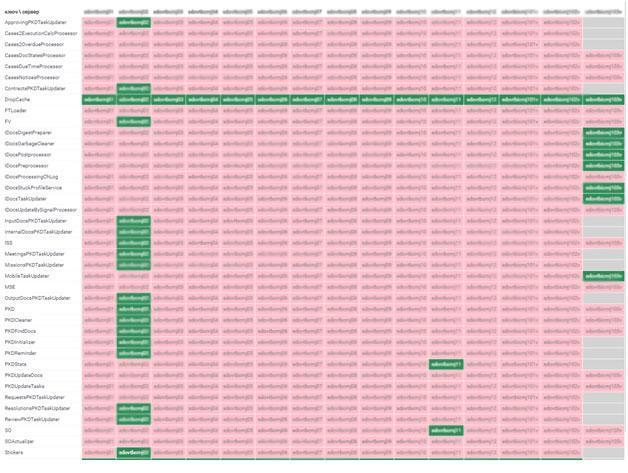
The list of controlled tasks from the point of view of their activity on a specific server allows you to identify errors - including duplication of task execution - across all servers.
It also monitors trends in the execution time of background procedures.
The system grows, develops and helps to cope with problems.
With the implementation of the described system, the monitoring of the operation of DLS servers has been greatly simplified. Nevertheless, various conflicts periodically arise that affect the speed of workflow and cause user complaints. So we realized that it is necessary to control the behavior of the application itself, and not just the servers.
To solve this problem, a balancer was connected to the monitoring system via the API, which works with a cluster of application servers. Thanks to this, the administrator can see how long the server is responsible for each user request.
Data on server response times became available for analysis, which made it possible to associate the slowdown of the DLS with the processes occurring on the server. An interesting situation was revealed, in particular: the server is slow, although at this moment it is not loaded. By analyzing the anomaly, we found deviations in the operation of the Garbage Collector Java. In the end, it turned out that it was the incorrect operation of this service that led to this situation. Taking control of the Garbage Collector Java, we completely fixed the problem.
This is how free software helps to develop and grow a document management system in the banking sector. We touched on only the main issues regarding the monitoring system of VTB LMS. If you are interested in the details - ask in the comments, we will be happy to share our experience with you.