When Tim Berners-Lee created the World Wide Web (WWW) in 1989, he had no idea where this would lead. Over the 30 years since its inception, a global revolution has occurred - from the network used exclusively by scientists to the network used by most people with intelligence indicators below the average. No, these people do not decide, no, they do not set trends. They think they are asking, spending millions of human years on Instagram, Facebook and other social networks. Sometimes it seems that the future happens according to the script of the 2005 film “Idiocracy” , where everything that people created to make life easier and mass access ultimately led to large-scale degradation and the great trash avalanche of 2505, formed by an endless consumer approach, was the result of this progress.

The global IT industry is working in the direction of "suggestion", determining what will be popular, analyzing Big Data and directing the thoughts of Internet users. And to deny the fact that it is thanks to the average users that many areas have developed, as well as the technology of data transfer in general, is impossible. However, what% of the total population of the Earth is involved in IT or science? This is a difficult question to which we cannot give a definite answer, since today IT is integrated into almost all aspects of human activity, it made life easier and made highly specialized specialists even more highly specialized. But today we can analyze the trends in the development of the Internet network, conduct an analysis and discuss certain facts.
And the facts are that according to Sandvine’s report:
- video accounts for approximately 58% of total Internet traffic;
- the share of encrypted Internet traffic exceeded 50% and continues to grow (users began to think about security and privacy and bypassing locks, which are becoming more);
- the gaming industry makes a significant contribution to global traffic, especially mobile app traffic
- file sharing is not dead, despite the fact that users have access to more content than ever, access to this information is still not well organized, while maintaining the potential for piracy
- live broadcasts noticeably affect the network, for example, the World Cup or Super Bowl generate more peak traffic than all of Youtube and other streaming services at ordinary times.
What problems will we talk about?
Historically, the main traffic generators were Netflix, YouTube, Facebook and BitTorrent, to this day they remain major players, but the "landscape" of the Internet network has varied significantly, regional differences are especially significant, creating new principles for network operators in some cases, in particular " all Internet traffic is local. ” In particular, “Super Bowls” and other local events lead to new difficulties - networks should be able to “digest” these peaks so that the quality of access to other services does not deteriorate significantly.
The share of encrypted traffic exceeded 50%, which, although it does not provide users with full or significant security, it reduces the risk of interception of their data and also increases privacy when using public access points. However, this in turn creates a huge problem for providers. If earlier it was possible to analyze the components of traffic and apply QoS (Quality of Service) to them depending on the type of traffic, now that all users are starting to use a VPN and encrypt their data when necessary and not necessary, it is becoming more and more difficult to prioritize traffic. Since it is impossible to say unequivocally where the voice or video traffic is, which is sensitive to delays, and which traffic can “wait” and be served with lower priority. All traffic becomes priority.
We will also talk a bit about the complexities of modern file sharing. While Youtube and Netflix are one of the most significant sources of streaming video traffic, more and more disparate sites appear on the market, providing certain types of streaming video services, access to which is limited, including at the level of individual states, which again leads to the need for P2P exchange. Not everyone can afford a subscription to certain types of services, both financially and legally.
More videos than ever
First of all, you need to split the traffic. Traffic can be either outgoing (the subscriber downloads data to the network) or incoming (the subscriber downloads data from the network or watches video from the network, if we talk about video) regarding the user. But even when the user watches, “requests” are created for viewing this or that content and answers about successful delivery, which also occupy some outgoing bandwidth.
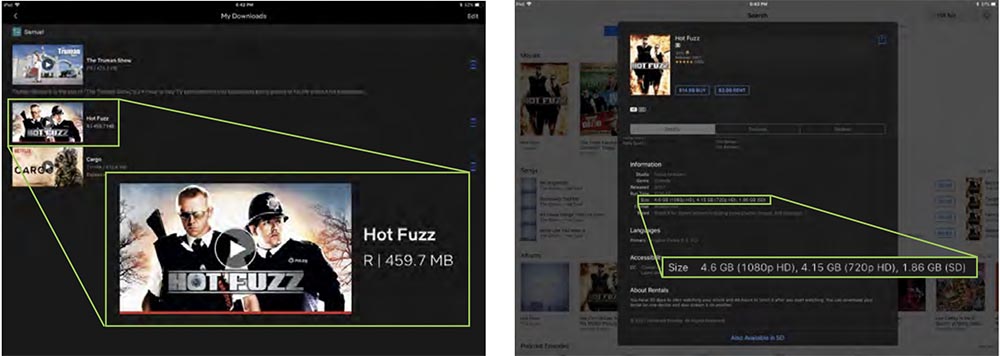
It should be noted that video transmitted to users, due to the encoding process, consumes much less traffic than RAW files that users upload to the network for their subsequent processing by codecs and streaming. It's amazing how effective the coding used by Netflix is. For example, a two-hour movie consumed only 459 MB of incoming traffic, while on iTunes the same movie is offered for download with various bitrate options - 4.6 GB for 1080, 4.15 GB for 720, and 1.86 GB for SD, and rival Amazon Prime has the following encoding options - from 579 MB in 1 hour 29 minutes to 1.5 GB in 2 hours 7 minutes, which is significantly inferior to Netflix.
Thus, if Netflix did not encode the video as well as it does, the share of Internet traffic generated by this resource would grow by 2-3 times, with the same traffic. It is also worth noting that many mobile operators offer "unlimited" access to online video services when viewed in low resolutions, which saves traffic not only for Netflix, but also for other services.
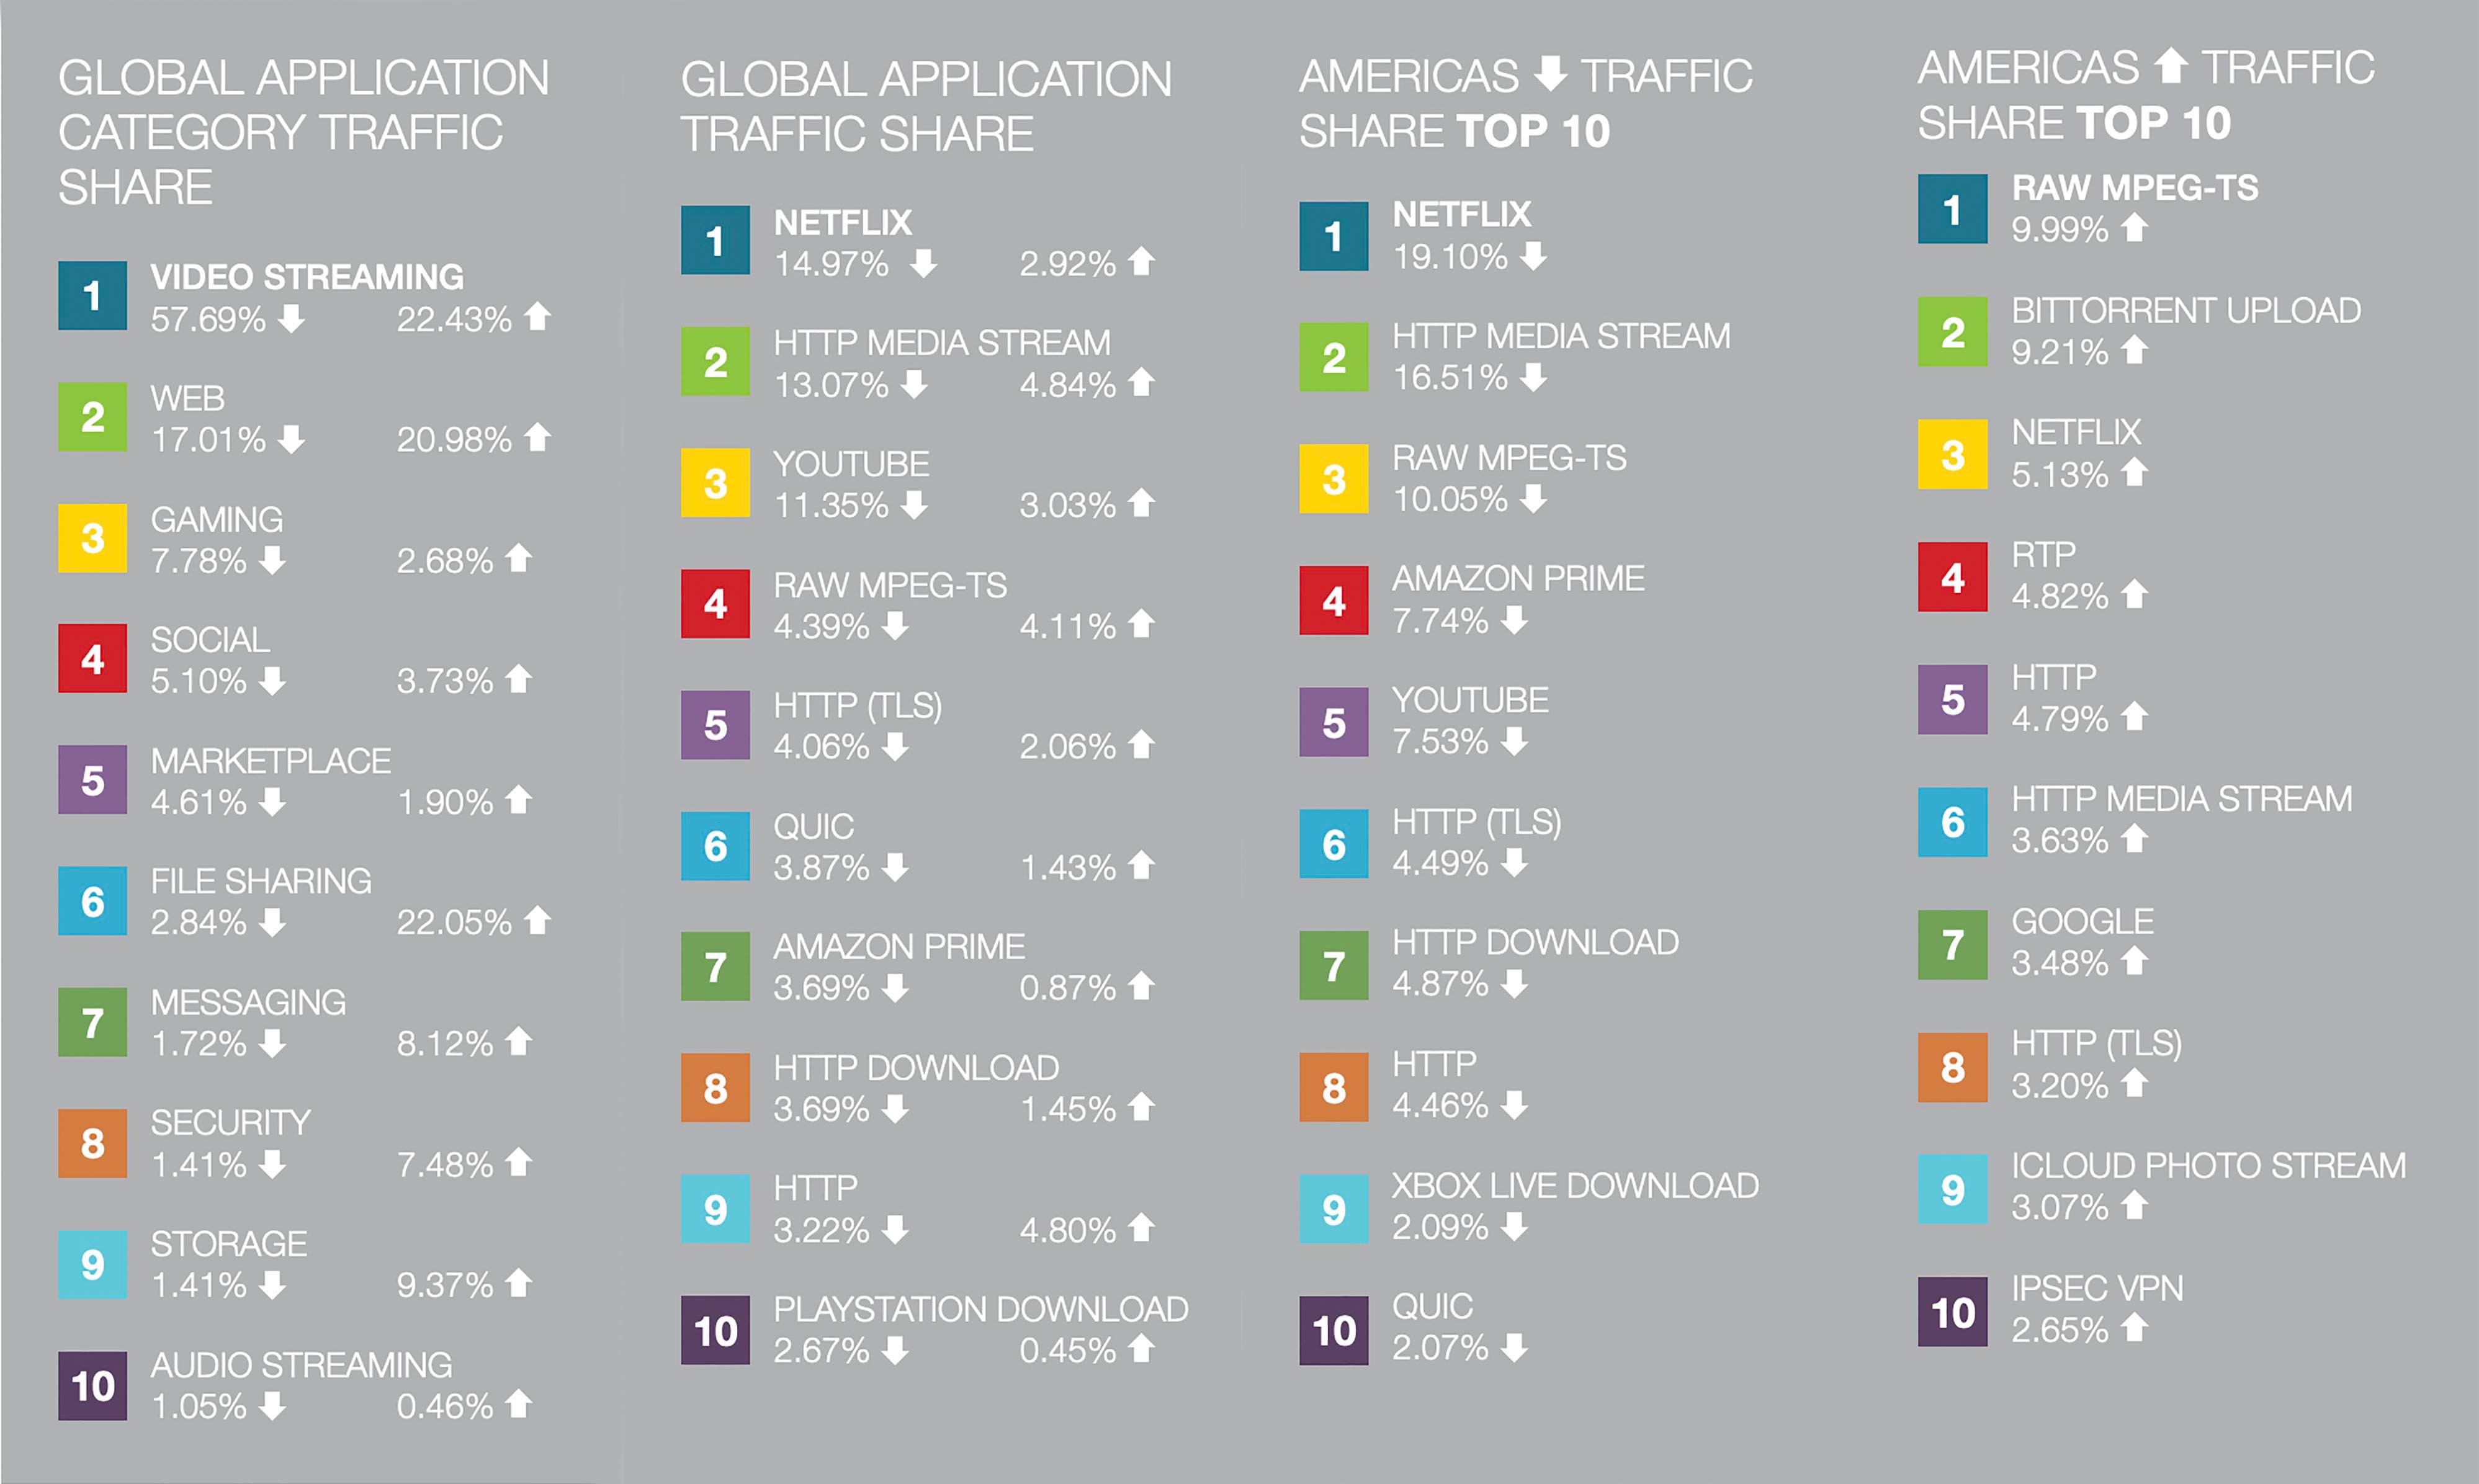
Many home networks and local providers offer Direct TV services, and other P2P streaming services. Their traffic is also taken into account in reports. At the moment, you can see the distribution of traffic between key streaming services in the figure below.
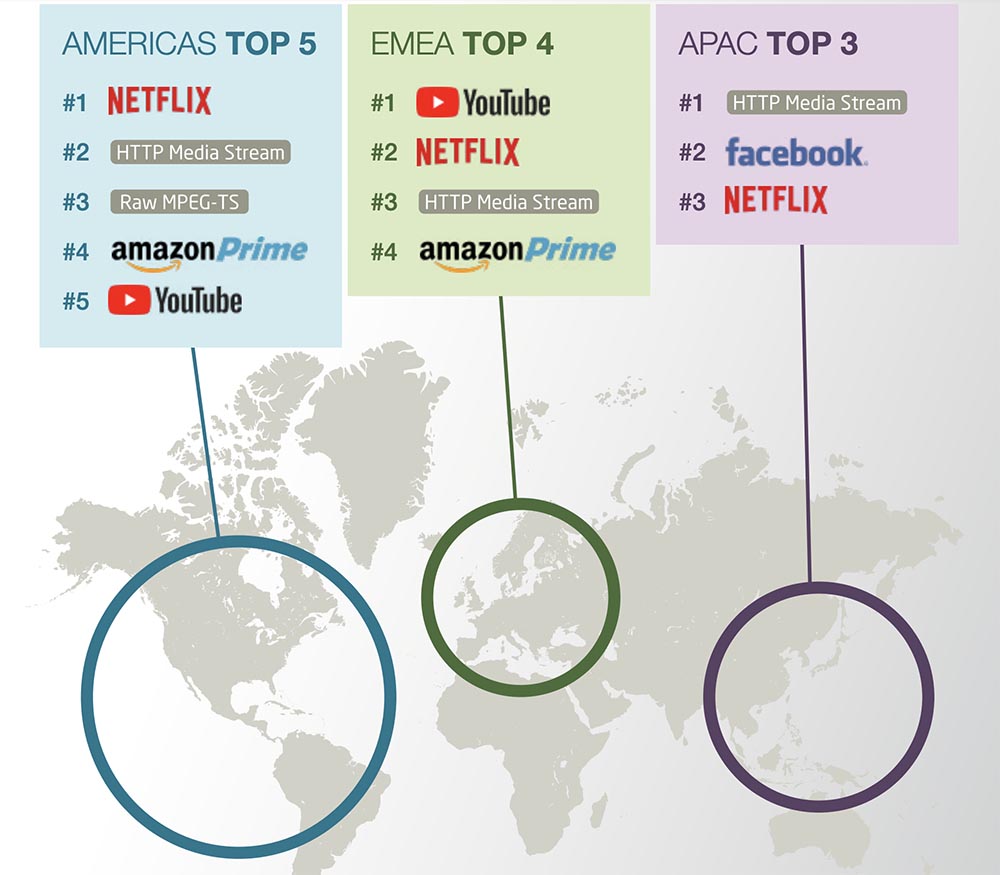
However, this year Netflix moved from 1st place in the North American region to second. In total, according to the latest Sandvine report, the share of video was 60.6% of the total Internet traffic in the direction of downloading to users (incoming traffic), which is 2.9% more than in 2018. Incoming HTTP traffic (web) took second place - 13.1% (3.8% less than a year ago), then games with 8.0%, social networks with 6.1% and file sharing with 4.2 %
Traffic among the ten most popular applications in the world was distributed as follows: streaming multimedia HTTP (12.8%); Netflix (12.6%); YouTube (8.7%); IPTV, access to which is provided by Internet providers (7.2%); HTTP traffic from file uploads (4.5%); HTTP TLS (4.4%); HTTP (3.0%); Facebook (3.0%); game downloads for the PlayStation (2.8%); BitTorrent (2.4%).
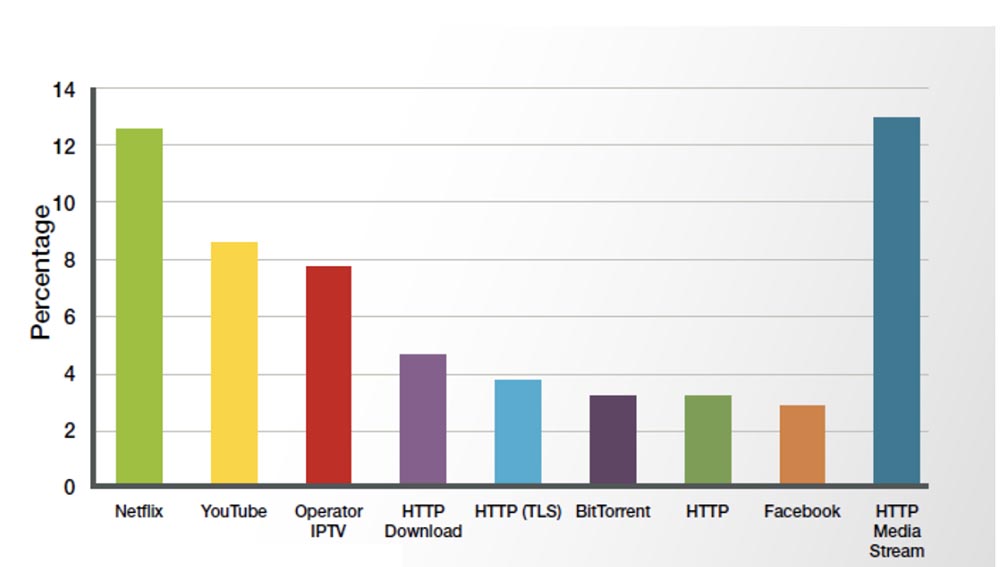
Interestingly, according to last year's data, the picture was as follows:
As you can see, streaming takes a leading position. Along with downloading (watching videos from the network), the video is actively downloaded to the network and distributed, including using the BitTorrent network, the download volume of which exceeds the volume of Netflix. However, of course, most users view or distribute content, but not produce it. Less than 1% of all Youtube users produce content for this project. Moreover, in our modern world, this is a lot of work related to the observance of copyright and sometimes accompanying a high-quality video sequence with an equally high-quality sound is a problem.
That is why, along with really useful content, the network is filled with stupid Youtube and Instagram channels, which destroy consciousness and even more stupid people. Moreover, the dumber the content, the more audience it can attract. People are pleased to realize that they are not so dumb and therefore the "bar" of content falls. After all, if the predominant part of the population is “stupid”, what content will they want to see? What decisions should be made? "Idiocracy" is becoming more and more like a documentary movie than a dumb comedy, and sometimes, watching a movie after almost 15 years, it is not at all funny.

However, not everything is so sad. Perhaps we still do not evolve to the point where we will use water only for cleaning toilets, and in order to quench our thirst, we will develop a special thirst quencher with electrolytes. Perhaps the show “About my balls” will lose popularity.


Sometimes technologies are also used for the good, and not just for dulling the population. And a good example here may be one of the streaming projects that will demonstrate to us that streaming is not only stupid videos, but also health.
So, relatively recently, the Peloton project appeared and began to gain popularity in the United States, which connects exercise bikes to the network and broadcasts them in HD-quality 1080p to a 22-inch steering wheel-mounted display, which creates the impression of a ride, including on rough terrain, simulating ups and downs.
Why do we consider them in the streaming section? A year ago, they became very popular in the USA, and had the following indicators:
18,000 online members use at peak;
~ 144 Gbps bandwidth consumed (8 Mbps per stream);
~ 14.4 TB of traffic (800 MB on average per each).
In general, every day the project is used by:
56,000 participants;
~ 45 TB of traffic is consumed.
Can I share the Game of Thrones?
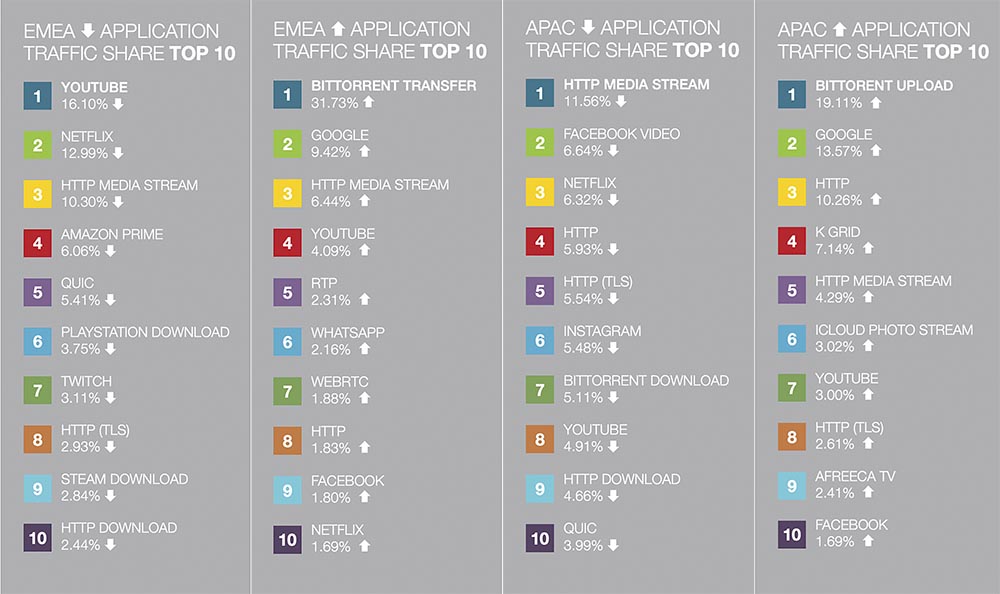
In EMEA countries (Europe, the Middle East and Africa) Bittorent occupies more than 30% of the traffic generated by users, and when, for example, a new series is released on HBO, residents of these countries are happy to share content. And although Europe is actively fighting the illegal distribution of content, BitTorrent traffic is still leading. As soon as one site closes, another immediately appears and again and again and again the game of whack-a-mole. Please note that statistics are collected after the end of the “Game of Thrones” screenings, so the numbers may be lower than before. Google ranks second in EMEA. RTP, WhatsApp and WebRTC are all among the top ten messengers, and interestingly, the popularity of WhatsApp does not always correlate with Facebook, although the latter is the parent company for this project.
Social Media Leads for APAC Users
Social networks for the first time occupy leading positions for the countries of APAC (Asia-Pacific region) in 2018. Facebook Video, taking second place, and Instagram are crowding out other projects for the region from TOP10. There is nothing more important for these people than social networks. They will be the leaders here for a long time. Also interesting is the fact that the HTTP Media Stream service of local providers has led to a reduction in the audience on Youtube. Netflix also has an impact, due to the fact that not all providers are able to provide sufficient stream quality by encoding movies in low quality, Netflix makes them available to those who previously did not have the technical ability to watch online. Another interesting point is that there is more unencrypted HTTP traffic in APAC than anywhere else, since many applications use protocols without SSL or TLS, which negatively affects user security. Like in EMEA countries, BitTorrent is also included in TOP10, as file sharing allows people to access content when there is no money to pay for access, or the Internet is not good enough. However, the main difference between the APAC countries is the huge fragmentation of the applications that users use, currently more than 4,000 digital signatures of popular video services are registered.
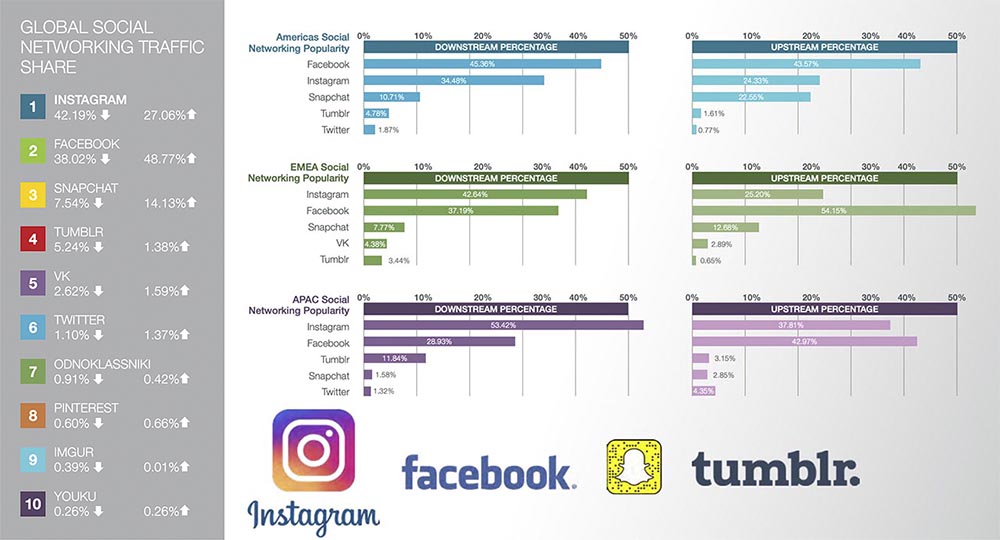
The rating of social networks is always interesting, primarily because it differs significantly depending on the selected region. Youtube was not included in the rating, which can also be considered a kind of social network, since it would significantly distort the results. Interestingly, the number of users does not always correlate with the traffic that these users generate, it is worth considering. By the way, some users of social networks are not, as such, users of the Internet, since most of their time is spent exclusively in the application of a particular social network. The Internet itself (with search engines, websites and many other applications), it turns out they simply do not need.
Facebook and Instagram took first places, which is not surprising (they are already, in fact, one company), but the fact that Snapchat came out in third place is very interesting. Along with them, a significant% of the global have such regional networks as VK, Odnoklassniki and Yuku. Finally, Twitter, Pinterest and Imgur - also hit the TOP, but LiveJournal, beloved by many ZhZshechki, is already not in the ranking :(
Game traffic increased at times
An interesting fact is that not only mobile gaming applications contribute. If 15 years ago the game could well fit on a CD with a capacity of 700 MB, well, a maximum of DVD (4.7 GB), today games can sometimes not fit on every Blu-ray. And although back in 2010 Blu-ray disks of increased storage density were invented - up to 100 GB , not every device is able to work with them. With the increasing speed of the Internet network, a new concept was invented - to store games online and “install” them through the Internet. How did this affect the network? Not hard to imagine.
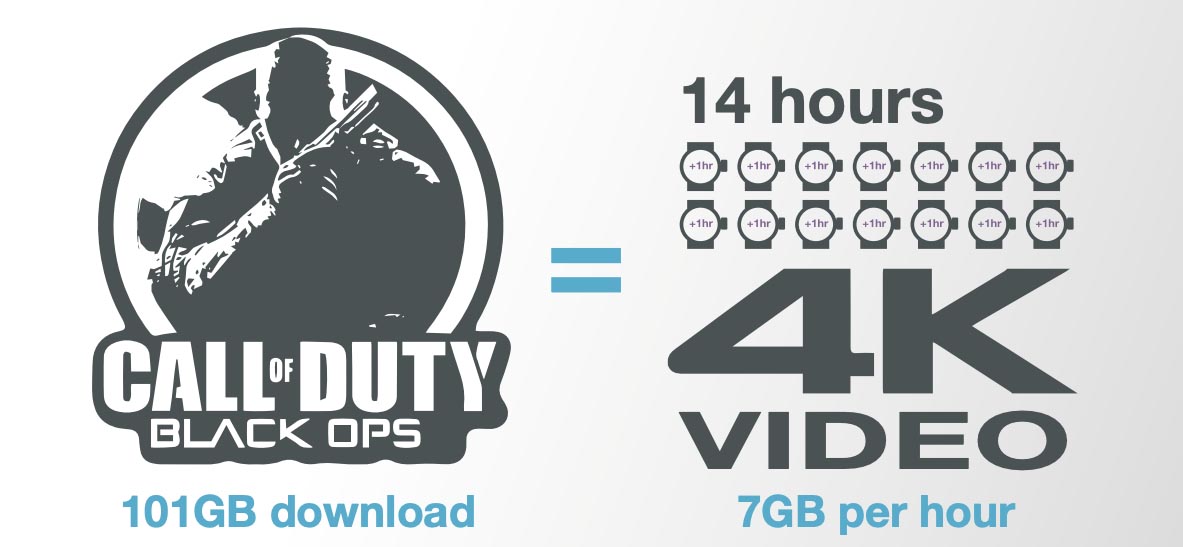
The popular Call of Duty game now occupies 101 GB of quota, which is equivalent to 14 hours of watching video in 4K quality. What about the distribution of the audience?
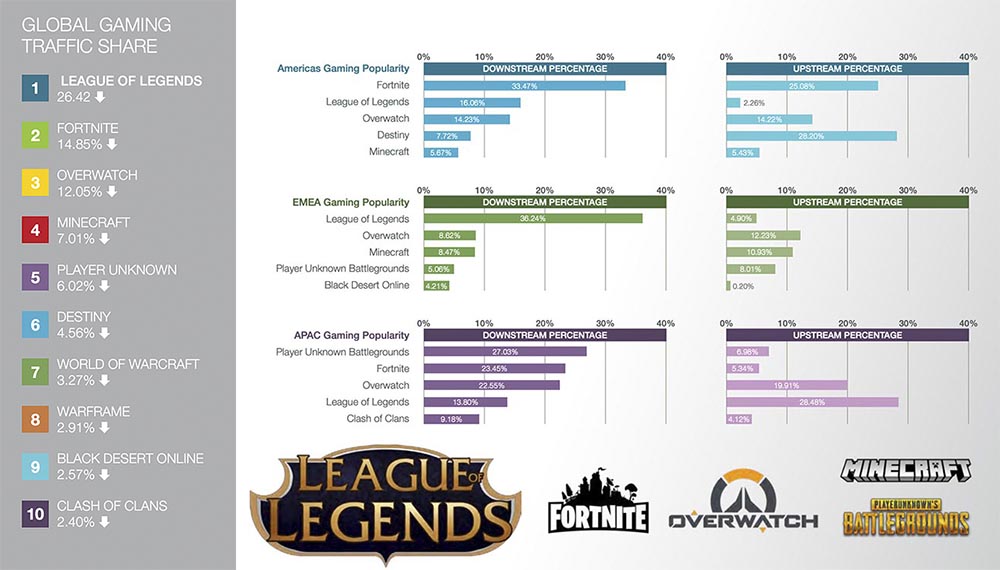
The League of Legends game accounts for more than half of all game connections in the world - 51.53%. Nevertheless, Fortnite is less leading in the USA, and Unknown BattleGrounds (PUBG) in the Asian region, APAC countries. It is worth noting that this rating was built on individual games, and not on the most popular games from Steam, PSN, or Xbox Live, where the distribution is somewhat different.
2018 World Cup
In June 2018, the World Cup was held in Russia and the whole world watched. In the past, such events consumed very little traffic, so little that bursts were not even recorded against the rest of the consumption. But in 2018, the situation has changed. In Europe, there has been a significant surge in consumption, both in mobile and in wired networks. When some home team played, the traffic that users of this country consumed while watching football exceeded the traffic consumption from Youtube and other streaming services. Interestingly, during the breaks, traffic from Youtube increased, as viewers wanted to watch replays of key moments of the game, but immediately decreased as soon as the second half began. Then, after the match, traffic of social networks grew, where there was an active discussion.
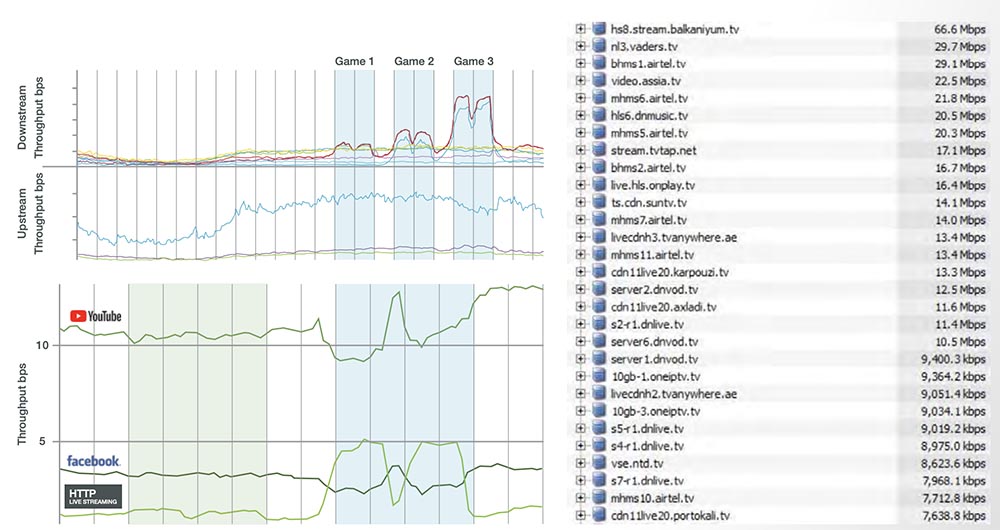
Interestingly, about 40% of all traffic is pirated streaming channels, which also earned on this event. So, if you are a provider, be prepared for the year 2022, when the next event will be broadcast from Qatar.
When a noun becomes a verb
We always talk about Google as the most popular site on the web. More than 40.2% of all connections in APAC countries are accounted for by the services of this company. However, let's not put everything in one “basket” and consider the distribution of traffic between Google services in more detail.
14.75% are connections that cannot be attributed to any particular service, this data also includes search queries. YouTube occupies a share of 12.72% and here, perhaps, no additional explanation is required. Google Cloud Messaging (Firebase Cloud Messaging now) is used by both the Chrome browser and Android devices to send messages to various applications. DoubleClick with a share of 1.96% is used to display ads, you may not be familiar with this service directly, but you definitely saw the ads. Crashlytics with a share of 1.04% generates crash reports, logs applications for subsequent statistical analysis. And finally, the Gmail mail service with a share of 0.49%, not everyone uses Google mail, although it is incredibly convenient!
As for Google Docs (0.37%) - a document management service, Google Play (0.28%) - a service for downloading and distributing applications for Android, Google Proxy (0.08%) - a proxy compression service for Google Chrome, Google Allo (0.06%) - messaging service, Google Drive (0.05%) for file storage and synchronization, Google Maps (0.03%) - Google maps and navigation, Google Safe Browsing (0, 02%) - a service for viewing sites that cannot be trusted, then their share is much lower.
What can I say about applications that occupy less than 0.01% for countries in the APAC region - Google Play Music, Google AD, Google Duo, Google Earth, Google Music Manager, Google Hangouts, Google Sync, Google Goggles.
Nevertheless, the total figure of 40% of the market is impressive. Just a few other metrics in the reports are close to this result for a particular selected region. The success of Google with Android in the APAC region is primarily due to the fact that most users there choose a cheap Android phone than an expensive iPhone, and therefore the position will only grow. However, the development of the Samsung premium segment, when phones are ahead of the iPhone in functionality, can also play a role.
Outbound traffic and the role of BitTorrent, Afreeca TV
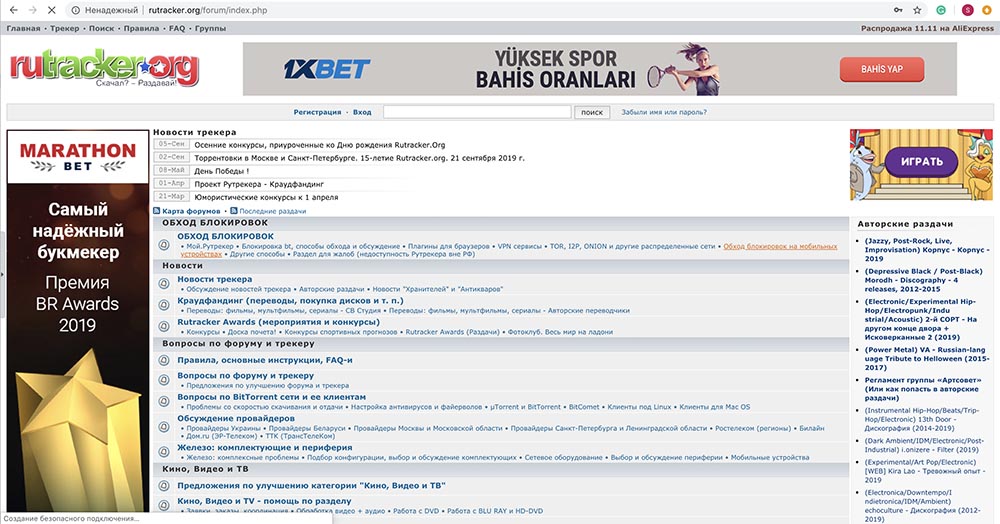
As mentioned above, BitTorrent still occupies a significant share of network traffic. Who is not familiar with this protocol - it allows you to download files in parts from the closest computers of other users, pause the download at any time and distribute the file to other users even when you have not completely downloaded it yet (already downloaded parts). However, after downloading the file, users continue to distribute it to other users, since most of them have “unlimited” Internet packages. Previously, when the traffic was expensive, users limited the speed of distribution, or even turned off the distribution completely, as a result of which the concept of ratings was introduced on some trackers and when the rating fell below a certain level it was impossible to download new files. This provided the ability to distribute files on the network. Especially popular distributions were present on the computers of thousands of users and sometimes the download speed was limited only by the speed of your channel.
It is also worth noting that if among the EMEA countries BitTorrent traffic is not intra-network or intra-country, then in APAC countries there is still a similar distribution. Since traffic to the "world" is still expensive due to the high cost of peer-to-peer inclusions, while traffic within the country can be extremely cheap, and the speed at the same time is as fast as possible.
Today, outgoing traffic is generated not only by bittorrent, but also by Google, when there is a synchronization of files or photos on Google Drive, iPhone and Mac with iCloud service and many other cloud services for storing backup copies of data. Of course, the outgoing traffic generator will be Instagram, Youtube, VK, Facebook, as well as other social networks and resources where users upload their data.
There are more and more "local" networks and applications, for example, the Korean offer of K Grid in Korea has a significant% of all traffic, but traffic almost tends to 0 outside Korea for this application.
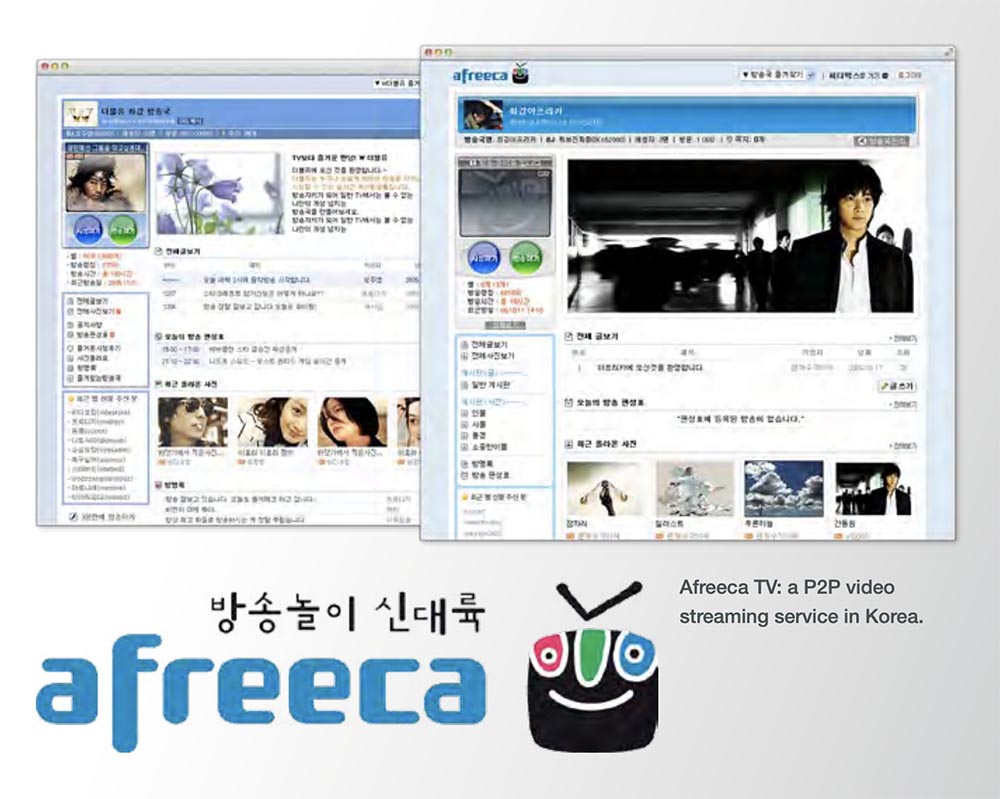
Streaming traffic also occupies a significant part. HTTP Media Stream, YouTube, and
Afreeca TV - all TOP 10. Afreeca TV - perhaps a new term for you, it means "Any
FREE broadCAsting ”, that is, any free stream and uses P2P technology so that users can share streams, similar to BitTorrent, only for streams. Still very popular are broadcasts of video games, the same StarCraft, which in some countries, the same Korea, competes with local television Twitch.
It is interesting to note that their social networks are spread in APAC countries, as a result of which Instagram and Facebook are outside the TOP 10 list.
Video streaming or streaming video, adult content production studios are out of work, the film industry suffers "losses"
In addition to Youtube, a host of services with streaming video of various subjects appeared, the same segment for adults, where webcams are common, usually does not appear directly in reports. Yes, Netflix appeared in the reports of 2018 as one of the main traffic generators in each of the regions.

According to various estimates, about 56% of all traffic on the Internet is video traffic. But no report, unfortunately, does not indicate in% how much of this traffic is traffic for adults. Believe me, a significant part. It’s just that in many countries this kind of content is prohibited, and not consolidated within the same service, to say the same, several years ago the same xvideos generated over 1 Tbit / s, which is comparable to the generation of a rather large data center. Precisely because for the time being it is not possible to conduct an accurate assessment. However, the segment is becoming so significant that with the advent of specialized sites that allow you to organize personal streams of a frank nature, and not just distribute videos on the Internet, everyone can become a “studio” and produce content and make money on it, which in particular increases the income of the population in countries from poorer regions. You can get more information for thought by reading the material of the "Editorial" channel on Youtube .
It is also worth remembering about piracy. Of course, its volumes significantly decreased in the overall share of traffic than a decade ago, when online movie sites were popular and sites with paid subscriptions such as Netflix were not yet in vogue. Nevertheless, one of the services reached TOP10, namely Openload took the 8th place in this rating, ahead of Hulu, HBO Go and BBC iPlayer, which hardly makes movie studios happier. It seems that European legislators would not like it, but people’s desire not to eradicate balls.
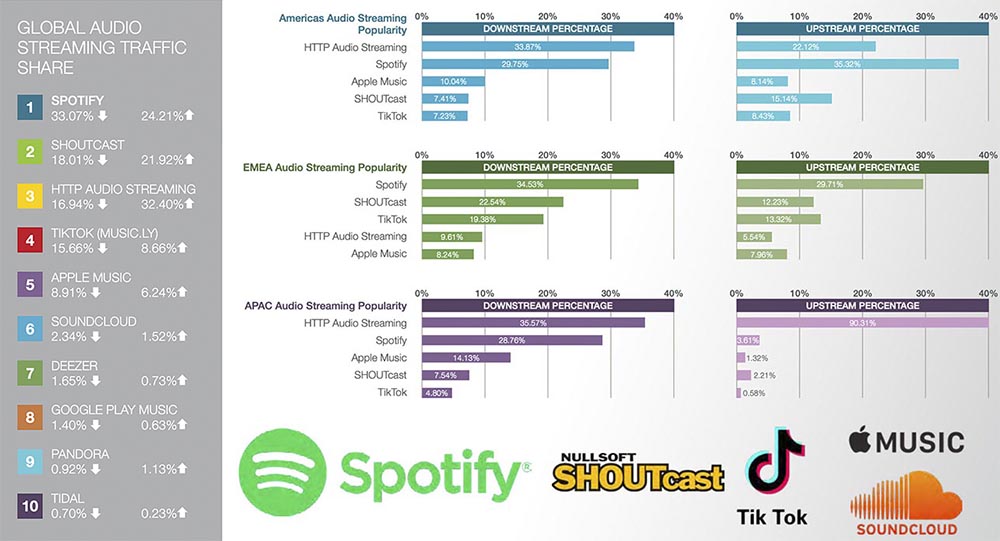
And what about audio streaming, have we completely forgotten about it?
In recent years, audio streaming has made a significant leap forward. The Buzz , , - , . VPN, - . , -.
— . , Spotify, Apple Music, Google Play Music .
YouTube Vimeo, -, , TOP10 - . , , .
VoIP
, , , «» , Voice over IP, «» IP.
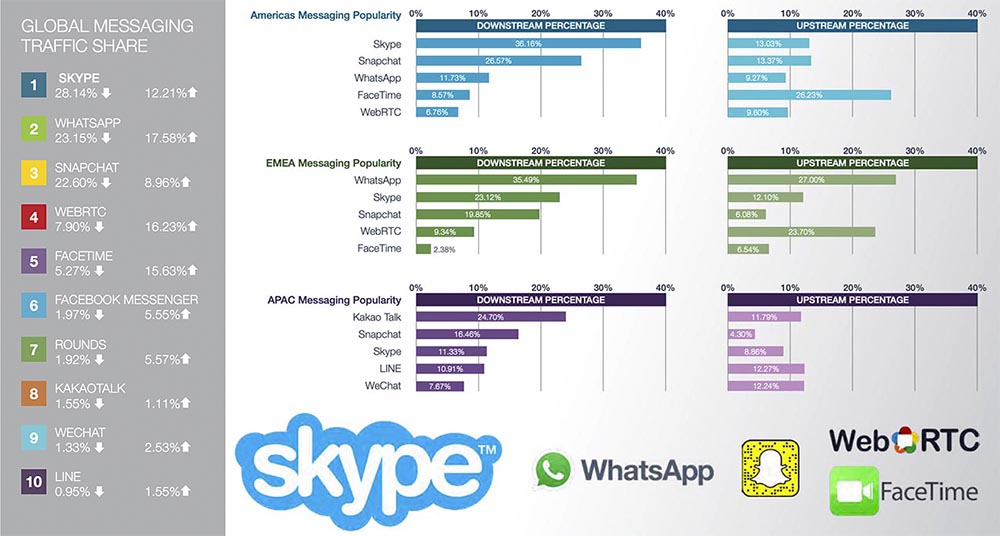
, Sandvine , , , -, , VoIP -?
Skype, WhatsApp, Snapchat FaceTime , , , , -. WebRTC , - , Google Hangouts Facebook Messenger, , GoTo Meeting, Amazon Chime, -.
Rounds, Line, WeChat KakaoTalk , , TOP- , , , , .
, ?
«» , , , , « » . , -, , , IT-. . , , . , , .
«-» , , , , , , , .
In the next part, we will pay attention to an important component of global traffic - mobile, learn more about the interests of people from different regions, and also discuss what impact the Internet network has on life. Perhaps “Idiocracy” is still a comedy film, not our reality.

A bit of advertising :)
Thank you for staying with us. Do you like our articles? Want to see more interesting materials? Support us by placing an order or recommending it to your friends, cloud VPS for developers from $ 4.99 , a 30% discount for Habr users on the unique entry-level server analog that we invented for you: The whole truth about VPS (KVM) E5-2650 v4 (6 Cores) 10GB DDR4 240GB SSD 1Gbps from $ 20 or how to share a server? (options are available with RAID1 and RAID10, up to 24 cores and up to 40GB DDR4).
Dell R730xd 2 times cheaper? Only we have 2 x Intel TetraDeca-Core Xeon 2x E5-2697v3 2.6GHz 14C 64GB DDR4 4x960GB SSD 1Gbps 100 TV from $ 199 in the Netherlands! Dell R420 - 2x E5-2430 2.2Ghz 6C 128GB DDR3 2x960GB SSD 1Gbps 100TB - from $ 99! Read about How to Build Infrastructure Bldg. class c using Dell R730xd E5-2650 v4 servers costing 9,000 euros for a penny?