In this post I want to return to the continuation of the design of the machine for conducting physical and mechanical tests.
Let me remind you (the first part ) that this machine (prototype) is a cantilever type and can conduct tensile and compression tests in two zones - upper and lower.
In addition to the first article about kinematics and assembly, embossed grips with wave sponges, printed on a 3D printer, were added to the design, the gearbox of the car window lifter acted as a drive. Since we are talking about the power unit, this gear motor is rather weak, especially at low revs. Perhaps in the next modifications of the project I will install a gear motor with a stepper motor.
Now I will tell about the software. I must say right away that the programmer from me is so-so, not everything turned out as I wanted, the program is still very raw, although it works.
The program was written in the Delphi programming environment. I’d already change the design at this stage, since there are uncomfortable moments, but for now I will not do this, I want to work out the main algorithm first.
Electronics is based on an arduino controller and two additional modules. The firmware in it is uploaded quite simple, namely the collection of data from two sensors, the reception and transmission of data via the serial port, and the control of the gear motor.
To work with the serial port, I installed the ComPort library. Data from the arduino was transmitted as a string: S force sensor / displacement sensor E (S123456 / 123E).
The program is single-window, with dimensions of 800x600 pixels (so as not to bother with scaling). It contains several bookmarks: A new series of tests, Test, Settings.
I'll start with the last bookmark - Settings.
All the data received through the port is displayed in the terminal, from it I pull out the string, check it for compliance and separate the values by variables.

Variables are multiplied by coefficients to match actual mass and displacement values.
We obtain all these coefficients in the same tab, in the fields corresponding to force, displacement or speed.
The speed calculation coefficient works according to the inverse principle, it translates the set (real) value of speed into that which arduino understands from 0 to 255.
After filling in all the fields and calculating the coefficients, the data can be saved. They are saved in the Exel file, as it is convenient to view it and fix it if necessary.
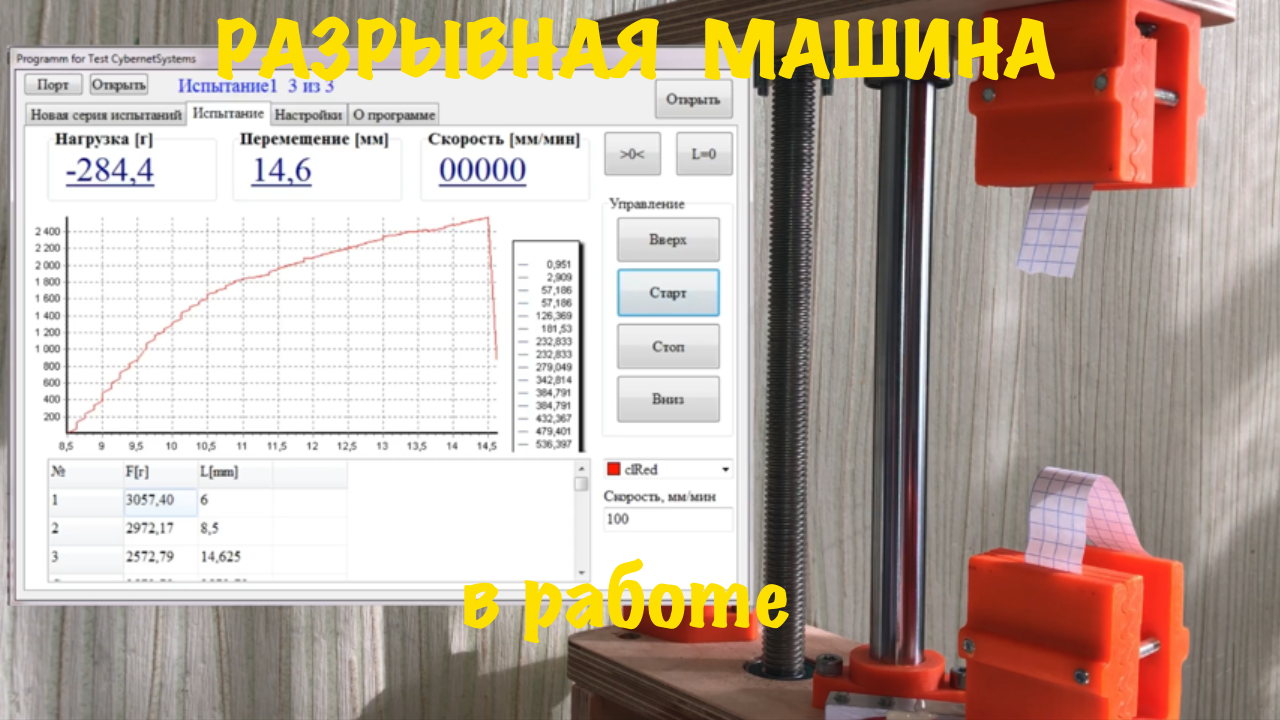
Let's go to the page - Test.
This, you can say, the main page when working with the machine. The upper part displays data from the sensors. The machine control buttons are located on the right side: moving the movable yoke “Up”, “Down” and “Stop”. The "Start" button starts the test with the speed and direction specified in the creation of the test, but more on that below.
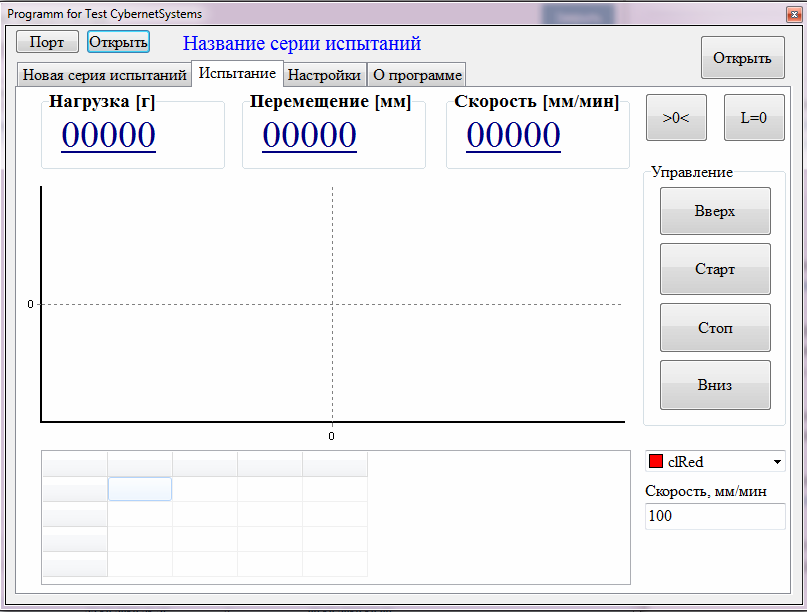
In the central part there is an output area of the test schedule, under which is a summary table of the results of the test series. The table is filled automatically after the test (destruction of the sample), the maximum values of force and displacement.
To start a new series of tests, we will go to the first tab.
It must indicate the name of the test series, the number of tests, and the speed with which the beam will move during the test. Usually for tests according to GOST it is 12 mm / min, but in my case it is slightly higher, since the gear motor does not have enough power at low speeds.

Next, you need to select the type of test: compression, tension or cycling; as well as the criterion for automatic stopping of the machine upon completion of the test.
There can be several such criteria - a stop on reaching a given load or displacement, and a drop in load when the test specimen is destroyed.
The latter is preferable, since it is possible to adjust stops at a nonlinearly increasing load.
The criterion for the drop in load on a stop is due to the drop in load in percent for a given time.
After entering all the required parameters for the tests, click the "Start" button and go to the "Test" page.
We install the sample in the grips, if possible coaxially, so that the test passes correctly.
In the program, we reset the load and displacement values so that the weight of the sample and the preliminary tension after clamping in the grippers are not taken into account.
Pressing the “Start” button sets the movable crosshead in motion, and a graph begins to be built on the screen, which shows how the load creeps up. Having reached its physical limit, the sample is destroyed, and the machine stops. In the summary table below the graph, the values of maximum load and deformation (displacement) appear. Then you can proceed to the next test in the series.
At the end of the last test, the average values of the load and displacement are displayed in the summary table.
Each test series stores test parameters and array data in an Excel file. This is convenient for subsequent analysis in other programs.
In the future I plan to improve the program and replace the drive with a stepper motor with a gearbox, and then it will be seen ...