If the logging is well organized, it allows you to understand what, when and how it goes wrong, and to convey the necessary information to people who have to correct these errors. For a system in which 100 thousand messages are sent every second in 10 data centers in 190 countries, and 350 engineers deploy something every day, the logging system is especially important.

Ivan Letenko is a team leader and developer at Infobip. To solve the problem of centralized processing and log tracing in microservice architecture under such enormous loads, the company tried various combinations of the ELK, Graylog, Neo4j and MongoDB stack. As a result, after a lot of rake, they wrote their log service on Elasticsearch, and PostgreSQL was taken as a database for additional information.
Under the cat in detail, with examples and graphs: architecture and evolution of the system, rakes, logging and tracing, metrics and monitoring, the practice of working with Elasticsearch clusters and administering them under limited resources.
To introduce you to the context, I’ll tell you a little about the company. We help client organizations to deliver messages to their clients: messages from a taxi service, SMS from a bank about cancellation, or a one-time password when entering VC. 350 million messages pass through us every day for clients in 190 countries. Each of them we accept, process, bill, route, adapt, send to operators, and in the opposite direction, process delivery reports and generate analytics.
To all this worked in such volumes, we have:
- 36 data centers around the world;
- 5000+ virtual machines
- 350+ engineers;
- 730+ different microservices.
This is a complex system, and no guru will be able to single-handedly understand the full extent. One of the main goals of our company is the high speed of delivery of new features and releases for business. In this case, everything should work and not fall. We are working on this: 40,000 deployments in 2017, 80,000 in 2018, 300 deployments per day.
We have 350 engineers - it turns out that every engineer deploys something daily . Just a few years ago, only one person in a company had this kind of performance - Kreshimir, our principal engineer. But we made sure that every engineer feels as confident as Kresimir when he presses the Deploy button or runs a script.
What is needed for this? First of all, confidence that we understand what is happening in the system and in what state it is. Confidence is given by the ability to ask the system a question and find out the cause of the problem during the incident and during the development of the code.
To achieve this confidence, we invest in observability . Traditionally, this term combines three components:
- logging;
- metrics
- trace.
We’ll talk about this. First of all, let's look at our solution for logging, but we will also touch upon metrics and traces.
Evolution
Almost any application or system of logging, including ours, goes through several stages of evolution.
The first step is to output to the console .
The second - we begin to write logs to a file , a framework appears for structured output to a file. We usually use Logback because we live in the JVM. At this stage, structured logging to a file appears, understanding that different logs should have different levels, warnings, errors.
As soon as there are several instances of our service or different services, the task of centralized access to the logs for developers and support appears. We move on to distributed logging - we combine various services into a single logging service.
Distributed logging
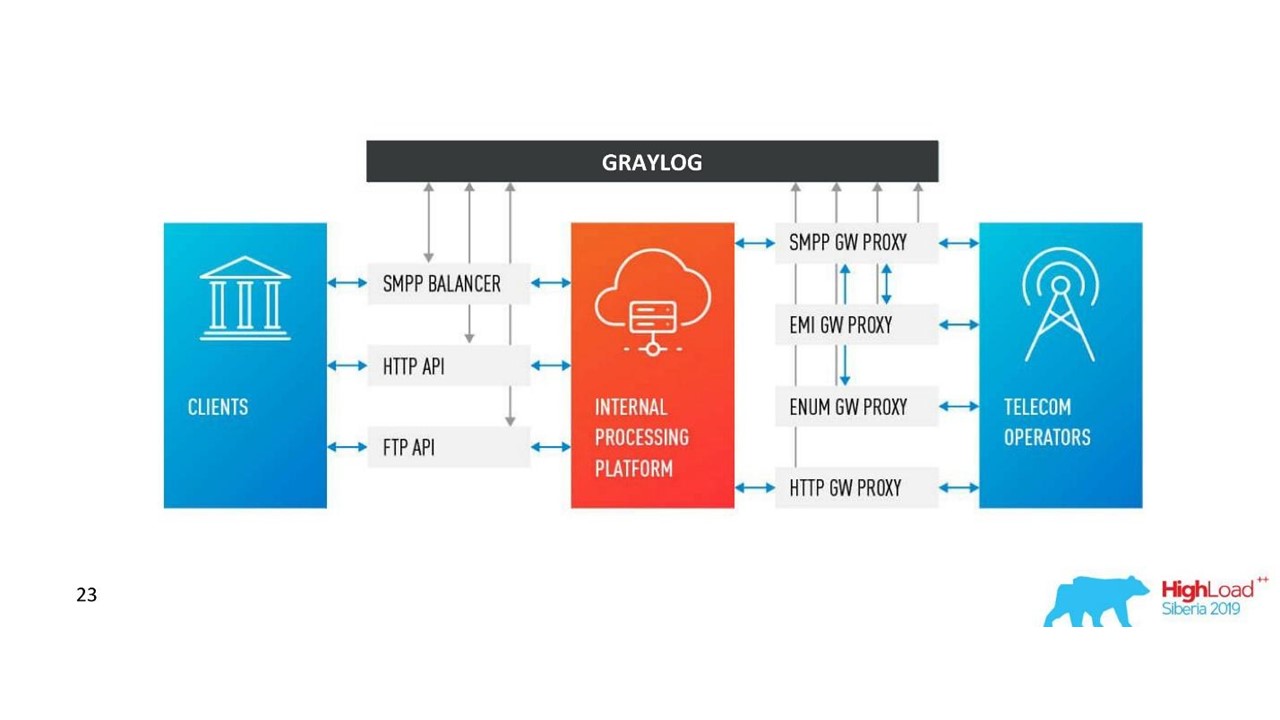
The most famous option is the ELK stack: Elasticsearch, Logstash and Kibana, but we chose Graylog . It has a cool interface that is geared towards logging. Out of the box are alerts already in the free version, which is not in Kibana, for example. For us, this is an excellent choice in terms of logs, and under the hood is the same Elasticsearch.

In Graylog, you can build alerts, charts like Kibana, and even log metrics.
Problems
Our company was growing, and at some point it became clear that something was wrong with Graylog.
Excessive load . There were performance issues. Many developers began to use the cool features of Graylog: they built metrics and dashboards that perform data aggregation. Not the best choice to build sophisticated analytics on the Elasticsearch cluster, which is under heavy recording load.
Collisions There are many teams, there is no single scheme. Traditionally, when one ID first hit Graylog as a long, mapping automatically occurred. If another team decides that there should be written the UUID as a string - this will break the system.
First decision
Separated application logs and communication logs . Different logs have different scenarios and methods of application. There are, for example, application logs for which different teams have different requirements for different parameters: by the storage time in the system, by the speed of search.
Therefore, the first thing we did was to separate application logs and communication logs. The second type is important logs that store information about the interaction of our platform with the outside world and about the interaction within the platform. We will talk more about this.
Replaced a substantial part of the logs with metrics . In our company, the standard choice is Prometheus and Grafana. Some teams use other solutions. But it is important that we got rid of a large number of dashboards with aggregations inside Graylog, transferred everything to Prometheus and Grafana. This greatly eased the load on the servers.
Let's look at the scenarios for applying logs, metrics and traces.
Logs
High dimensionality, debugging and research . What are good logs?
Logs are events that we log.They can have a large dimension: you can log Request ID, User ID, request attributes and other data, the dimension of which is not limited. They are also good for debugging and research, to ask the system questions about what happened, and look for causes and effects.
Metrics
Low dimensionality, aggregation, monitoring and alerts . Under the hood of all metric collection systems are the time series databases. These databases do an excellent job of aggregation, so metrics are suitable for aggregation, monitoring, and building alerts.
Metrics are very sensitive to data dimension.For metrics, the dimension of the data should not exceed a thousand. If we add some Request IDs for which the size of the values is unlimited, then we will quickly encounter serious problems. We have already stepped on this rake.
Correlation and trace
Logs must be correlated.Structured logs are not enough for us to conveniently search by data. There should be fields with certain values: Request ID, User ID, other data from the services from which the logs came.
The traditional solution is to assign a unique ID to the transaction (log) at the entrance to the system. Then this ID (context) is forwarded through the entire system through a chain of calls within a service or between services.

Correlation and tracing.
There are well-established terms. The trace is split into spans and demonstrates the call stack of one service relative to another, one method relative to another relative to the timeline. You can clearly trace the message path, all timings.
First we used Zipkin. Already in 2015, we had a Proof of Concept (pilot project) of these solutions.
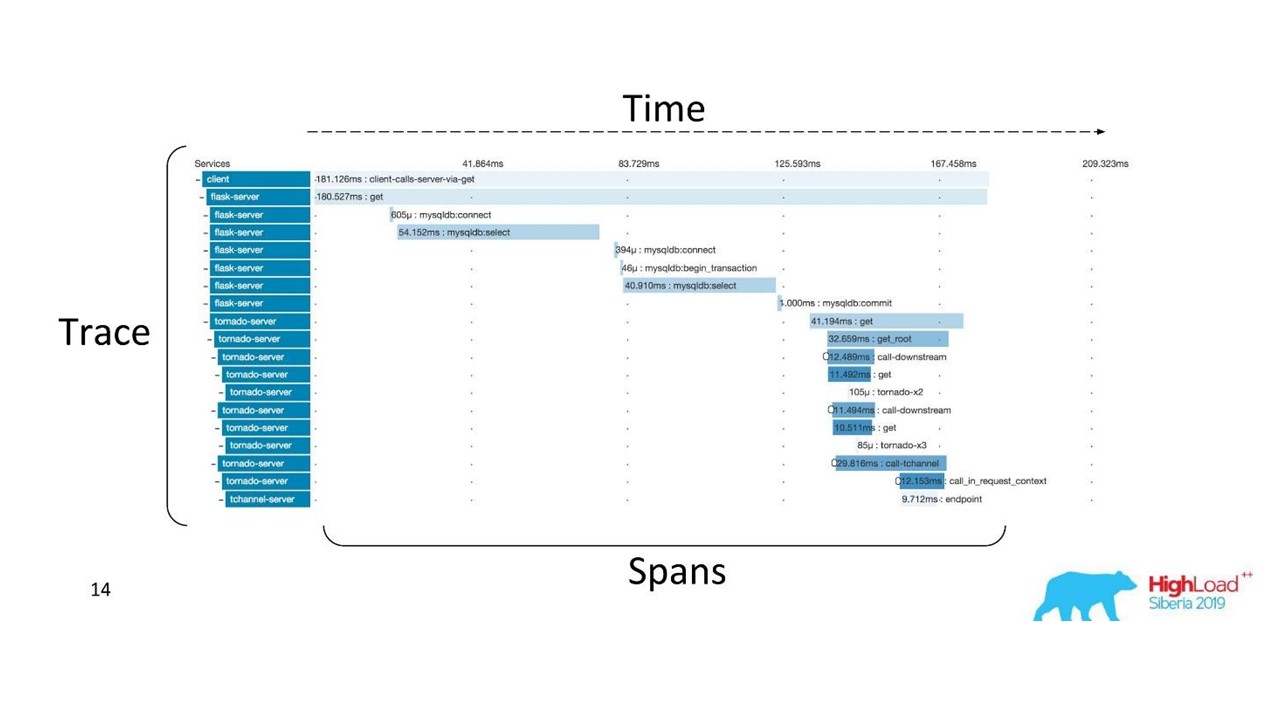
Distributed trace
To get such a picture, the code needs to be instrumented . If you are already working with a code base that exists, you need to go through it - it requires changes.
For a complete picture and in order to benefit from the traces, it is necessary to instrument all the services in the chain , and not just one service that you are currently working on.
This is a powerful tool, but it requires significant administration and hardware costs, so we switched from Zipkin to another solution, which is provided by “as a service”.
Delivery Reports
Logs must be correlated. Traces must also be correlated. We need a single ID - a common context that can be forwarded throughout the call chain. But often this is not possible - correlation occurs within the system as a result of its operation . When we start one or more transactions, we still do not know that they are part of a single large whole.
Consider the first example.
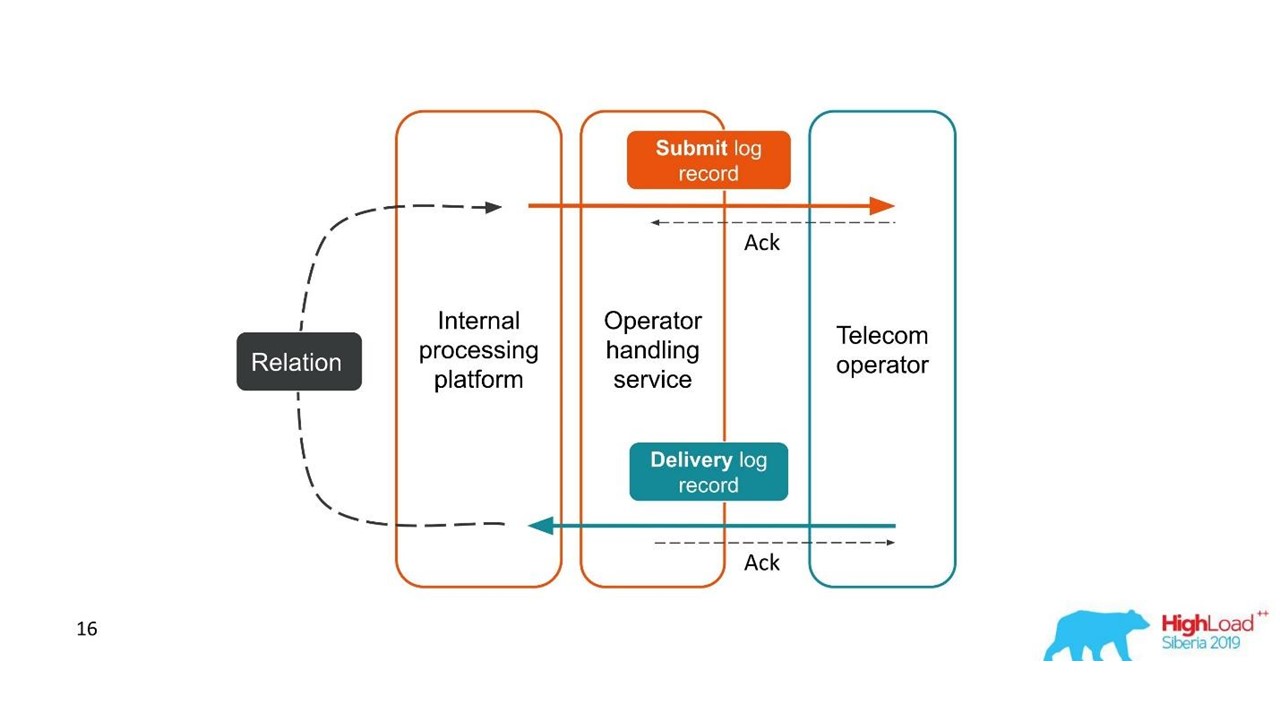
Delivery reports.
- The client sent a request for a message, and our internal platform processed it.
- The service, which is engaged in interaction with the operator, sent this message to the operator - an entry appeared in the log system.
- Later, the operator sends us a delivery report.
- The processing service does not know which message this delivery report relates to. This relationship is created later in our platform.
Two related transactions are parts of a single whole transaction. This information is very important for support engineers and integration developers. But this is completely impossible to see based on a single trace or a single ID.
The second case is similar - the client sends us a message in a large bundle, then we disassemble them, they also return in batches. The number of packs may even vary, but then all of them are combined.
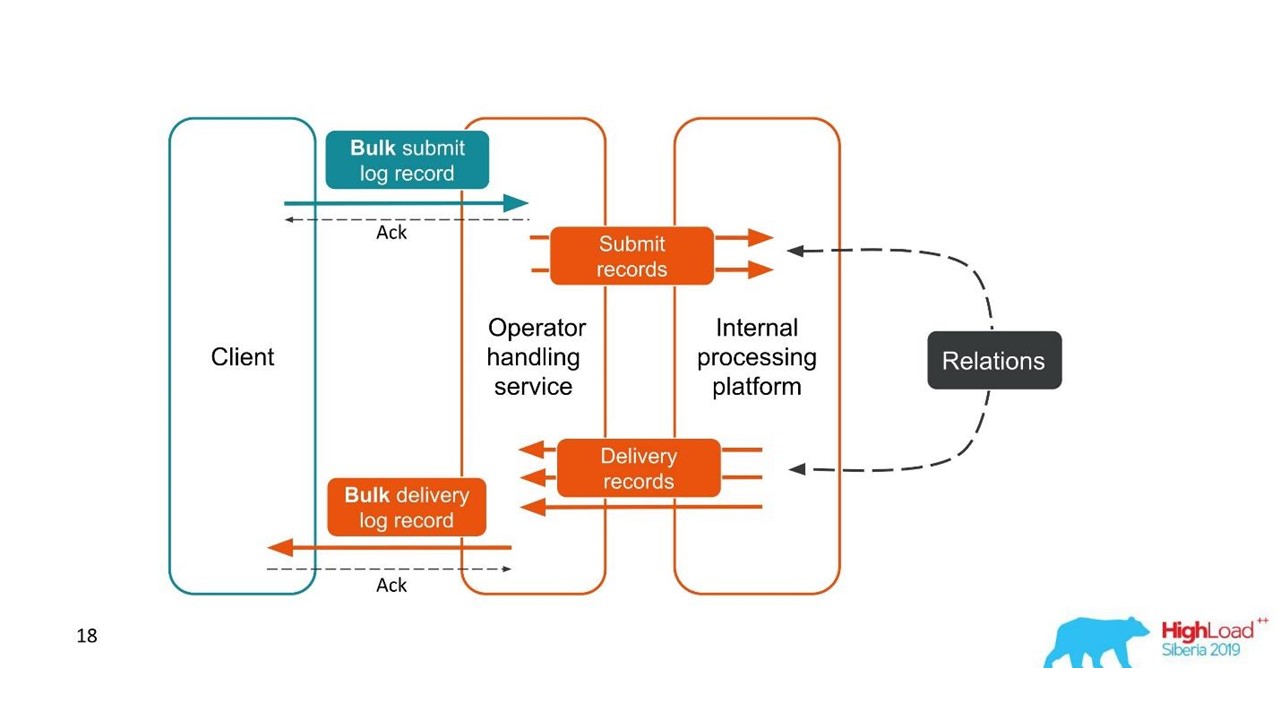
From the point of view of the client, he sent a message and received a response. But we got several independent transactions that need to be combined. It turns out a one-to-many relationship, and with a delivery report - one to one. This is essentially a graph.
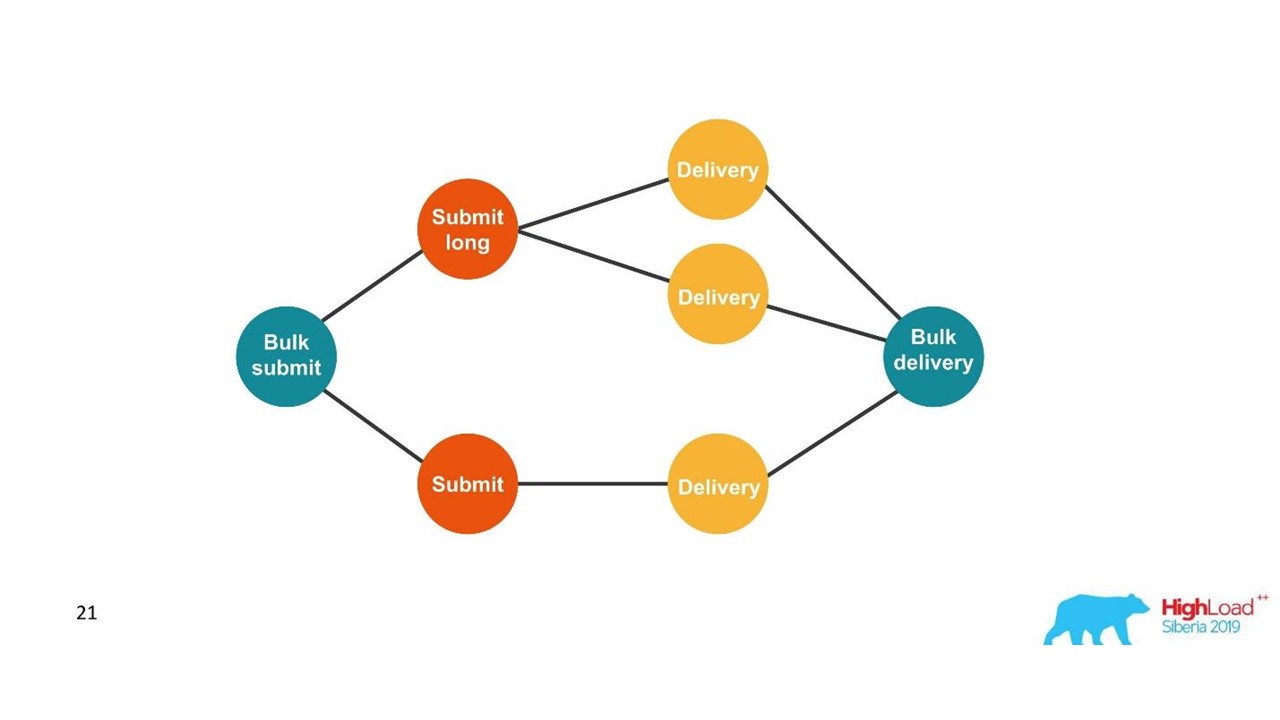
We are building a graph.
Once we see a graph, then an adequate choice is graph databases, for example, Neo4j. The choice was obvious because Neo4j gives cool T-shirts and free books at conferences.
Neo4j
We implemented Proof of Concept: a 16-core host that could process a graph of 100 million nodes and 150 million links. The graph occupied only 15 GB of disk - then it suited us.
Our decision. Log architecture.
In addition to Neo4j, we now have a simple interface for viewing related logs. With him, the engineers see the whole picture.
But pretty quickly, we became disappointed in this database.
Problems with Neo4j
Data rotation . We have powerful volumes and data must be rotated. But when deleting a node from Neo4j, data on the disk is not cleared. I had to build a complex solution and completely rebuild the graphs.
Performance . All graph databases are read-only. On recording, performance is noticeably less. Our case is absolutely the opposite: we write a lot and relatively rarely read - these are units of requests per second or even per minute.
High availability and cluster analysis for a fee . On our scale, this translates into decent costs.
Therefore, we went the other way.
Solution with PostgreSQL
We decided that since we rarely read, the graph can be built on the fly when reading. So we in the PostgreSQL relational database store the adjacency list of our IDs in the form of a simple plate with two columns and an index on both. When the request arrives, we bypass the connectivity graph using the familiar DFS algorithm (depth traversal), and get all the associated IDs. But this is necessary.
Data rotation is also easy to solve. For each day we start a new plate and after a few days, when the time comes, we delete it and release the data. A simple solution.
We now have 850 million connections in PostgreSQL, they occupy 100 GB of disk. We write there at a speed of 30 thousand per second, and for this in the database there are only two VMs with 2 CPUs and 6 GB RAM. As required, PostgreSQL can write longs quickly.
There are still small machines for the service itself, which rotate and control.
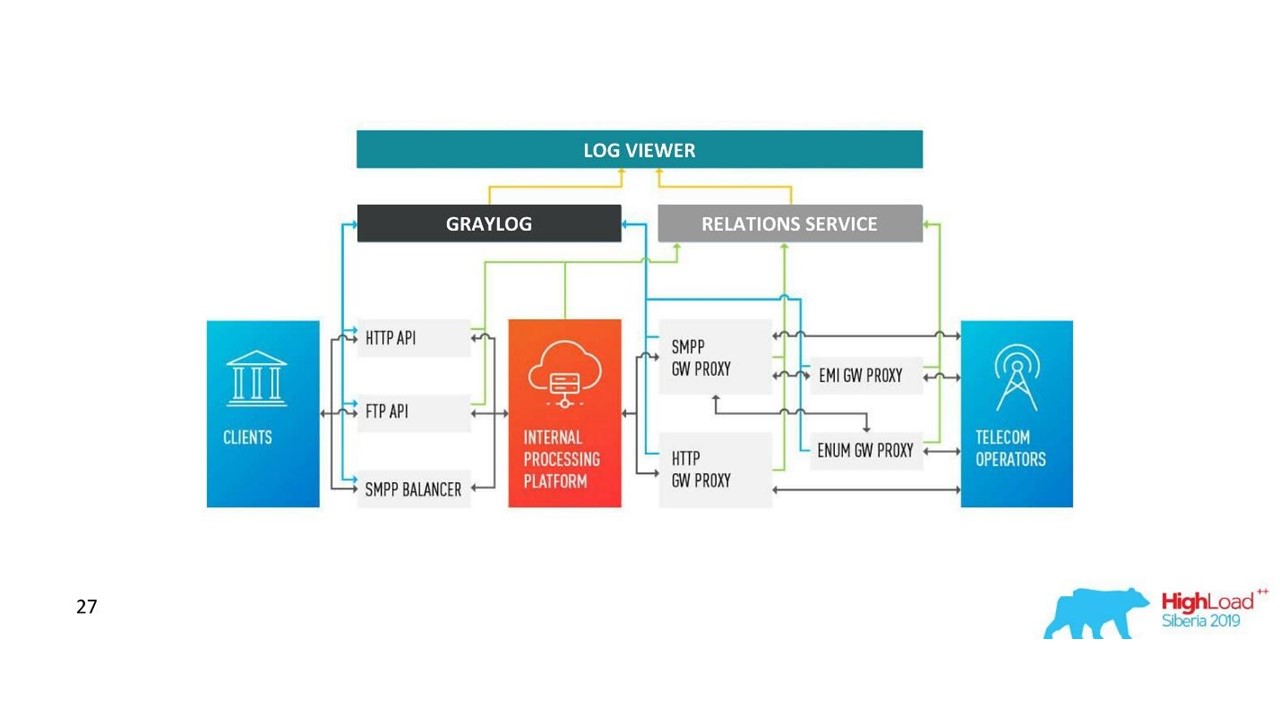
How our architecture has changed.
Challenges with Graylog
The company grew, new data centers appeared, the load increased noticeably, even with a solution with communication logs. We thought that Graylog is no longer perfect.
Unified scheme and centralization . I would like to have a single cluster management tool in 10 data centers. Also, the question arose of a unified data mapping scheme so that there were no collisions.
API We use our own interface to display the connections between the logs and the standard Graylog API was not always convenient to use, for example, when you need to display data from different data centers, correctly sort and mark them. Therefore, we wanted to be able to change the API as we like.
Performance, it is difficult to assess the loss . Our traffic is 3 TB of logs per day, which is decent. Therefore, Graylog did not always work stably, it was necessary to get into its insides in order to understand the causes of failures. It turned out that we were no longer using it as a tool - we had to do something about it.
Processing delays (queues) . We did not like the standard implementation of the queue in Graylog.
The need to support MongoDB . Graylog drags MongoDB, it was necessary to administer this system as well.
We realized that at this stage we want our own solution. Perhaps there are fewer cool features for alerts that have not been used, for dashboards, but their own is better.
Our decision
We have developed our own Logs service.
Log service.
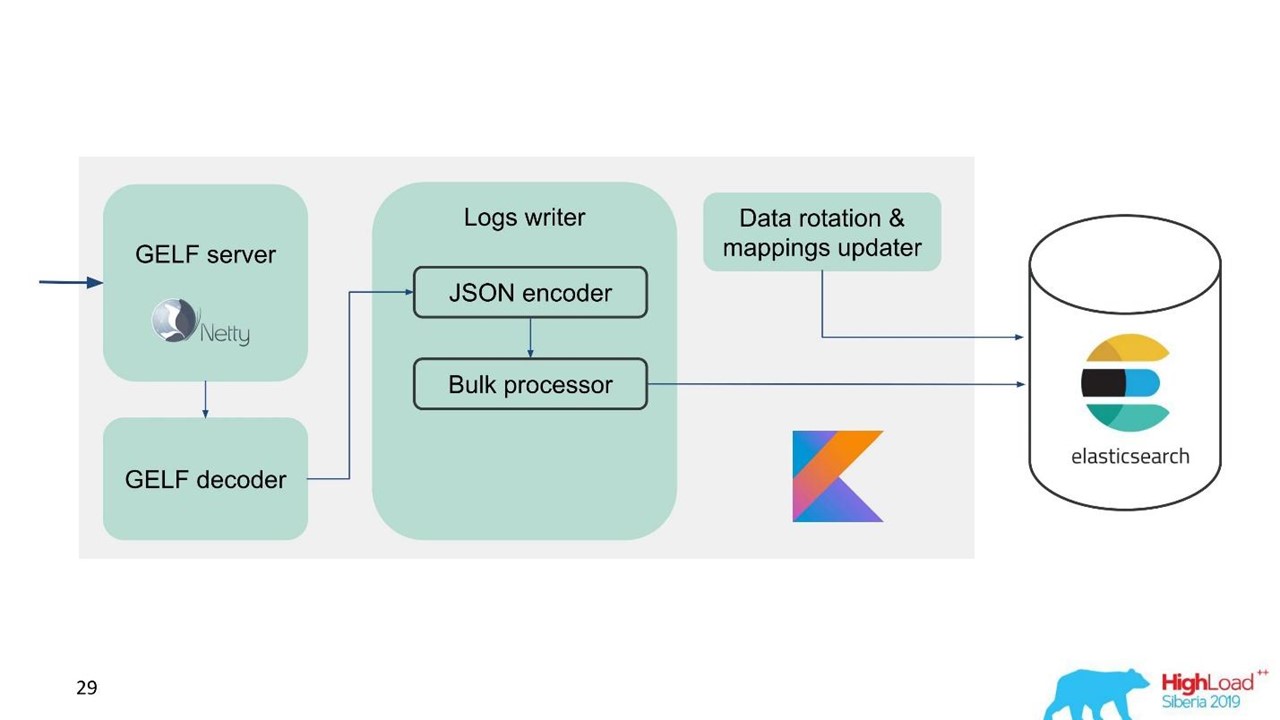
At that moment, we already had expertise in servicing and maintaining large Elasticsearch clusters, so we took Elasticsearch as a basis. The standard stack in the company is JVM, but for the backend we also use Kotlin famously, so we took this language for the service.
The first question is how to rotate data and what to do with mapping. We use fixed mapping. In Elasticsearch, it is better to have indexes of the same size. But with such indexes, we need to somehow map data, especially for several data centers, a distributed system and a distributed state. There were ideas to fasten ZooKeeper, but this is again a complication of maintenance and code.
Therefore, we decided simply - write on time.One index for one hour, in other data centers 2 indexes for an hour, in the third one index for 3 hours, but all in time. Indexes are obtained in different sizes, because at night the traffic is less than during the day, but in general it works. Experience has shown that no complications are needed.
For ease of migration and given the large amount of data, we chose the GELF protocol - a simple Graylog protocol based on TCP. So we got a GELF server for Netty and a GELF decoder.
Then JSON is encoded for writing to Elasticsearch. We use the official Java API from Elasticsearch and write in Bulk.
For high recording speed you need to write Bulk'ami.This is an important optimization. The API provides a Bulk processor that automatically accumulates requests and then sends them for recording in a bundle or over time.
Problem with Bulk Processor
Everything seems to be fine. But we started and realized that we rested on the Bulk processor - it was unexpected. We cannot achieve the values we were counting on - the problem came from nowhere.
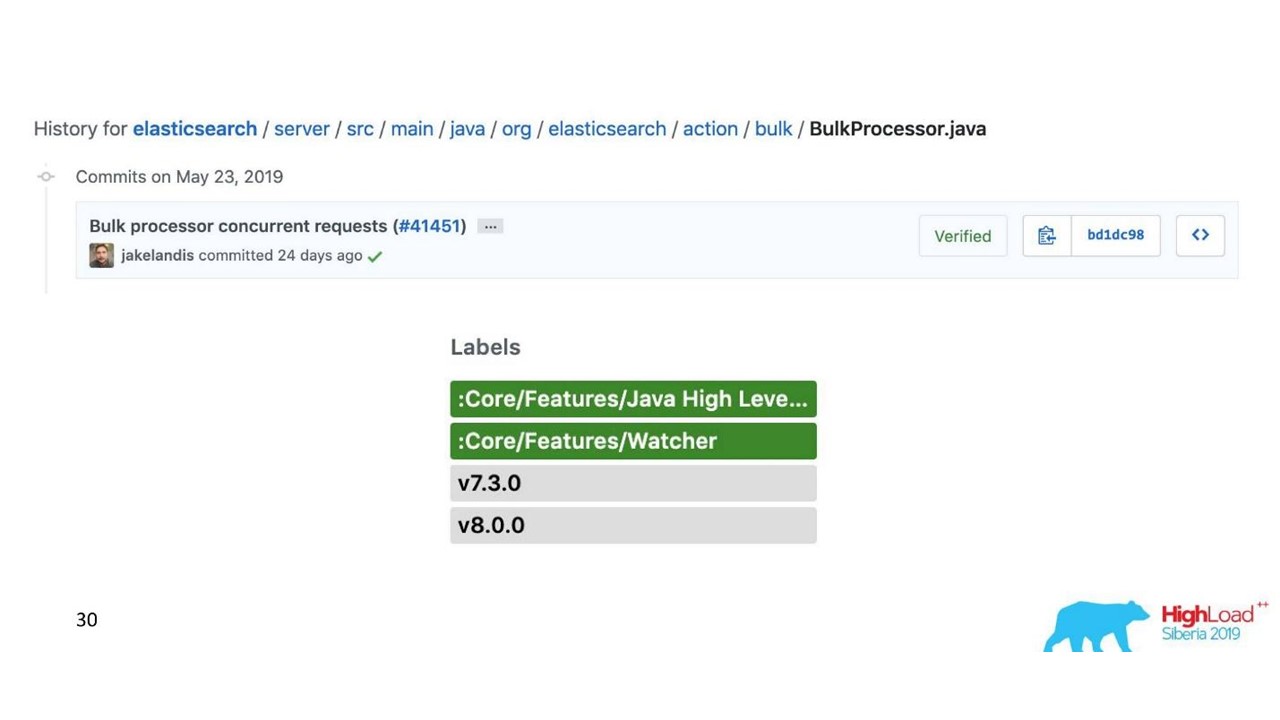
In the standard implementation, the Bulk processor is single-threaded, synchronous, despite the fact that there is a parallelism setting. That was the problem.
We rummaged around and it turned out that this is a known, but not resolved bug. We changed the Bulk processor a bit - made an explicit lock through ReentrantLock. Only in May, similar changes were made to the official Elasticsearch repository and will be available only from version 7.3. The current one is 7.1, and we are using version 6.3.
If you also work with a Bulk-processor and want to overclock an entry in Elasticsearch - look at these changes on GitHub and port back to your version. Changes affect only the Bulk processor. There will be no difficulties if you need to port to the version below.
Everything is fine, the Bulk processor has gone, the speed has accelerated.

Elasticsearch write performance is unstable over time, as various operations take place there: index merging, flush. Also, performance slows down for a while during maintenance, when part of the nodes are dropped out of the cluster, for example.
In this regard, we realized that we need to implement not only the buffer in memory, but also the queue. We decided that we would only send rejected messages to the queue - only those that the Bulk processor could not write to Elasticsearch.
Retry fallback
This is a simple implementation.
- We save rejected messages to the file -
RejectedExecutionHandler
.
- Resend at the specified interval in a separate executor.
- However, we do not delay new traffic.
For support engineers and developers, the new traffic in the system is noticeably more important than the one that for some reason was delayed during the spike or slowdown of Elasticsearch. He lingered, but he would come later - no big deal. New traffic is prioritized.
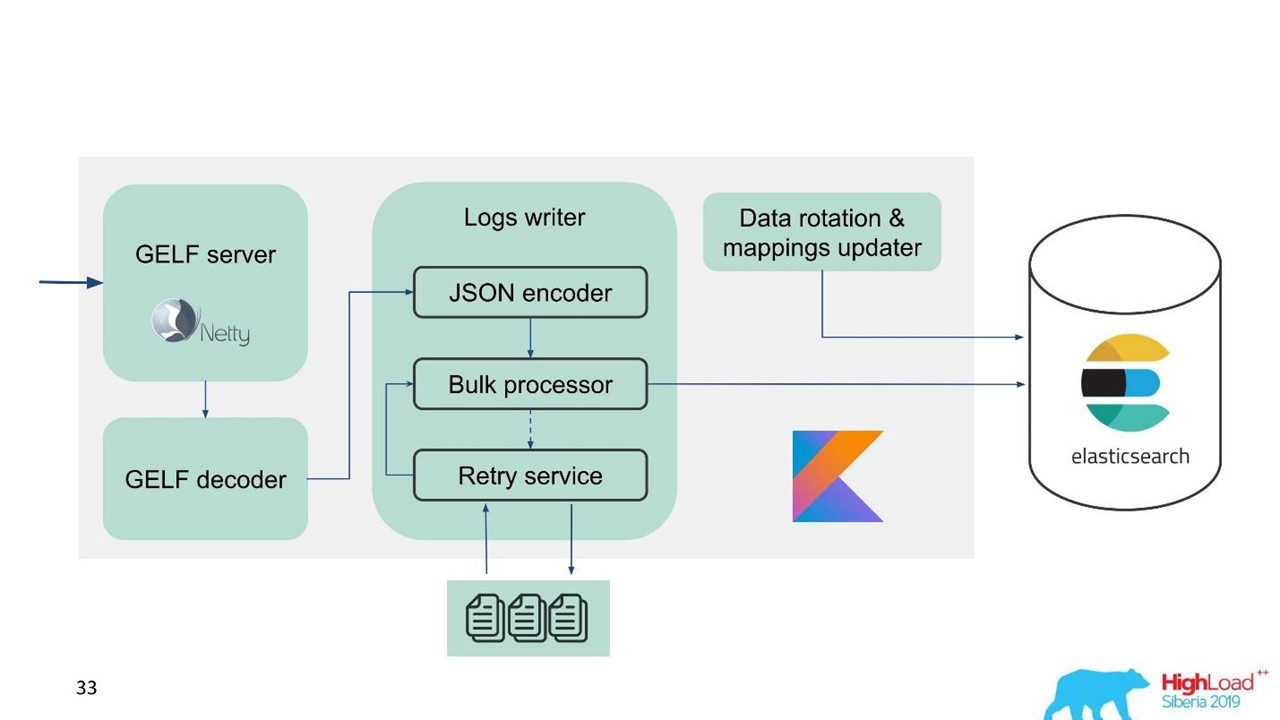
Our scheme began to look like this.
Now let's talk about how we prepare Elasticsearch, what parameters we used and how we set up.
Elasticsearch Configuration
The problem we are faced with is the need to overclock Elasticsearch and optimize it for writing, since the number of readings is noticeably less.
We used several parameters.
"ignore_malformed": true
- discard fields with the wrong type, and not the entire document . We still want to store the data, even if for some reason fields with incorrect mapping have leaked there. This option is not entirely related to performance.
For iron, Elasticsearch has a nuance. When we started asking for large clusters, we were told that RAID-arrays from SSD-drives for your volumes is terribly expensive. But arrays are not needed because fault tolerance and partitioning is already built into Elasticsearch. Even on the official website there is a recommendation to take more cheap iron than less expensive and good. This applies to both disks and the number of processor cores, because the whole Elasticsearch parallels very well.
"index.merge.scheduler.max_thread_count": 1
- recommended for HDD .
If you didn’t get SSDs, but ordinary HDDs, then set this parameter to one. Indexes are written in pieces, then these pieces are frozen. This saves a little bit of disk, but, above all, speeds up the search. Also, when you stop writing to the index, you can do
force merge
. When the load on the cluster is less, it automatically freezes.
"index.unassigned.node_left.delayed_timeout": "5m"
- delay of deployment when a node disappears . This is the time after which Elasticsearch will begin to implement indexes and data if a node is rebooted, deployed, or withdrawn for maintenance. But if you have a heavy load on the disk and network, then deployment is a difficult operation. In order not to overload them, this timeout is better to control and understand what delays are needed.
"index.refresh_interval": -1
- do not update indexes if there are no search queries . Then the index will be updated when a search query appears. This index can be set in seconds and minutes.
"index.translogDurability": "async"
- how often to execute fsync: with each request or by time. Gives performance boost for slow drives.
We also have an interesting way to use it. Support and developers want to be able to full-text search and use regexp'ov throughout the body of the message. But in Elasticsearch this is not possible - it can only search by tokens that already exist in its system. RegExp and wildcard can be used, but the token cannot start with some RegExp. Therefore, we added
word_delimiter
to the filter:
"tokenizer": "standard" "filter" : [ "word_delimiter" ]
It automatically splits words into tokens:
- “Wi-Fi” → “Wi”, “Fi”;
- “PowerShot” → “Power”, “Shot”;
- “SD500” → “SD”, “500”.
The name of the class, various debugging information is written in a similar way. With it, we closed some of the problems with full-text search. I advise you to add such settings when working with the login.
About the cluster
The number of shards should be equal to the number of data nodes for load balancing . The minimum number of replicas is 1, then each node will have one main shard and one replica. But if you have valuable data, for example, financial transactions, better than 2 or more.
The size of the shard is from a few GB to several tens of GB . The number of shards on a node is no more than 20 per 1 GB of Elasticsearch hip, of course. Further Elasticsearch slows down - we also attacked it. In those data centers where there is little traffic, the data did not rotate in volume, thousands of indexes appeared and the system crashed.
Use
allocation awareness
, for example, by the name of a hypervisor in case of maintenance. Helps scatter indexes and shards across different hypervisors so that they do not overlap when a hypervisor drops out.
Create indexes beforehand . Good practice, especially when writing on time. The index is immediately hot, ready and there are no delays.
Limit the number of shards of one index per node .
"index.routing.allocation.total_shards_per_node": 4
is the maximum number of shards of one index per node. In the ideal case, there are 2 of them, we put 4 just in case, if we still have fewer cars.
What is the problem here? We use
allocation awareness
- Elasticsearch knows how to properly spread indexes across hypervisors. But we found out that after the node was turned off for a long time, and then comes back to the cluster, Elasticsearch sees that it has formally fewer indexes and they are restored. Until the data is synchronized, formally there are few indexes on the node. If necessary, allocate a new index, Elasticsearch tries to hammer this machine as densely as possible with fresh indexes. So a node receives a load not only from the fact that data is replicated to it, but also with fresh traffic, indexes and new data that fall on this node. Control and limit it.
Elasticsearch Maintenance Recommendations
Those who work with Elasticsearch are familiar with these recommendations.
During scheduled maintenance, apply the recommendations for rolling upgrade: disable shard allocation, synced flush.Disable shard allocation . Disable the allocation of replicas shard, leave the ability to allocate only primary. This noticeably helps Elasticsearch - it will not reallocate data that you do not need. For example, you know that in half an hour a node will rise - why transfer all shards from one node to another? Nothing terrible will happen if you live with the yellow cluster for half an hour, when only primary shards are available.
Synced flush . In this case, the node synchronizes much faster when it returns to the cluster.
With a heavy load on writing to the index or recovery, you can reduce the number of replicas.If you download a large amount of data, for example, peak load, you can turn off shards and later give a command to Elasticsearch to create them when the load is already less.
Here are a few commands that I like to use:
-
GET _cat/thread_pool?v
- allows you to seethread_pool
on each node: what's hot now, what are the write and read queues.
-
GET _cat/recovery/?active_only=true
- which indexes are being deployed to, where the recovery is taking place.
-
GET _cluster/allocation/explain
- in a convenient human form why and which indexes or replicas were not allocated.
For monitoring we use Grafana.
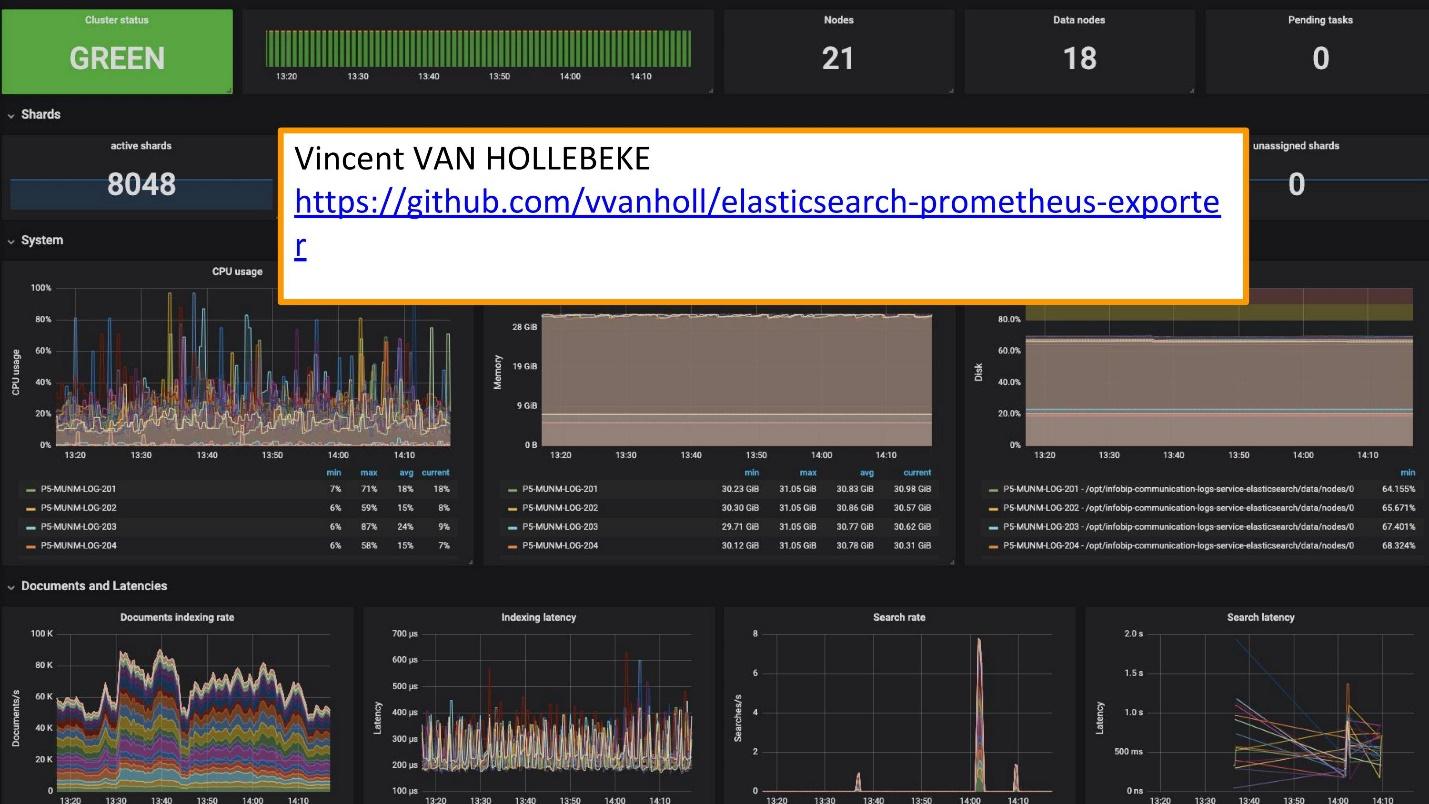
There is an excellent exporter and Grafana teamplay from Vincent van Hollebeke , which allows you to visually see the status of the cluster and all its main parameters. We added it to our Docker image and all the metrics when deploying from our box.
Logging Conclusions
Logs should be:
- centralized - a single entry point for developers;
- available - the ability to quickly search;
- structured - for quick and convenient extraction of valuable information;
- correlated - not only among themselves, but also with other metrics and systems that you use.
The Swedish Melodifestivalen contest has recently been held. This is a selection of representatives from Sweden for Eurovision. Before the competition, our support service contacted us: “Now in Sweden there will be a big load. The traffic is quite sensitive and we want to correlate some data. You have data in the logs that is missing on the Grafana dashboard. We have metrics that can be taken from Prometheus, but we need data on specific ID requests. ”
They added Elasticsearch as the source of Grafana and were able to correlate this data, close the problem and get a pretty good result fast enough.
Exploiting your own solutions is much easier.Now, instead of the 10 Graylog clusters that worked for this solution, we have several services. These are 10 data centers, but we do not even have a dedicated team and people who serve them. There are several people who have worked on them and change something as needed. This small team is perfectly integrated into our infrastructure - deploying and servicing is easier and cheaper.
Separate cases and use appropriate tools.These are separate tools for logging, tracing and monitoring. There is no “golden instrument” that will cover all your needs.
To understand which tool is needed, what to monitor, where to use the logs, what requirements to the logs, you should definitely refer to SLI / SLO - Service Level Indicator / Service Level Objective. You need to know what is important for your customers and your business, what indicators they look at.
Within a week, SKOLKOVO will host HighLoad ++ 2019 . In the evening of November 7, Ivan Letenko will tell you how he lives with Redis on the prod, and in total there are 150 reports in the program on a variety of topics.
If you are having problems visiting HighLoad ++ 2019 live, we have good news. This year the conference will be held in three cities at once - in Moscow, Novosibirsk and St. Petersburg. At the same time. How it will be and how to get there - find out on a separate promo page of the event.