Instead of annotation
If you ever thought about the need to justify the size of the salary part of the enterprise’s wages, you needed clarity and simplicity in making such decisions, then you are not alone and the material under the cut for you. A modest attempt to implement a salary justification system at an enterprise using modern integrated assessment mechanisms to derive a point-rating system and Bezier curves as the basis for reducing points to the resulting salaries will be presented here.
A small compliment to habr (u):
In a scientific article in some kind of “decent” journal, where, to some extent, writing of the ritual parts of the article is required, I would have to very twistly twist the relevance of the article, bring multiple literary sources under it, and sometimes engage in unnecessary publishing graphomania. Habr has become an outlet for me, allowing me to express my thoughts on the case and without unnecessary “nods” to the scientific community. At the same time, I emphasize that the degree of education of the team on the resource should not just be in doubt, but sometimes you have to think about your own compliance.
Brief statement of the problem
The structure of the total remuneration of a modern enterprise is diverse, in a generalized form it may contain various components (Fig. 1). In this publication, we will be interested in the basic salary. It can also be noted that in the process of work, for the most part, structures were considered where time-based wages prevail.

Figure 1. The structure of the total remuneration.
I would especially like to note that when considering the problem, the authors' view was turned, for the most part, to non-production personnel, whose work is very difficult to measure and digitize.
Net time wage is not a stimulating factor, but if the principle of fairness and transparency is violated, it can significantly affect the decrease in motivation. Violation of the principle of justice is expressed in the following:
- Normative local acts on payment are formal and do not determine the actual establishment and change of salaries.
- The tariff grid is built so that a specialist without a category can receive as much as the head of the department (blurring the grid).
- Groups of posts, united in the category of payments, can significantly differ in the complexity of the work performed.
- Salaries depend on the unit in which the employee works, and not on the complexity of his work.
We also introduce some additional terms:
Grading is a way of setting a wage rate based on an assessment of the activities of each individual employee (or workplace) according to uniform criteria, distributed according to their importance (value) for the organization.
In other words:
- This is a breakdown of all positions in the company by categories from highest to lowest, each of which is assigned a specific salary, or “plug” salary, which determines the minimum and maximum tariff rates for each position.Our labor legislation does not require staffing and the tariff schedule for commercial structures, and both of these are needed first of all by the employer himself as a tool for managing human resources.
Developments in this area, scientific works of famous authors, are indisputably present. Moreover, the range of applicants is wide. The most famous, perhaps, is the development of Hay Group . Great thing, I will not criticize and bring darkness to the beautiful and one of the first, of its kind, systems. I only note that at the enterprise where such a system was introduced, untrained personnel did not know how to use it, and therefore, when changing jobs in the department of labor and wages, no one could fully adapt the system to changing conditions. So they kept it like a great ancient artifact, which no one could read except the Old Believers, and they were no longer left.
Make changes
(model development)
Usually, for the implementation of multifactor models, which are ultimately required to obtain a single numerical result, I prefer the method of complex assessment based on criteria trees, convolution matrices, and a system for reducing criteria to a single scale.
In short, the advantages of such constructions are the possibilities:
- application of an unlimited number of assessment factors;
- realization of non-linearity and variability of the degree of influence of factors;
- inclusion of factors of various types (with physical changes, expert assessments, correspondence tables, etc.);
- predicting results and expecting values in a certain range.
The ease of use of such mechanisms is successfully combined with the multivariance of the resulting estimate, since even in a limited numerical range of 1-4, which takes a comprehensive assessment, you can get a sufficient variety.

Figure 2. The block diagram of the receipt of grades and their transfer to staff salaries.
The idea was that, according to several criteria, an assessment was made of the “significance” for the business of the structural unit and the specific position for this unit.
In general, according to this scheme, it is required to note:
- for each unit, its own calculation is formed according to a single integrated assessment model;
- in the model of integrated assessment, both quantitatively measurable factors and expert ones can be used;
- after receiving all the model values for each department and each position, matrix multiplication is performed, where the overall result is formed;
- to bring grades to the size of wages, a model is applied to bring grades to the salaries of department employees.
In forming the assessment of the significance of the department, the following criteria were used:
- According to the level of processes: main, auxiliary, servicing;
- By the degree of universality of the tasks being solved: universal, specific, situational;
- By the level of interaction: between organizations; between organizational units; internal interaction.
In the presented evaluation criteria, there are always 3 options for each criterion. These options are arranged “in descending order” of significance from rating 4 to rating 1. The average option corresponds to a rating of 2.5. Applying this reduction, all estimates can be translated in the standard integrated assessment scale 1-4 (here you just need to accept ... we agreed).
The basic type of the tree for assessing the significance of the position was formed as follows:
- Position level: managers, specialists, performers;
- Types of tasks: organizational, creative, regulated;
- Connectivity of tasks: with the external environment, between units, within units.
An example of this is the integrated assessment model, which, by the way, we managed to “drive” into Excel, i.e. make available, shows how easy it is to conduct an assessment procedure.
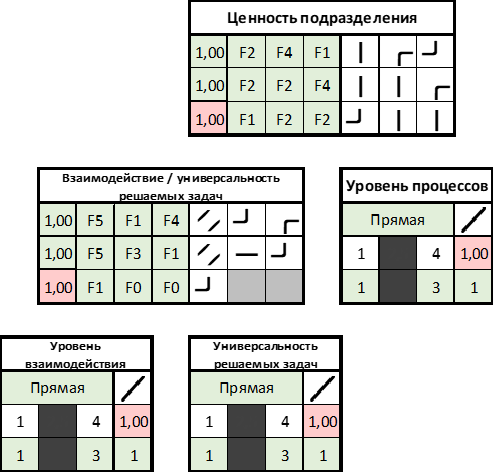
Figure 3. General view of the integrated valuation model “Unit Value”.
After compiling a model, each criterion for each unit (and for posts, respectively, has its own model) is given its own rating, and the system simply considers it. It remains to write these values.
What does the “summary” of grades look like in the end?
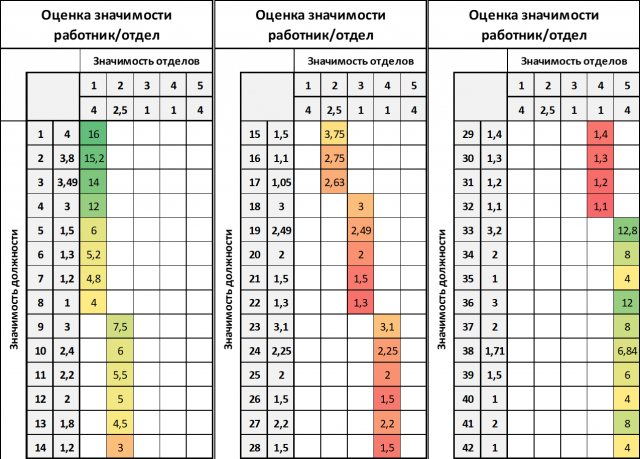
Figure 4. An example of calculating a grade of the type “department significance / position significance”.
In this case, the optimal seemed to be the multiplication of “department significance” and “position significance”. The result was quite differentiated and could be used to determine the tariff scale.
Last component
As you remember, in accordance with Figure 2, it is now necessary to convert the ball-rating to salary.
It was originally supposed that this could be done using a simple linear function. For these purposes, the decision maker (the decision maker) is invited to simply indicate the minimum and maximum salary at the enterprise. Quite a simple and logical move, as it seemed.
The first and obvious attempt is to snap with a linear circuit. With the indicated parameters, the decision maker (the head of one of the Universities) obtained such a result that the head of the structural unit, having received a grade point of 13, should receive a salary of more than 200 thousand (head of the department).
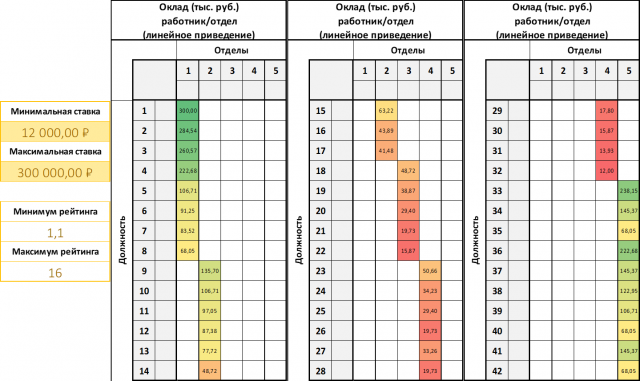
Figure 5. An example of “exposing” grades to wages using a linear cast scale.
The need to implement a simple system for the formation of non-linear reduction of salaries / grades has become apparent. In this case, it was required to simplify the process of “selection” of the optimal reduction as much as possible.
Bezier curves came to mind quite by accident. Since the extreme points for the curve are determined automatically (minimum and maximum grades / minimum and maximum salaries), the decision maker will just have to shift one / two points to get the desired type of curve.
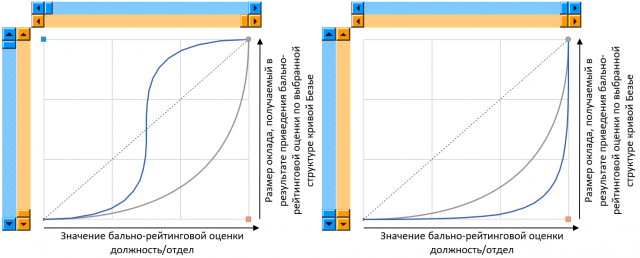
Figure 6. The Bezier curve graphical control implemented in Excel
Initially, an attempt was made to get around only a quadratic version of the curve, however, after trying to build, it became clear that they could not get around and it was necessary to implement a cubic version of the function.
In order to generate a Bezier curve in Excel, the following actions are required:
- Designate the extreme points on the graph by the coordinates X, Y: (1; 1) and (4; 4) - in the example under consideration. Such extreme coordinates are taken to make the graph look clear. He is not required to show a real connection, but only to show dependence;
- Designate the coordinates for points displaced by the LPR: one point for a quadratic curve and two points for a cubic;
- Set the calculation step for the curve (in our example, 0.5) and calculate the pairs of points for the curve.
Example:
Suppose the extreme points are marked: (X1; Y1) - (1; 1), (X4; Y4) - (4; 4). Imagine that there are 2 additional shifted points: (X2; Y2), (X3; Y3). Moreover, each coordinate is in the range of 1-4 and is not included in it.
To construct the X coordinate for a quadratic curve for a given step of the interval Ti, we can apply the formula:
= DEGREE (Ti; 2) * X1 + 2 * (Ti) * Ti * X2 + DEGREE (Ti; 2) * X4 ,
where as X1, X2, X4 you need to specify links to cells with coordinates.
Similarly, you can calculate for the point Y, replacing X coordinates with Y-coordinates.
As for the coordinates for the cubic curve, here the formula has the form:
= DEGREE (1-Ti; 3) * X1 + 3 * DEGREE (1-Ti; 2) * Ti * X2 + 3 * (1-Ti) * DEGREE (Ti; 2) * X3 + DEGREE (Ti; 3) * X4
After building the curves, the decision maker received a visual control tool. However, to apply the curves, it is necessary to implement the process of obtaining the Y coordinate from the indicated Y coordinate. Here was the big problem itself. However, it was possible to implement VBA code that allows such operations.
For a quadratic function:
Function __Y__X__( _ X As Double, _ X1 As Double, _ X2 As Double, _ X3 As Double, _ Y1 As Double, _ Y2 As Double, _ Y3 As Double) As Double Dim aX, bX, cX, aY, bY, cY, Temp, dis, X_1, X_2, X_f, Y_f As Double aX = X1 - 2 * X2 + X3 bX = -2 * X1 + 2 * X2 cX = X1 - X aY = Y1 - 2 * Y2 + Y3 bY = -2 * Y1 + 2 * Y2 cY = Y1 dis = bX * bX - 4 * aX * cX If aX <> 0 Then X_1 = (-bX + (dis ^ (1 / 2))) / (2 * aX) X_2 = (-bX - (dis ^ (1 / 2))) / (2 * aX) Else X_1 = -cX / bX End If If Not IsEmpty(X_1) Then If ((CDbl(CStr(X_1)) >= 0) And (CDbl(CStr(X_1)) <= 1)) Then X_f = X_1 If Not IsEmpty(X_2) Then If ((CDbl(CStr(X_2)) >= 0) And (CDbl(CStr(X_2)) <= 1)) Then X_f = X_2 Y_f = ((1 - X_f) ^ 2) * Y1 + 2 * (1 - X_f) * X_f * Y2 + (X_f ^ 2) * Y3 '=(1-R[-1]C[-1];2)*R58C2+2*(1-R[-1]C[-1])*R[-1]C[-1]*R58C3+(R[-1]C[-1];2)*R58C5 a = a __Y__X__ = Y_f End Function
For cubic function:
Function __Y__X__( _ X As Double, _ X1 As Double, _ X2 As Double, _ X3 As Double, _ X4 As Double, _ Y1 As Double, _ Y2 As Double, _ Y3 As Double, _ Y4 As Double) As Double Dim myPi, aX, bX, cX, dX, aY, bY, cY, dY, Q, P, S, Temp, fi, dis, X_1, X_2, X_3, X_f, Y_f As Double 'Exit Function 'If X1 = 1.5 Or X = 0 Or X1 = 0 Or X2 = 0 Or X3 = 0 Or X4 = 0 Then Exit Function 'Application.Volatile True myPi = WorksheetFunction.Acos(-1) aX = -X1 + (3 * X2) - (3 * X3) + X4 bX = 3 * X1 - 6 * X2 + 3 * X3 cX = -3 * X1 + 3 * X2 dX = X1 - X aY = -Y1 + 3 * Y2 - 3 * Y3 + Y4 bY = 3 * Y1 - 6 * Y2 + 3 * Y3 cY = -3 * Y1 + 3 * Y2 dY = Y1 If aX < 0.000001 And aX > -0.000001 Then _ aX = 0 If CDbl(CStr(aX)) <> 0 Then Temp = aX aX = aX / Temp bX = bX / Temp cX = cX / Temp dX = dX / Temp Q = (bX ^ 2 - 3 * cX) / 9 P = (2 * (bX ^ 3) - 9 * bX * cX + 27 * dX) / 54 S = Q ^ 3 - P ^ 2 'X1 = -1 'X2 = -1 'X3 = -1 T = T If S < 0.00000001 And S > -0.00000001 Then _ S = 0 If P < 0.00000001 And P > -0.00000001 Then _ P = 0 If Q < 0.00000001 And Q > -0.000000001 Then _ Q = 0 If S > 0 Then fi = (1 / 3) * WorksheetFunction.Acos(P / ((Q ^ 3) ^ (1 / 2))) X_1 = -2 * (Q ^ (1 / 2)) * Cos(fi) - bX / 3 X_2 = -2 * (Q ^ (1 / 2)) * Cos(fi + 2 * myPi / 3) - bX / 3 X_3 = -2 * (Q ^ (1 / 2)) * Cos(fi - 2 * myPi / 3) - bX / 3 ElseIf S = 0 Then fi = 0 X_1 = -2 * (P ^ (1 / 3)) - bX / 3 X_2 = (P ^ (1 / 3)) - bX / 3 Else If Q > 0 Then fi = (1 / 3) * WorksheetFunction.Acosh(Abs(P) / ((Q ^ 3) ^ (1 / 2))) X_1 = -2 * Sgn(P) * (Q ^ (1 / 2)) * WorksheetFunction.Cosh(fi) - bX / 3 ElseIf Q = 0 Then fi = 0 T = (dX - (bX ^ 3) / 27) X_1 = -((Abs(T) ^ (1 / 3)) * (2 * (T < 0) + 1)) - bX / 3 'T = (dX - (bX ^ 3) / 27) 'T = (Abs(T) ^ (1 / 3)) * ((T < 0) + 1) 'X_1 = -T - bX / 3 Else fi = (1 / 3) * WorksheetFunction.Asinh(Abs(P) / ((Abs(Q) ^ 3) ^ (1 / 2))) X_1 = -2 * Sgn(P) * (Abs(Q) ^ (1 / 2)) * WorksheetFunction.Sinh(fi) - bX / 3 End If End If If Not IsEmpty(X_1) Then If ((CDbl(CStr(X_1)) >= 0) And (CDbl(CStr(X_1)) <= 1)) Then X_f = X_1 If Not IsEmpty(X_2) Then If ((CDbl(CStr(X_2)) >= 0) And (CDbl(CStr(X_2)) <= 1)) Then X_f = X_2 If Not IsEmpty(X_3) Then If ((CDbl(CStr(X_3)) >= 0) And (CDbl(CStr(X_3)) <= 1)) Then X_f = X_3 a = a Else dis = cX * cX - 4 * bX * dX If bX < 0.000001 And bX > -0.000001 Then _ bX = 0 If bX <> 0 Then X_1 = (-cX + (dis ^ (1 / 2))) / (2 * bX) X_2 = (-cX - (dis ^ (1 / 2))) / (2 * bX) Else X_1 = -dX / cX End If If Not IsEmpty(X_1) Then If ((CDbl(CStr(X_1)) >= 0) And (CDbl(CStr(X_1)) <= 1)) Then X_f = X_1 If Not IsEmpty(X_2) Then If ((CDbl(CStr(X_2)) >= 0) And (CDbl(CStr(X_2)) <= 1)) Then X_f = X_2 End If a = a Y_f = ((1 - X_f) ^ 3) * Y1 + 3 * ((1 - X_f) ^ 2) * X_f * Y2 + 3 * (1 - X_f) * (X_f ^ 2) * Y3 + (X_f ^ 3) * Y4 'Debug.Print (Y_f) __Y__X__ = Y_f End Function
In the process, attempts were made to find a ready-made option on the network and recycle, but it did not happen. It was also accidentally discovered that VBA is not able to correctly extract an odd degree root from a negative number. Only a certain combination allowed to correct the situation:
T = (dX - (bX ^ 3) / 27) X_1 = -((Abs(T) ^ (1 / 3)) * (2 * (T < 0) + 1)) - bX / 3
* -possibly in the code there is still somewhere else a moment associated with such a calculation. A bug was discovered during the writing of the article)
Resulting constructs
So, compare the results (constructed in accordance with the type of curves in Figure 6 (right graph)):

Figure 7. Comparison of casts of grades to real salaries (reflection of system flexibility)
It can be seen from the figure that the cubic function allows you to “bend” the dependence of the ball-rating score and real salary even more (the manager, unfortunately, was satisfied with this option).
In any case, this work, although it is purely experimental in nature, has not actually been launched anywhere, but, as it seems to the authors, it can be useful in real developments.
I hope that she doesn’t “lie on the shelf”, but someone will find it necessary.