Decoding of the report “Typical implementation of monitoring” by Nikolay Sivko.
My name is Nikolai Sivko. I also do monitoring. Okmeter is the 5 monitoring that I do. I decided that I will save all people from the hell of monitoring and we will save someone from this suffering. I always try not to advertise an okmeter in my presentations. Naturally, the pictures will be from there. But the idea of what I want to tell is that we make monitoring a slightly different approach than everyone usually does. We talk a lot about this. When we try to convince each individual person in this, in the end he becomes convinced. I want to talk about our approach precisely so that if you do monitoring yourself, so that you avoid our rake.

About the Okmeter in a nutshell. We do the same as you, but there are all sorts of chips. Chips:
- detailing;
- a large number of pre-configured triggers that are based on the problems of our customers;
- Auto configuration

A typical customer comes to us. He has two tasks:
1) to understand that everything broke down from monitoring, when there is nothing at all.
2) quickly fix it.
He comes to monitor the answers of what is happening to him.
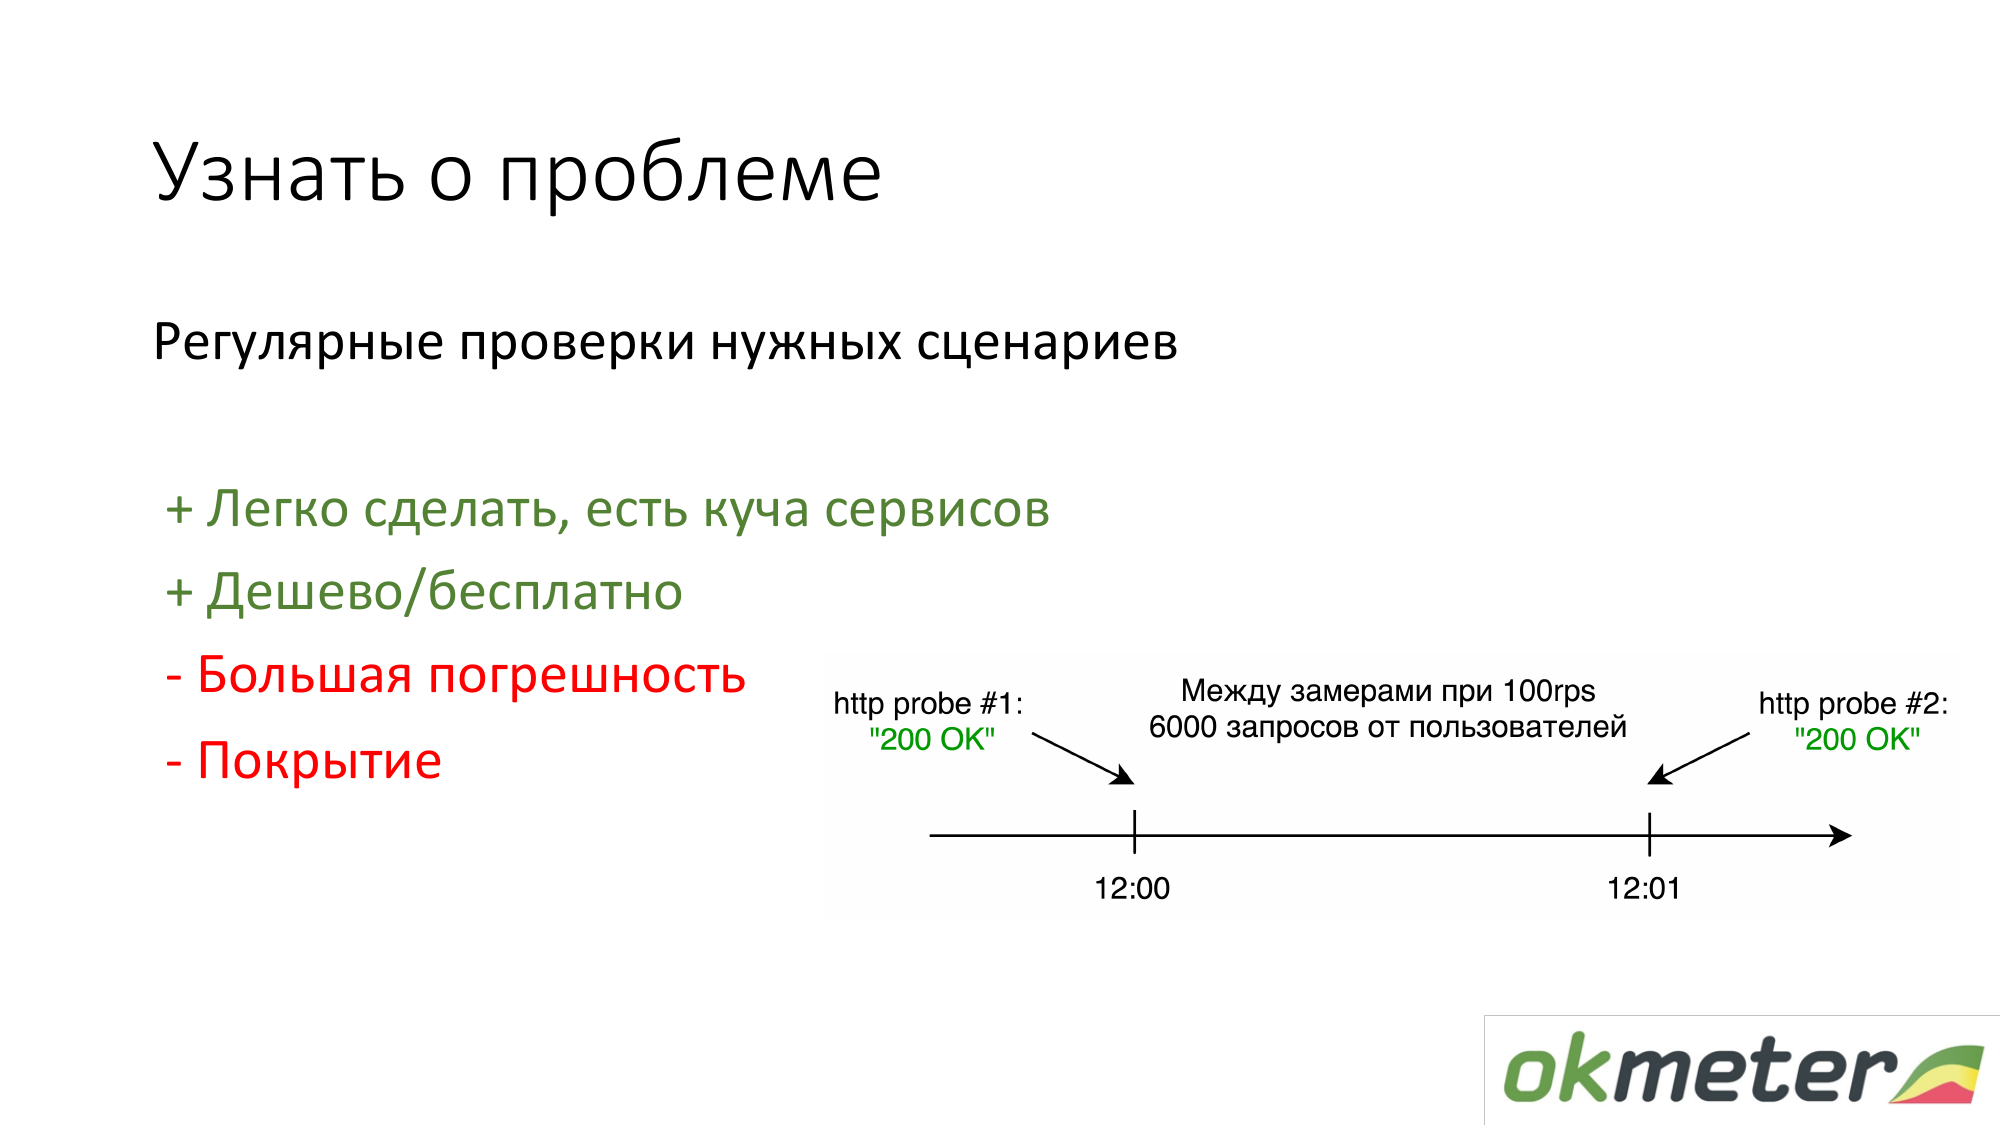
The first thing people who do not have anything to do is put https://www.pingdom.com/ and other services for verification. The advantage of this solution is that it can be done in 5 minutes. You will no longer learn about the problem from customer calls. There are problems with accuracy so that they skip problems. But for simple sites, this is enough.
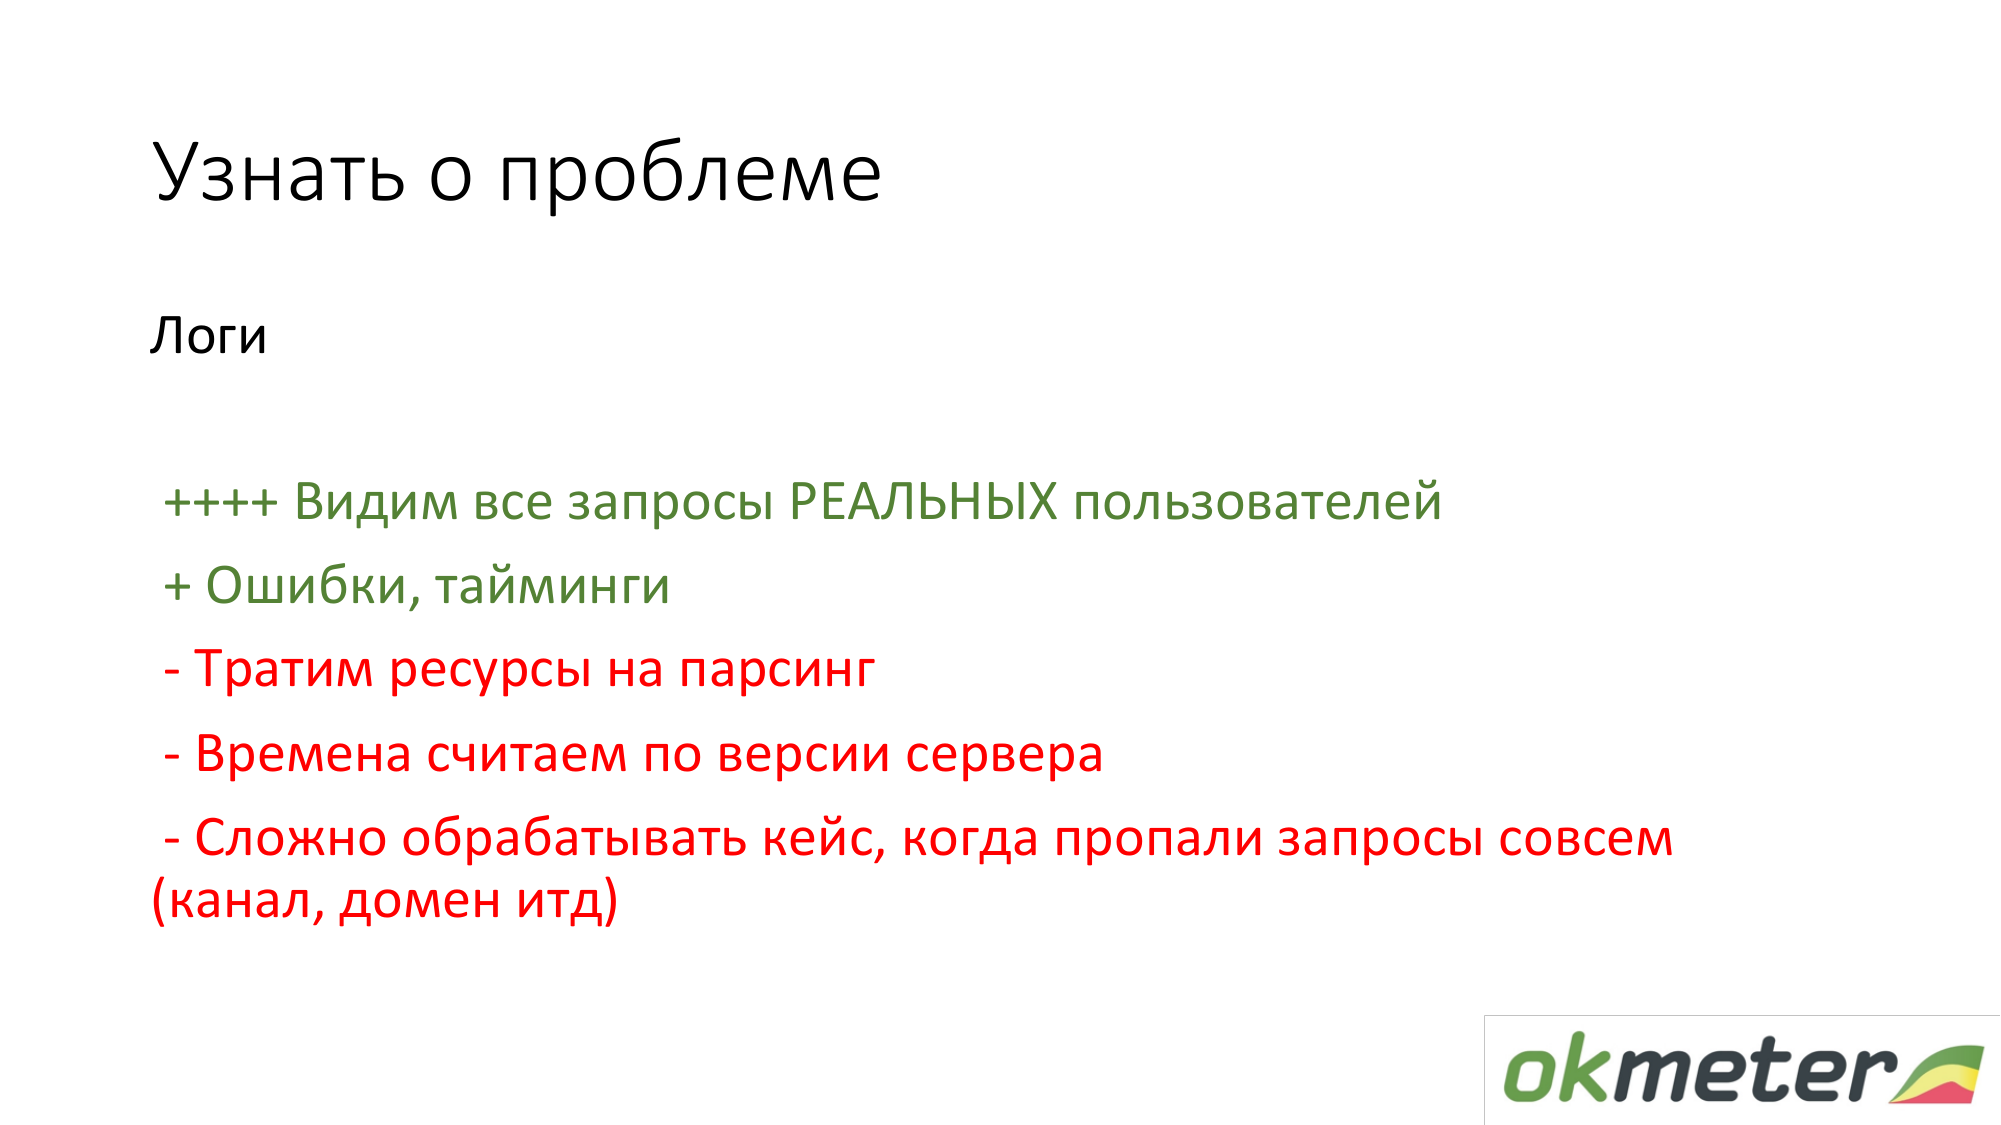
The second thing we are promoting is to look at the logs for statistics of real users. That is how much a particular user gets 5xx errors. What is the response time by users. There are disadvantages, but in general, such a thing works.

About nginx: we made it so that any client that comes immediately puts the agent on the front-end and it immediately picks up everything automatically, starts parsing, errors start to appear, and so on. He has almost nothing to configure.
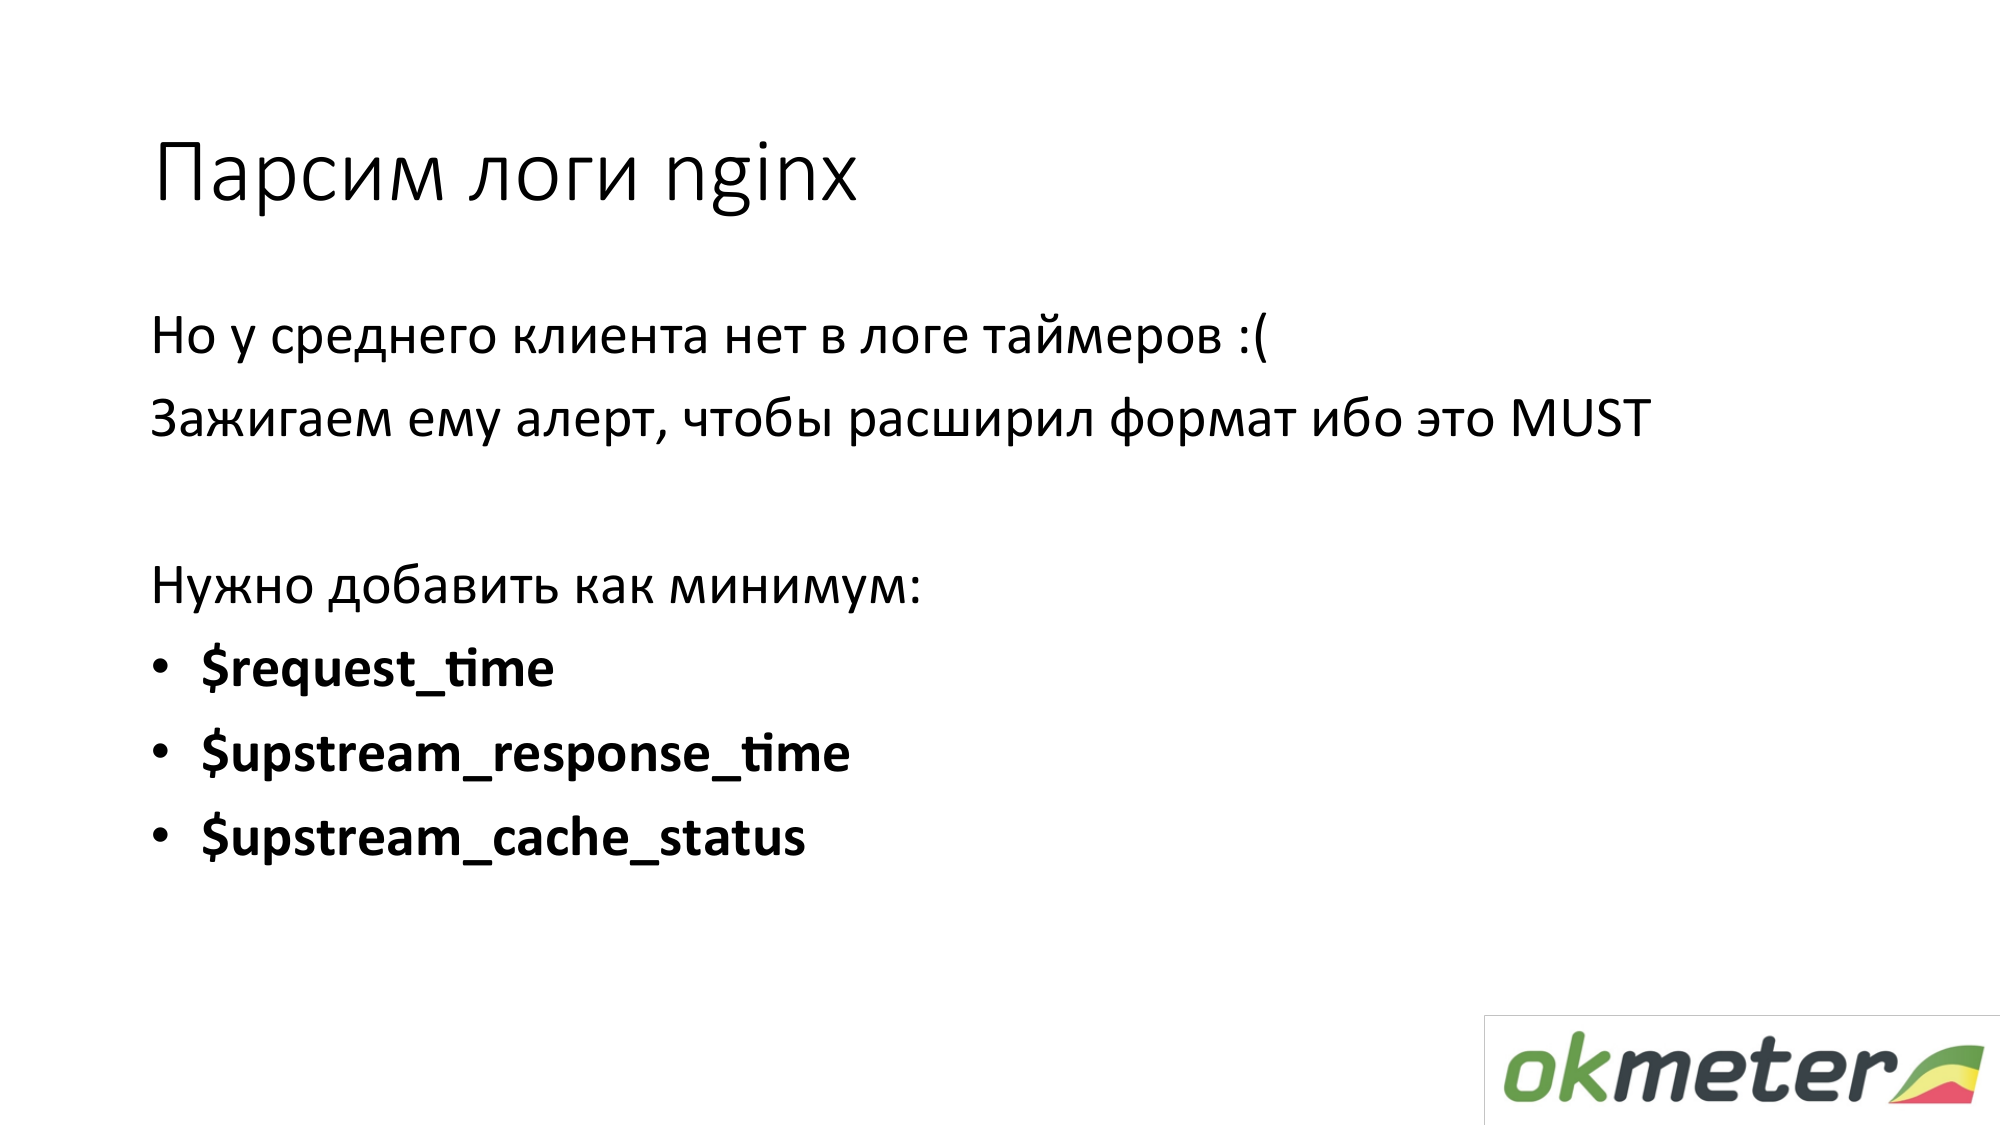
But most clients do not have timers in the standard nginx logs. This 90 percent of customers do not want to know the response time of their site. We are faced with this all the time. It is necessary to expand the nginx log. Then out of the box we automatically start showing histograms out of the box. This is probably an important aspect of the fact that time must be measured.
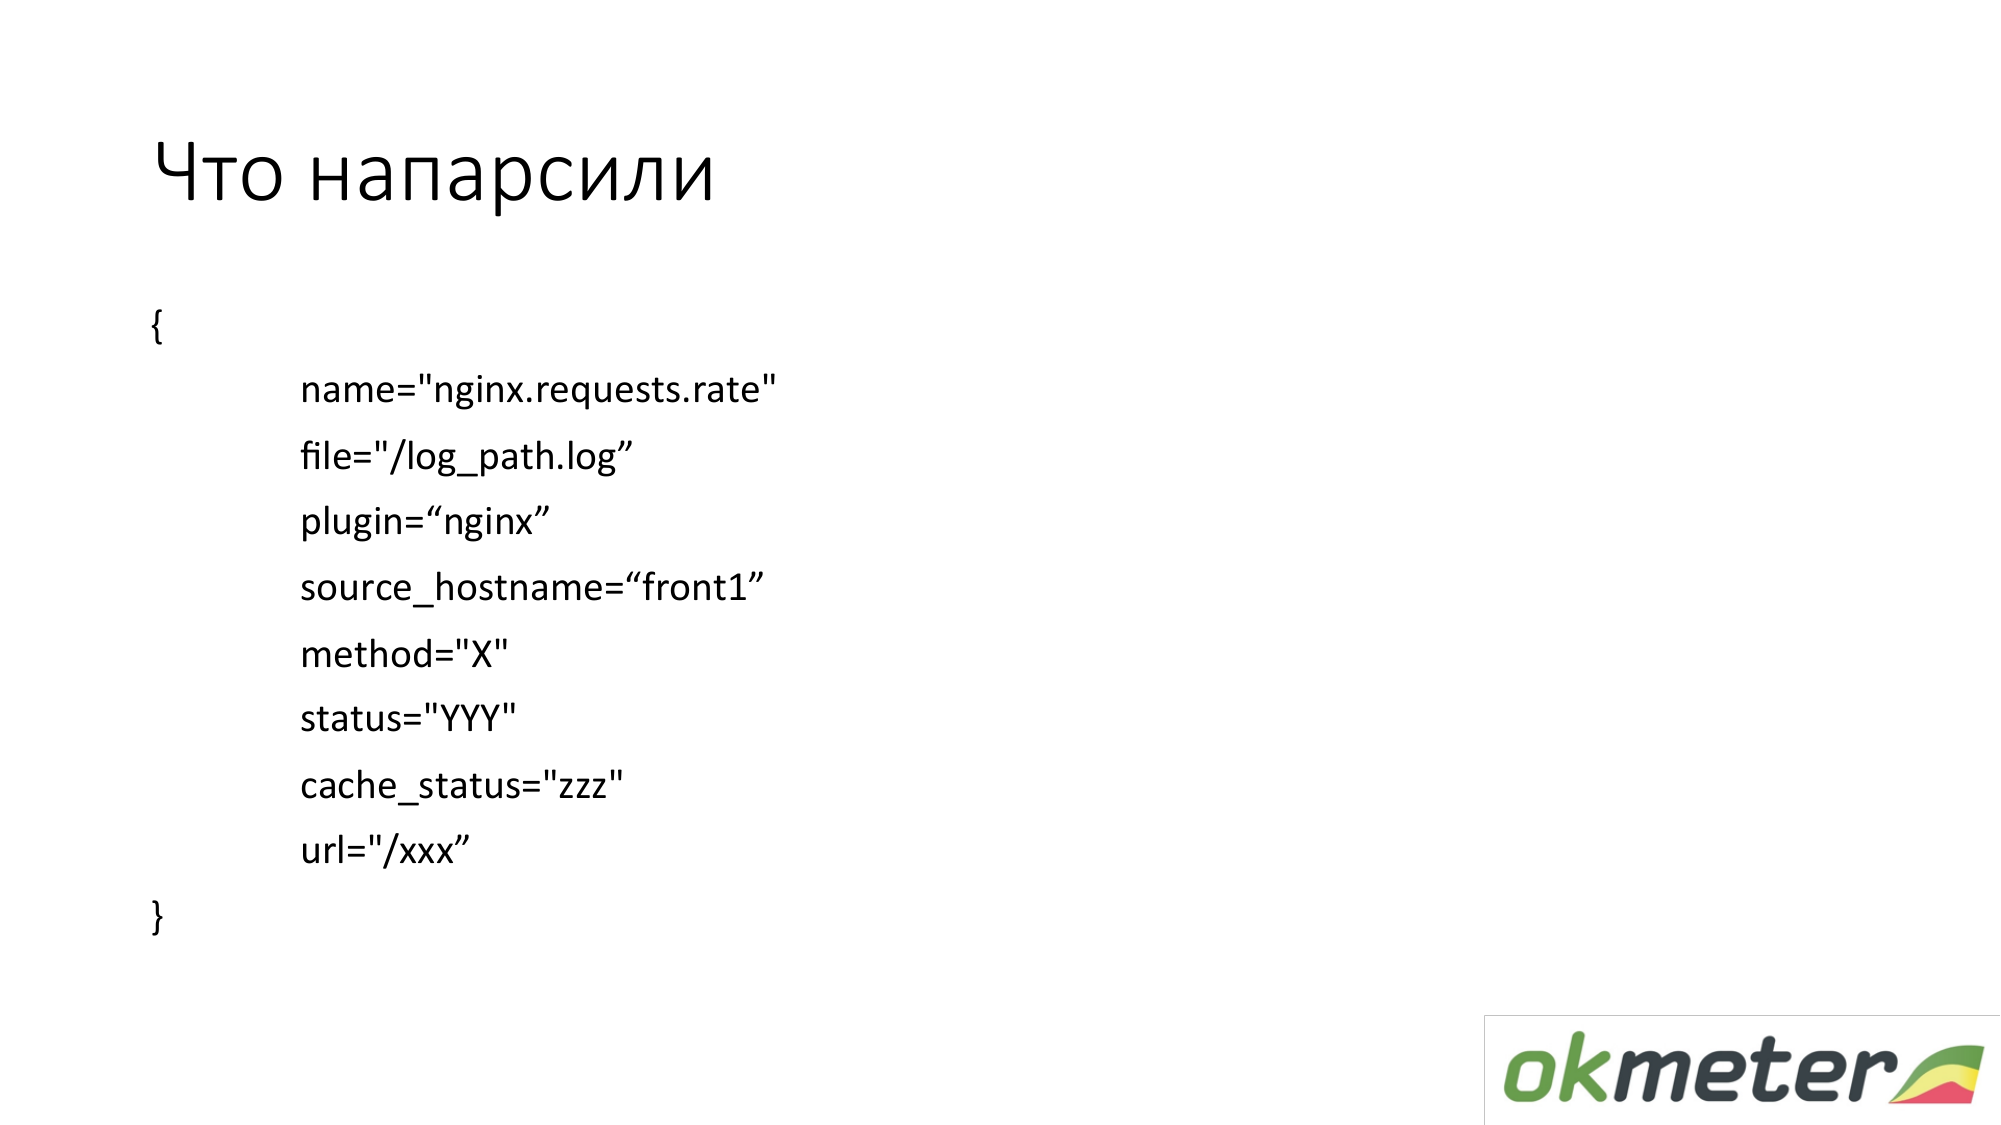
What are we pulling out of there? In practice, we take metrics in such dimensions. These are not flat metrics. The metric is called index.request.rate - the number of queries per second. It is detailed by:
- the host from which you removed the logs;
- the log from which this data was taken;
- http by method;
- http status;
- cache status.
This is NOT every specific URL with all arguments. We do not want to remove 100,000 metrics from the log.
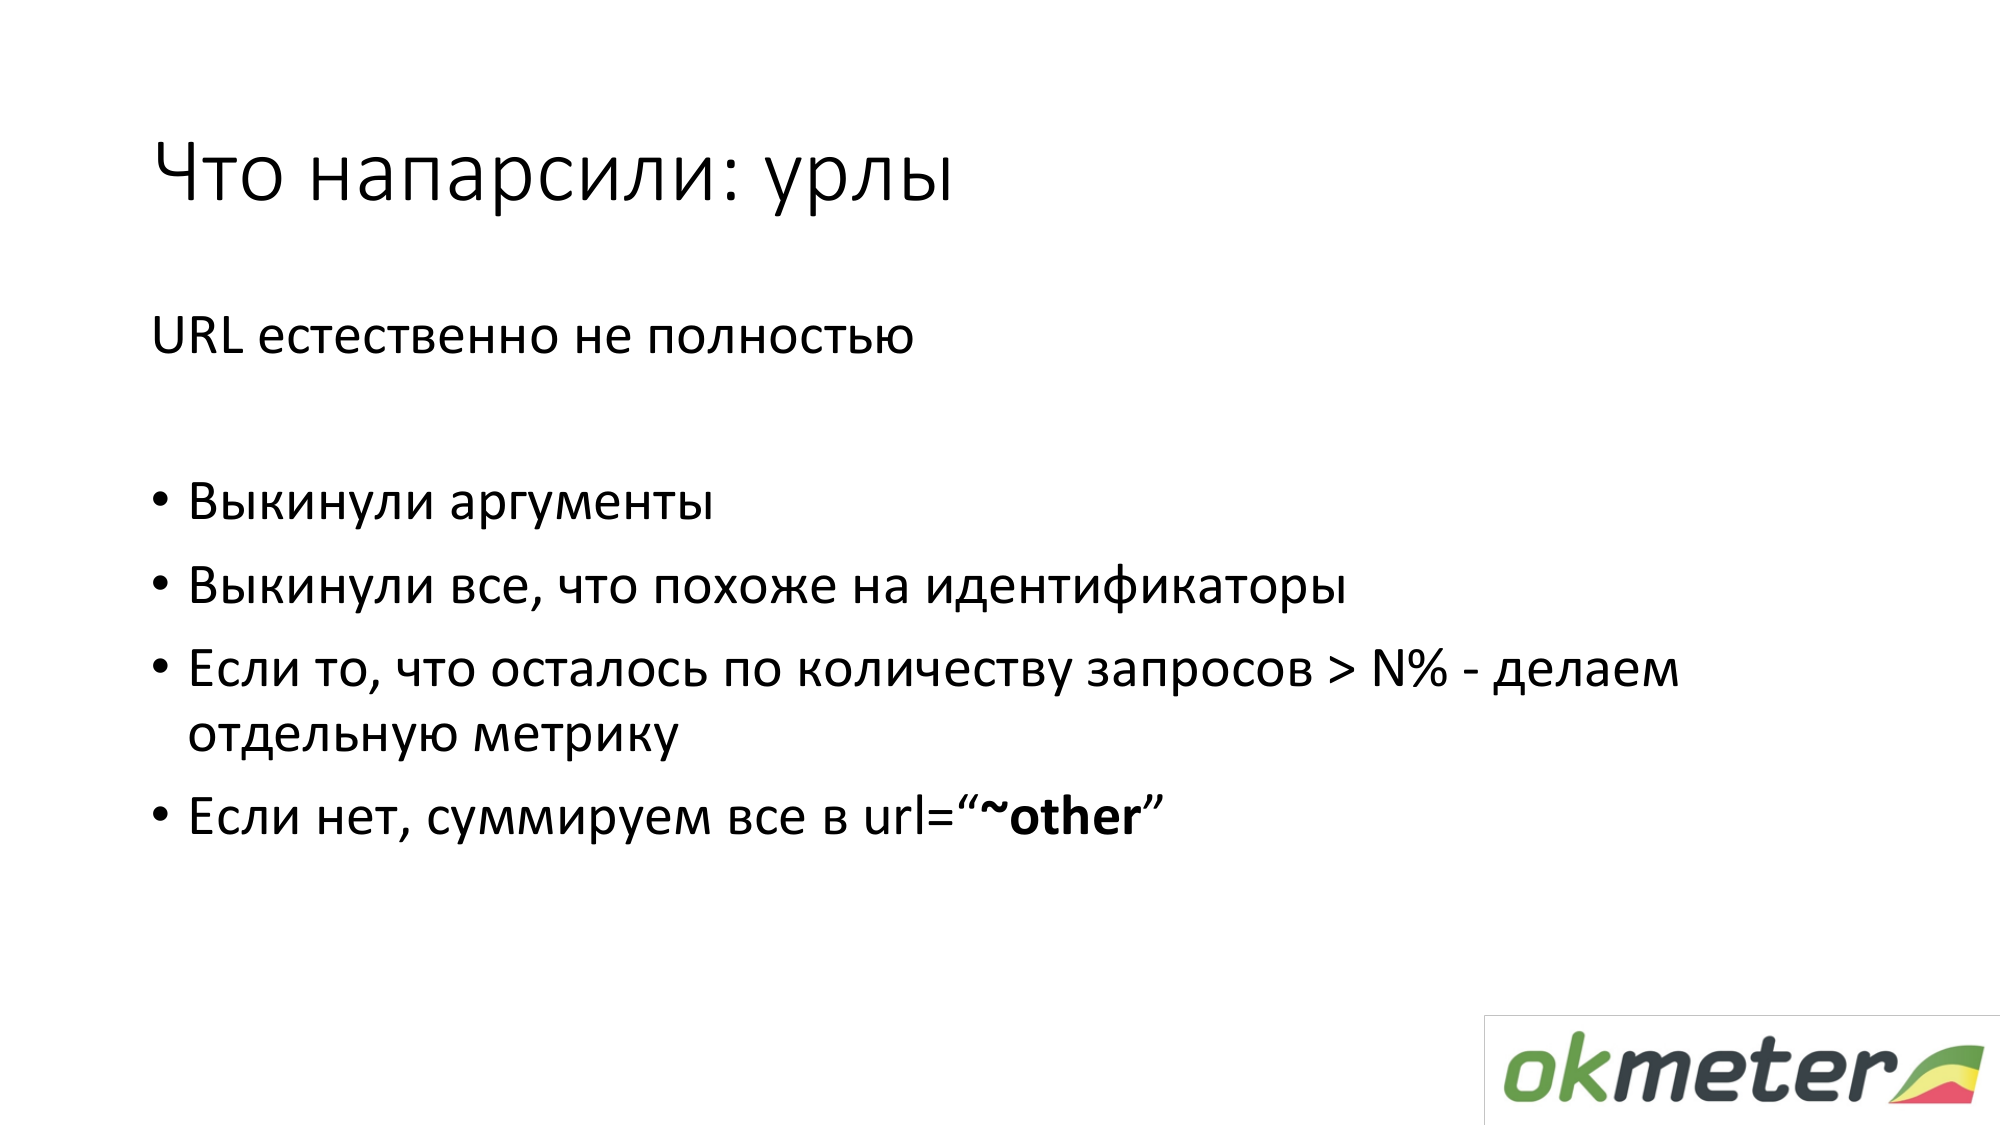
We want to take 1000 metrics. Therefore, we are trying to normalize the URL, if possible. Take the top URL. And for URLs that are meaningful, we show a separate bar graph, separately 5xx.

Here's an example of how this simple metric turns into usable graphics. This is our DSL on top. I tried this DSL to explain the approximate logic. We took all the nginx request per second and laid them out on all the machines that we have. Got knowledge about how we balance it, how much we have total RPS (request per second, requests per second).

On the other hand, we can filter this metric and show only 4xx. On a 4xx chart, they can be laid out according to the status that is real. I remind you this is the same metric.

On the graph, you can show 4xx by URL. This is the same metric.
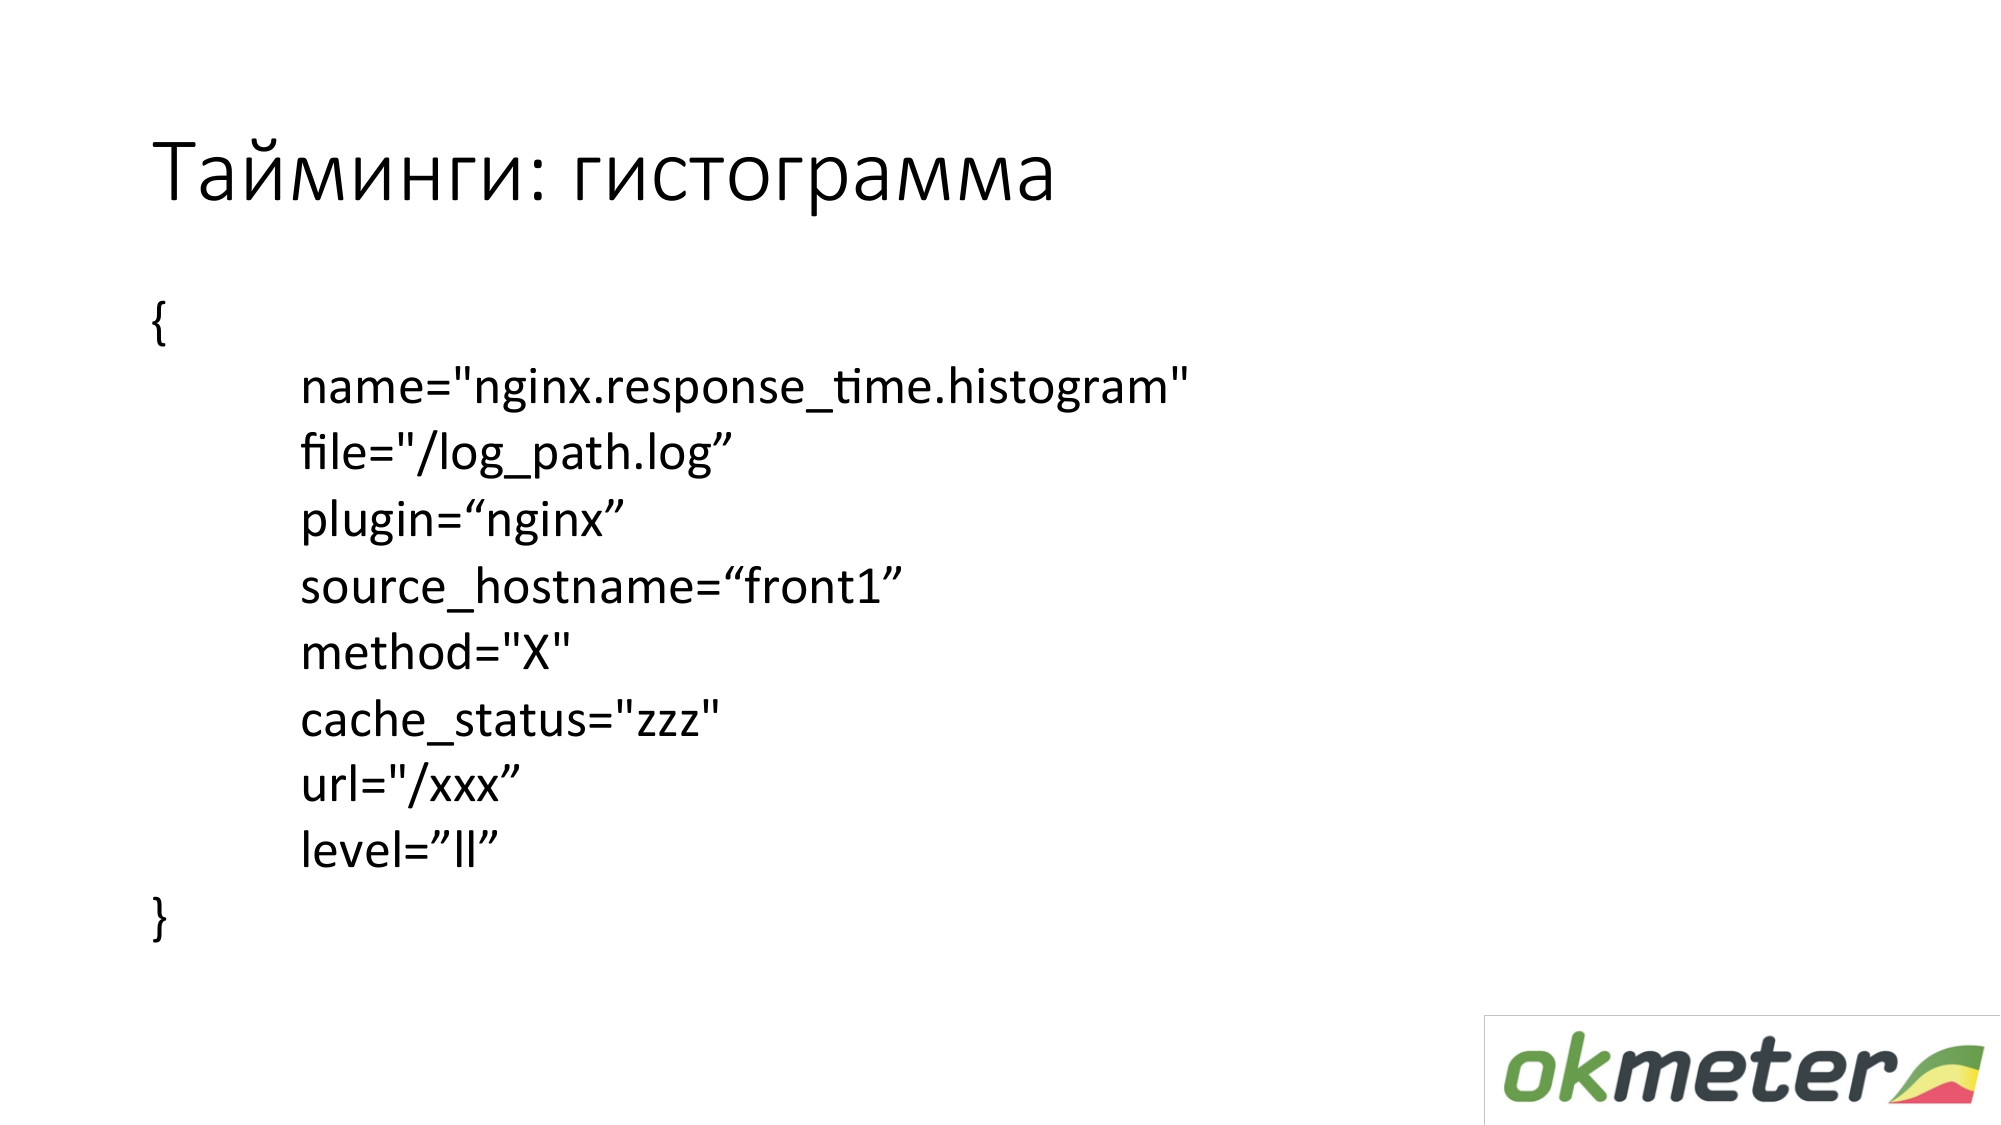
We also remove a histogram from the logs. A histogram is the response_time.histrogram metric, which is actually RPS with an additional level parameter. This is just a cut-off of time in which bucket the request gets.
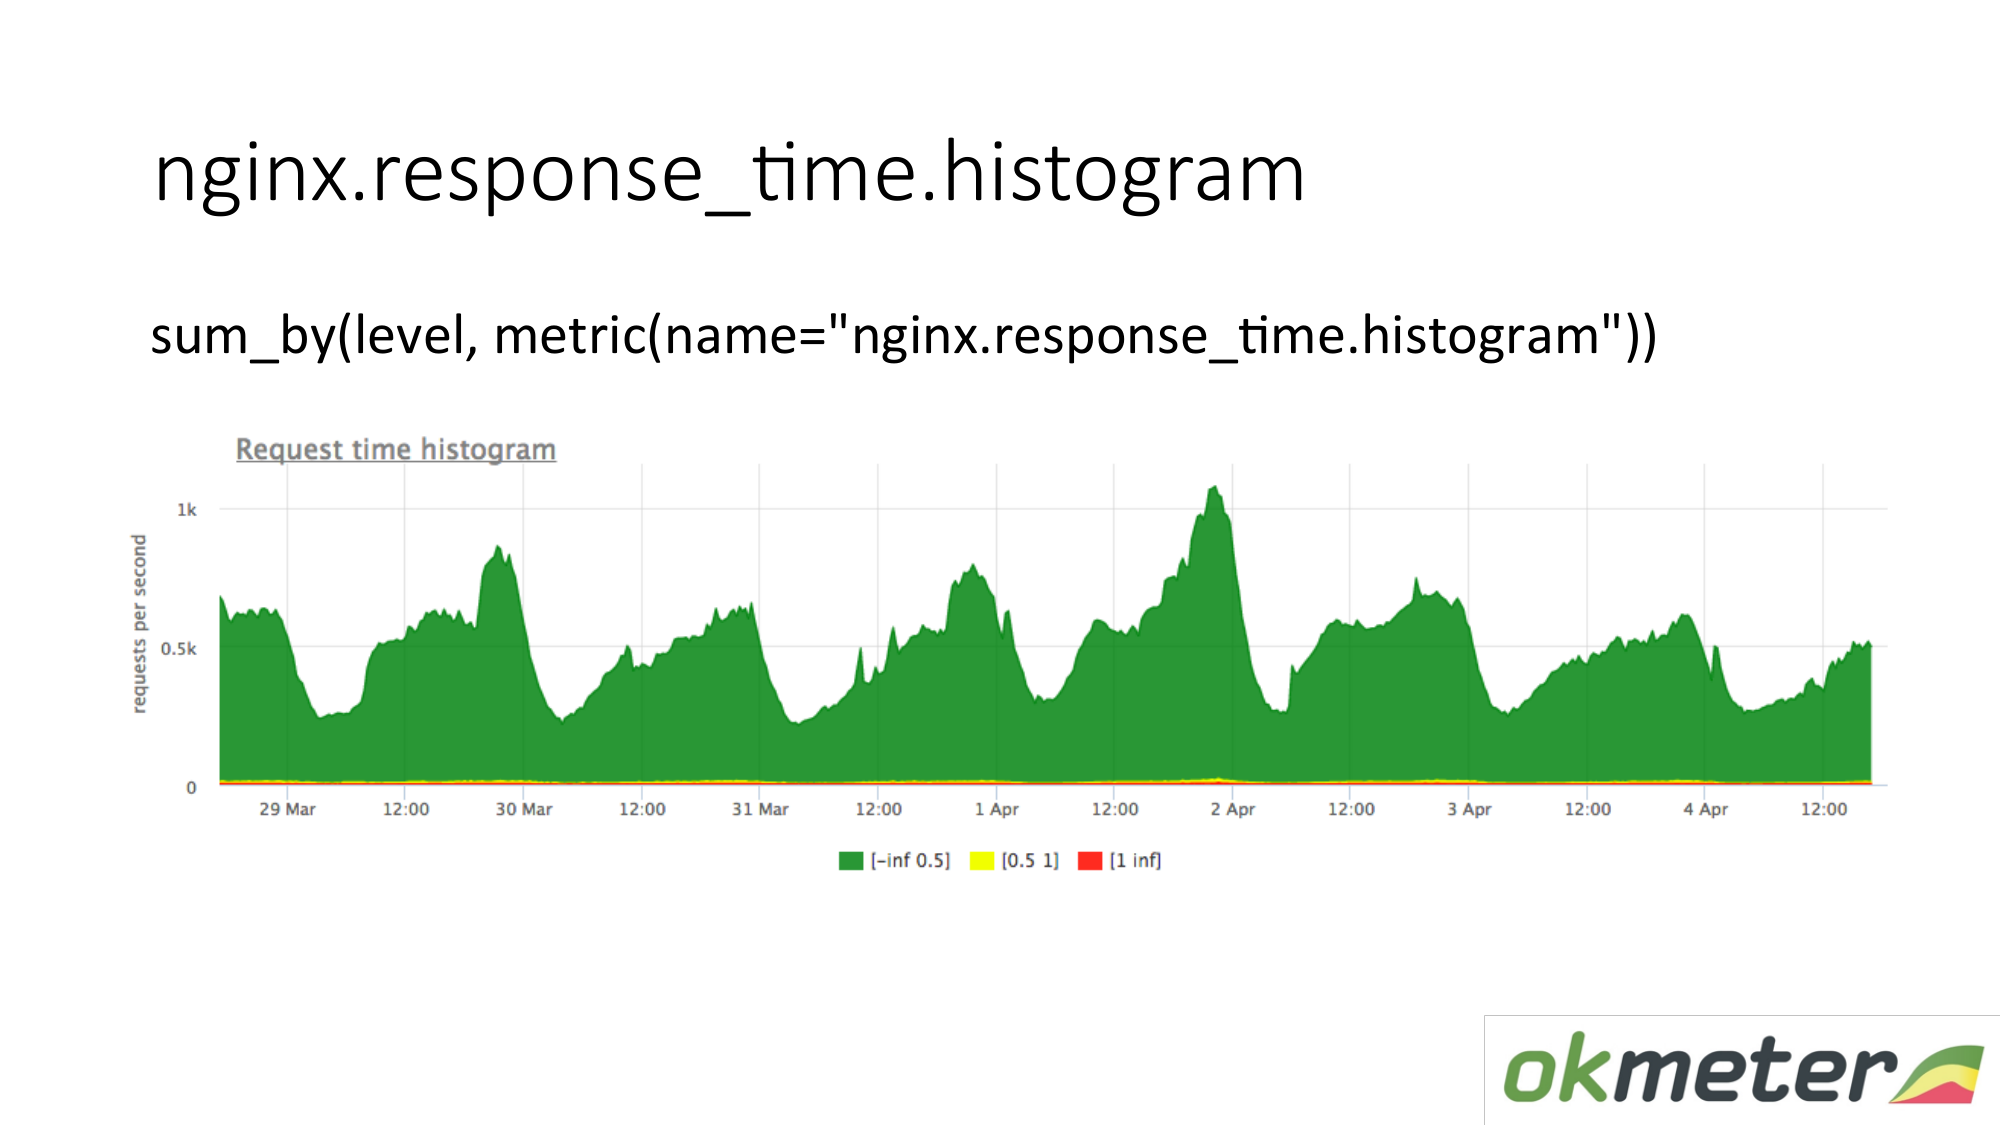
We draw a request: summarize the entire histogram and sort it into levels:
- Slow requests
- quick requests;
- average queries;
We have a picture that has already been summed up by servers. The metric is the same. Its physical meaning is understandable. But we take advantage of it in completely different ways.
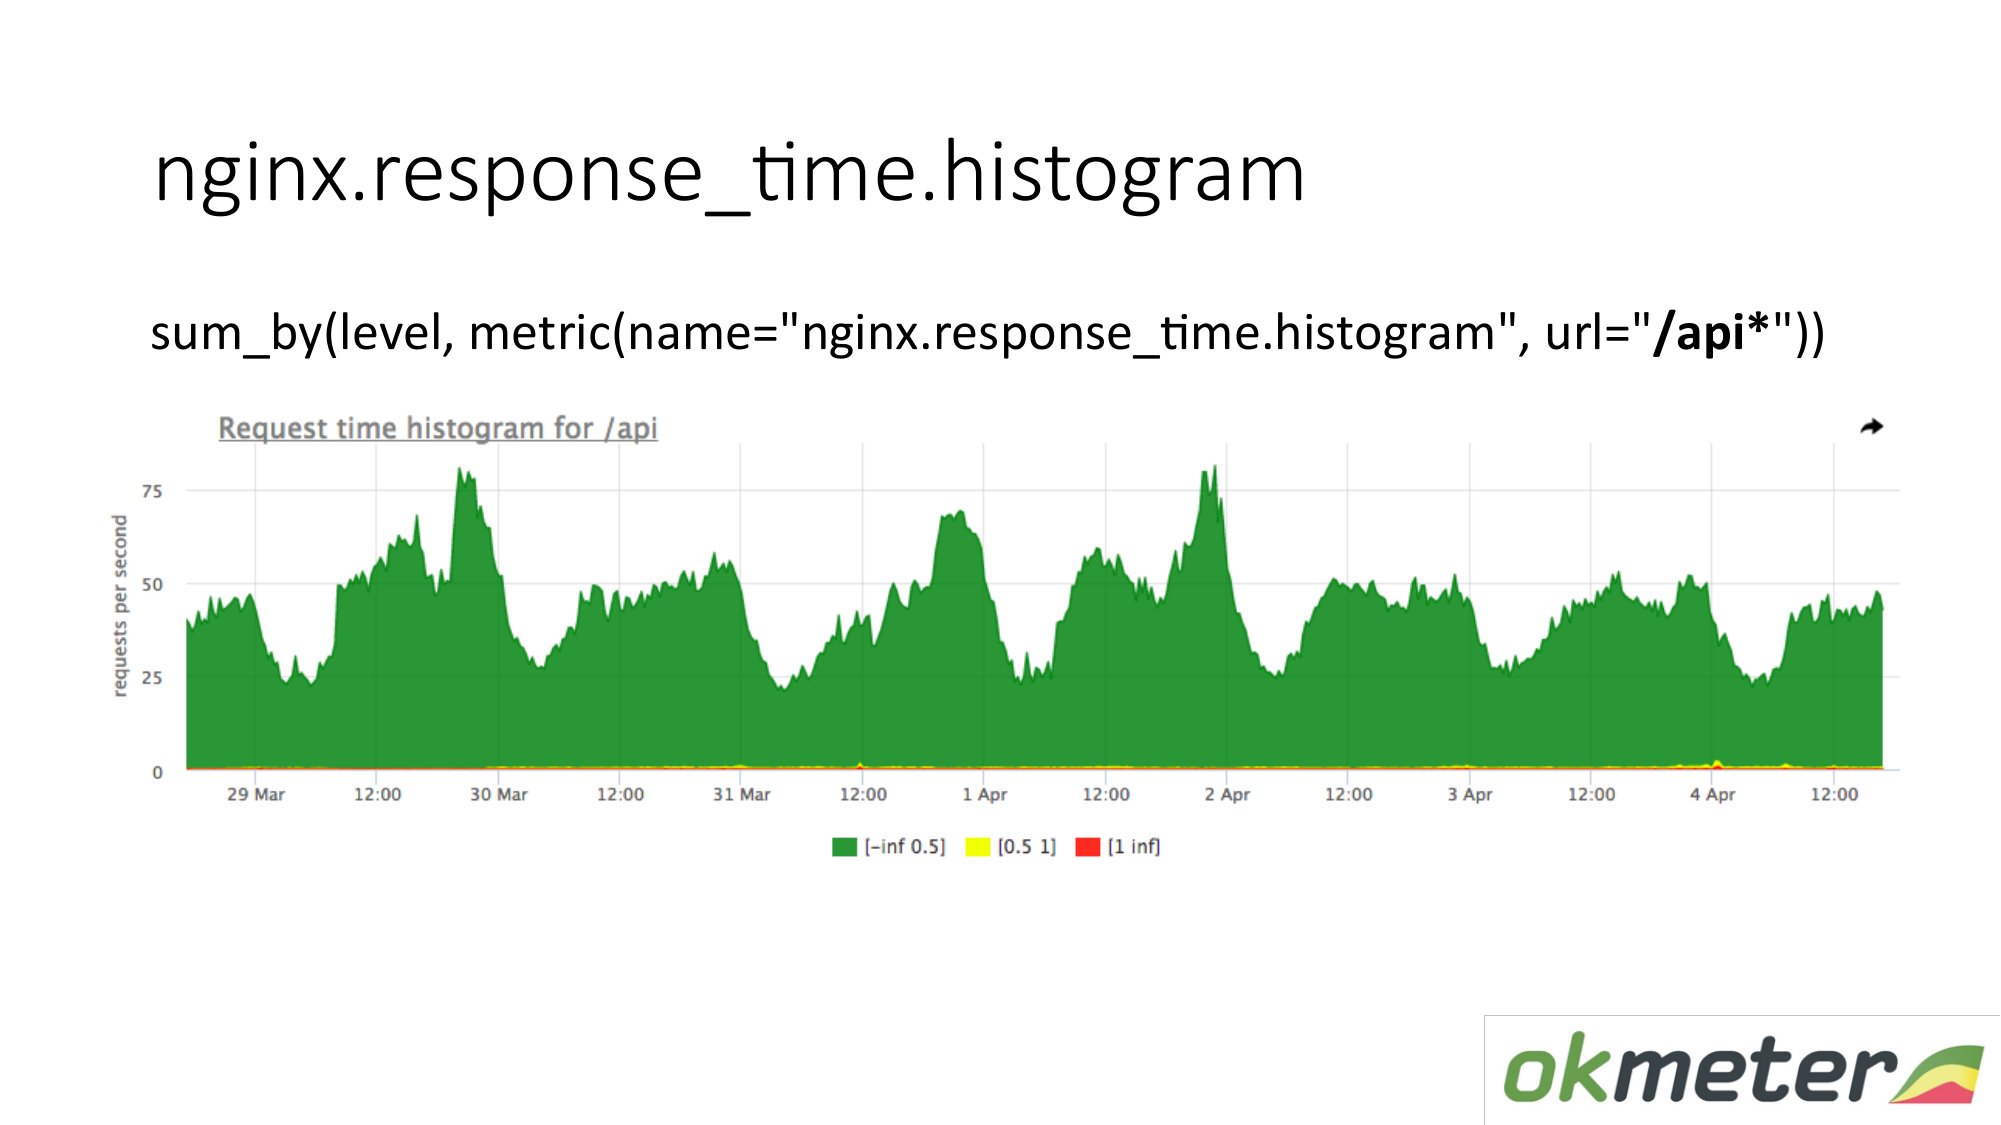
On the chart, you can show the histogram only by URL starting with "/ api". Thus we look at the histogram separately. We look at how much at this moment. We see how many RPS were in the "/ api" URL. The same metric, but a different application.
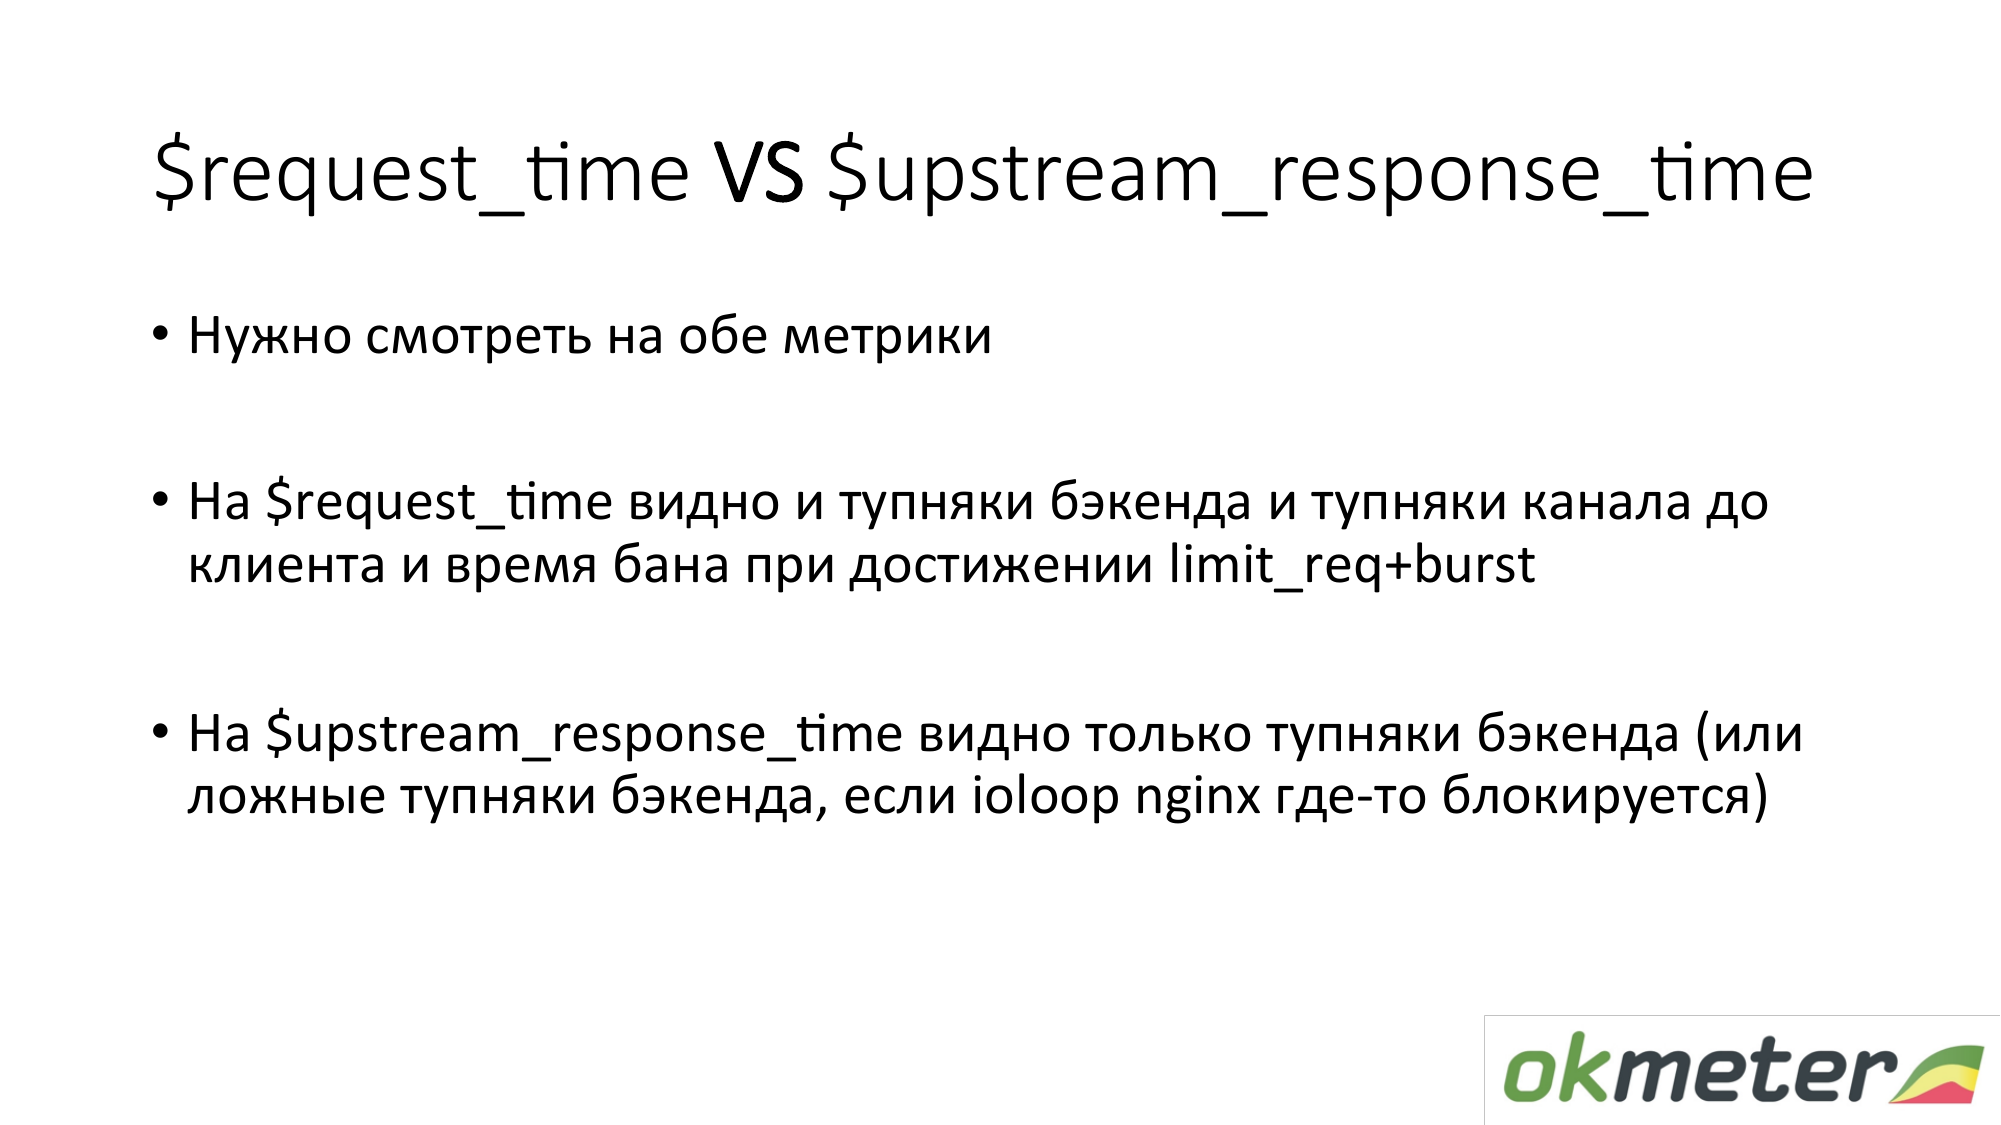
A few words about timings in nginx. There is request_time, which includes the time from the start of the request to the transfer of the last byte to the socket to the client. And there is upstream_response_time. They need to be measured both. If we simply remove request_time, then there you will see delays due to client connectivity problems with your server, you will see delays there if we have limit request c burst configured and the client in the bath. You will not understand whether you need to repair the server or call the hoster. Accordingly, we remove both and it is approximately clear what is happening.

With the task of understanding whether the site is working or not, I believe that we have more or less sorted it out. There are errors. There are inaccuracies. General principles are as follows.
Now about monitoring multi-tier architecture. Because even the simplest online store has at least a frontend, followed by a bitrix and a base. This is already a lot of links. The general point is that you need to shoot some indicators from each level. That is, the user thinks about frontend. Frontend is thinking about backend. Backend thinks about neighboring backend. And they all think about the base. So, by layers, by dependencies, we go over. We cover everything with some kind of metrics. We get something at the exit.

Why not be limited to one layer? Typically, between the layers is a network. A large network under load is an extremely unstable substance. Therefore, everything happens there. Plus, those measurements that you make on which layer can lie. If you take measurements on layer “A” and layer “B”, and if they interact with each other through the network, then you can compare their readings, find some anomalies and inconsistencies.

About backend. We want to understand how to monitor backend. What to do with it to understand quickly what is happening. I remind you that we have already moved on to the task of minimizing downtime. And about the backend, we standardly suggest understanding:
- How much does this resource eat?
- Are we bumped into any limit?
- What is going on with runtime? For example, the JVM runtime platform, Golang runtime, and other runtime.
- When we have already covered all this, it is interesting to us already closer to our code. We can either use automatic intuometry (statsd, * -metric), which will show us all this. Or instruct yourself by setting timers, counters, etc.
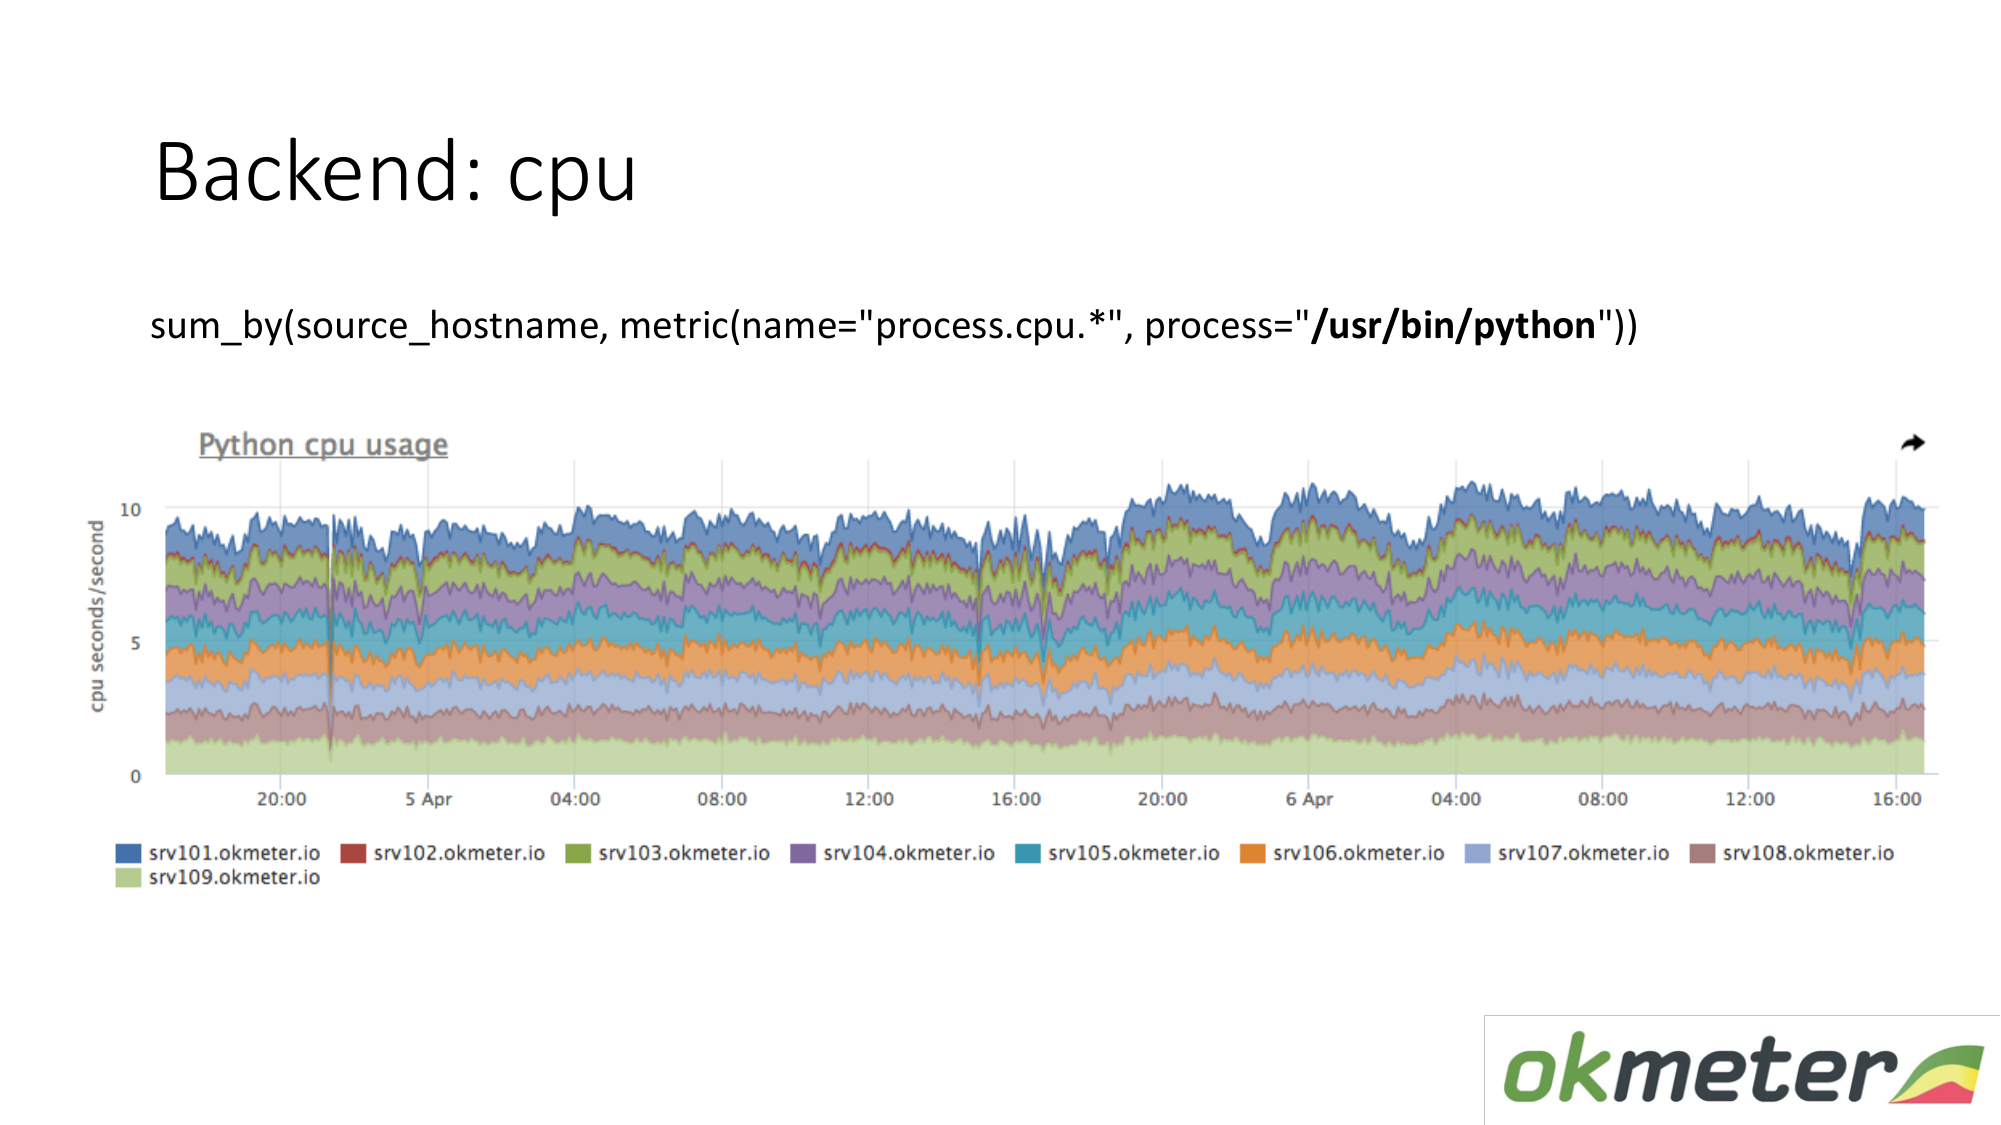
About the resources. Our standard agent removes resource consumption by all processes. Therefore, for the backend, we do not need to separately take data. We take and see how much the CPU consumes the process, for example Python on the masked servers. We show all the servers in the cluster on the same graph, because we want to understand if we have unbalances and if something exploded on the same machine. We see total consumption from yesterday to today.
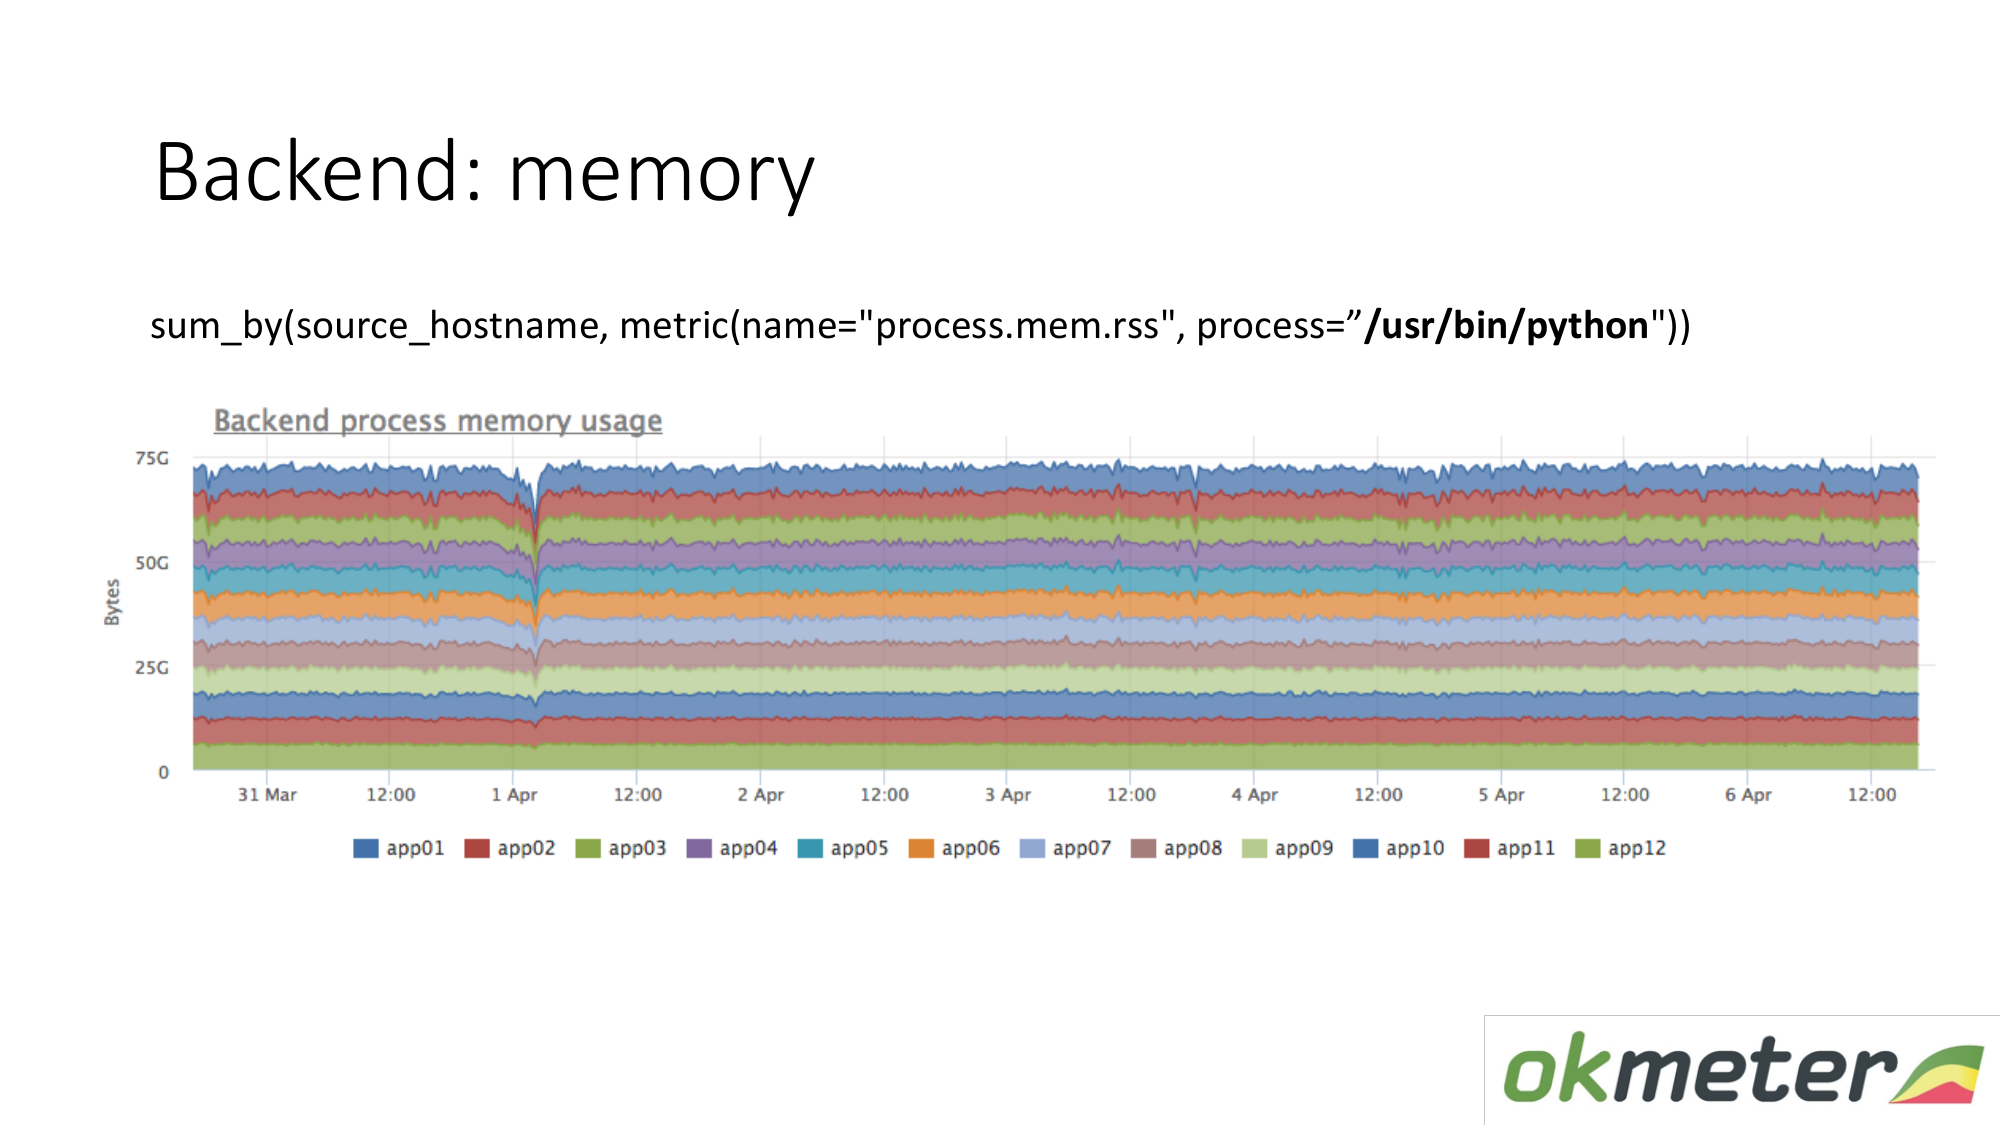
The same goes for memory. When we draw it like this. We select Python RSS (RSS is the size of the memory pages allocated to the process by the operating system and currently located in RAM). Sum by host. We look nowhere memory flows. Everywhere memory is distributed evenly. In principle, we received an answer to our questions.
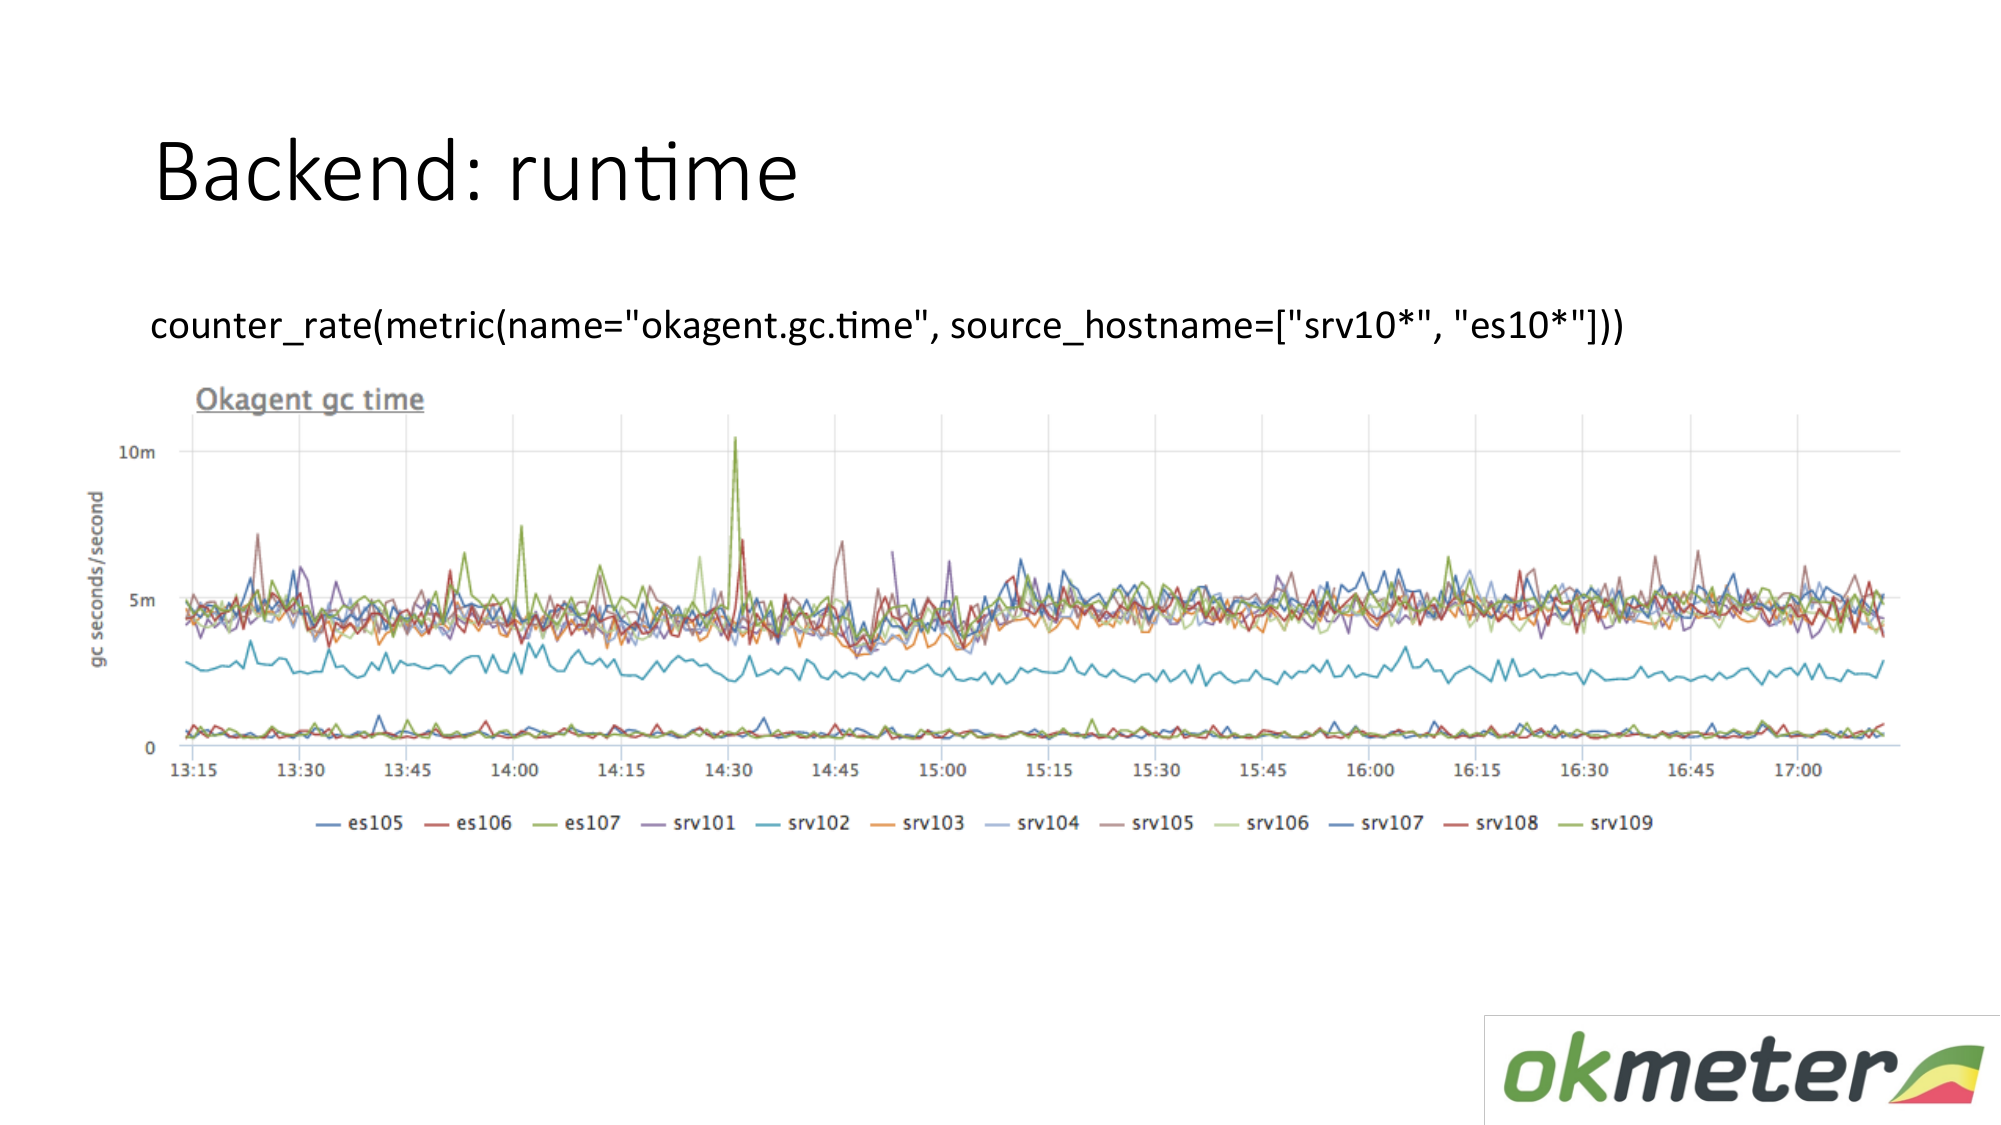
Runtime example. Our agent is written in Golang. Golang agent sends to itself metrics of its runtime. This is in particular the number of seconds spent by the Golang garbage collector on garbage collection per second. We see here that some servers have different metrics from other servers. We saw an anomaly. We are trying to explain this.
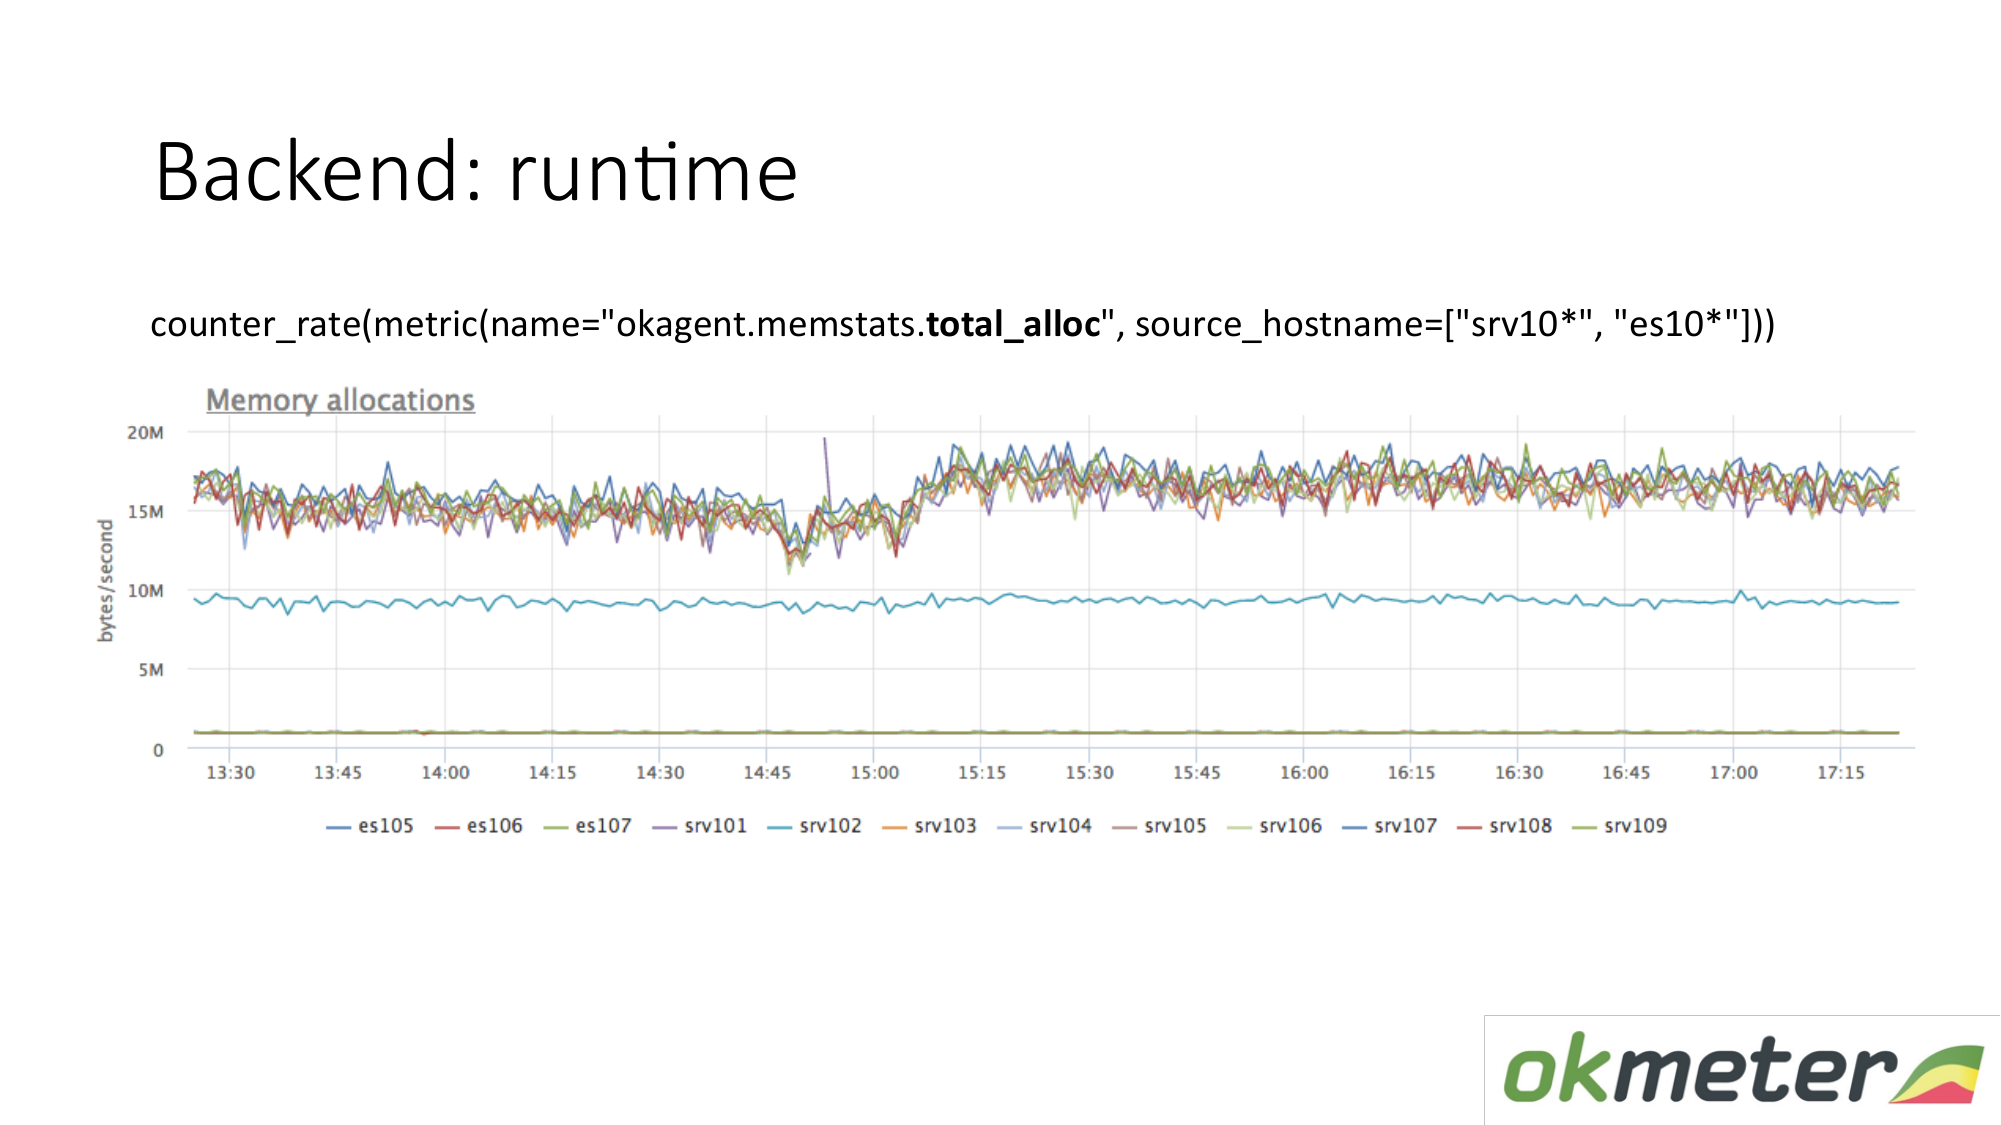
There is another runtime metric. How much memory is allocated per unit of time. We see that agents with a type that are on top allocate more memory than agents that lower. Below are agents with a less aggressive Garbage Collector. This is logical. The more memory that passes through you, is allocated, freed, the greater the load on the Garbage Collector. Further, according to our internal metrics, we understand why we want so much memory on those machines and less on these machines.
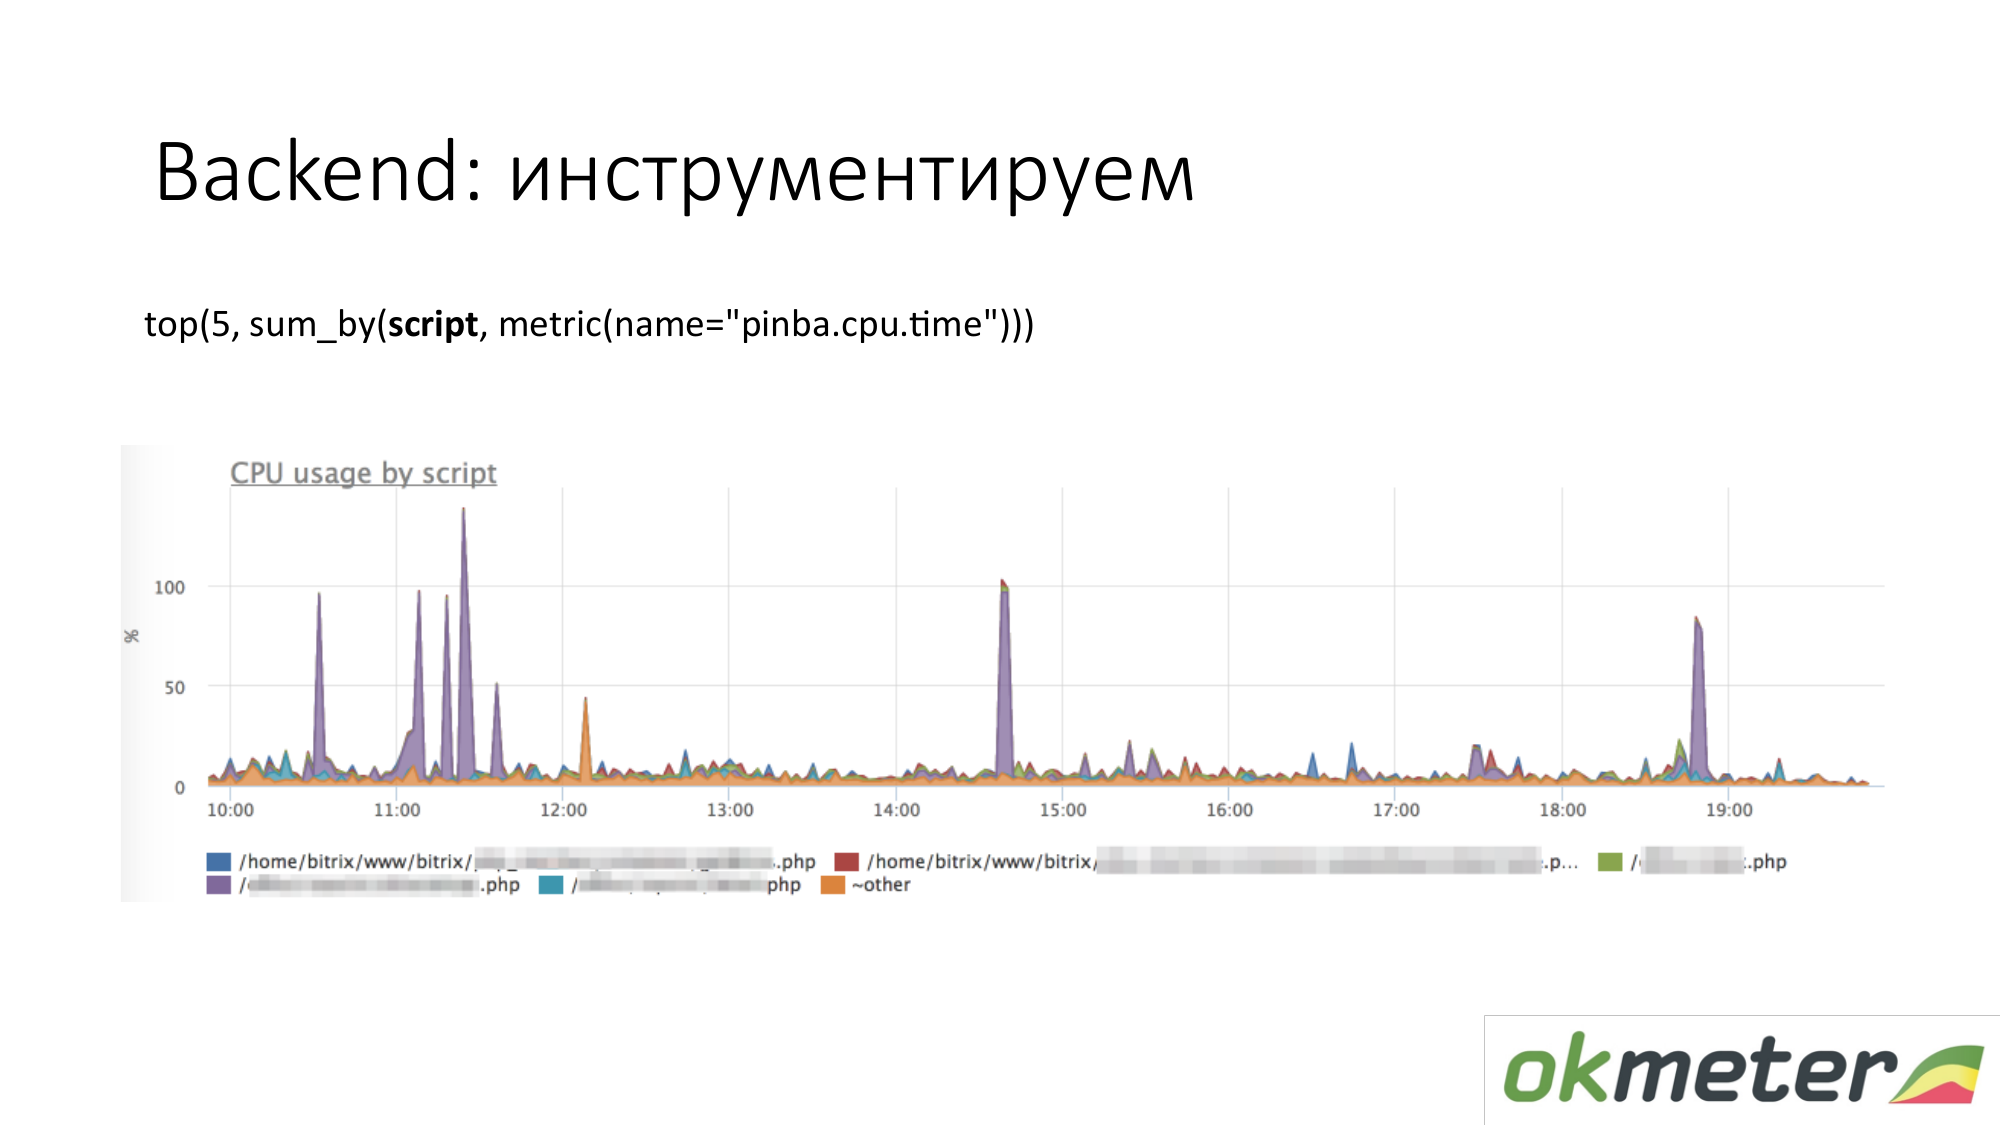
When we talk about instrumentation, all sorts of tools like http://pinba.org/ for php come. Pinba is an extension for php from Badoo, which you install and connect to php. It allows you to immediately remove and send protobuf over UDP. They have a pinba server. But we made an embedded Pinba server in the agent. PHP sends to itself how much it spent CPU and memory for such scripts, how much traffic is given by such scripts, and so on. Here is an example with Pinba. We show the top 5 scripts on CPU consumption. We see a violet outlier that is a smeared point of PHP. We’re going to repair the smeared point of PHP or to understand why it eats up the CPU. We have already narrowed the scope of the problem so that we understand the following steps. We go to look at the code and repair it.

The same goes for traffic. We look at the top 5 traffic scripts. If this is important to us, then we go and understand.

This is a chart about our internal tools. When we set the timer through statsd and measured the metrics. We made it so that the amount of total time spent in the CPU or in anticipation of some resource is laid out by the handler that we are currently processing, and by the important stages of your code: they waited for the cassander, waited for elasticsearch. On the chart you can show the top 5 stages for the / metric / query handler. On the graph, you can show the top 5 handlers for CPU consumption, so what is happening inside. It’s clear what to fix.
About backend you can go deeper. There are things that do tracing. That is, you can see this particular user request with a cookie so-and-so and IP so-and-so generated so many requests to the database, they waited so much time. We are not able to tracing. We are not tracing. We can still believe that we do not do applications and performance monitoring.
About the database. Same. Databases are the same process. He consumes resources. If the base is very sensitive to latency, then there are slightly different features. We propose to check that there are no less resources, there is no degradation in resources. It is ideal to understand that if the base began to consume more than it consumed, then understand what exactly has changed in your code.
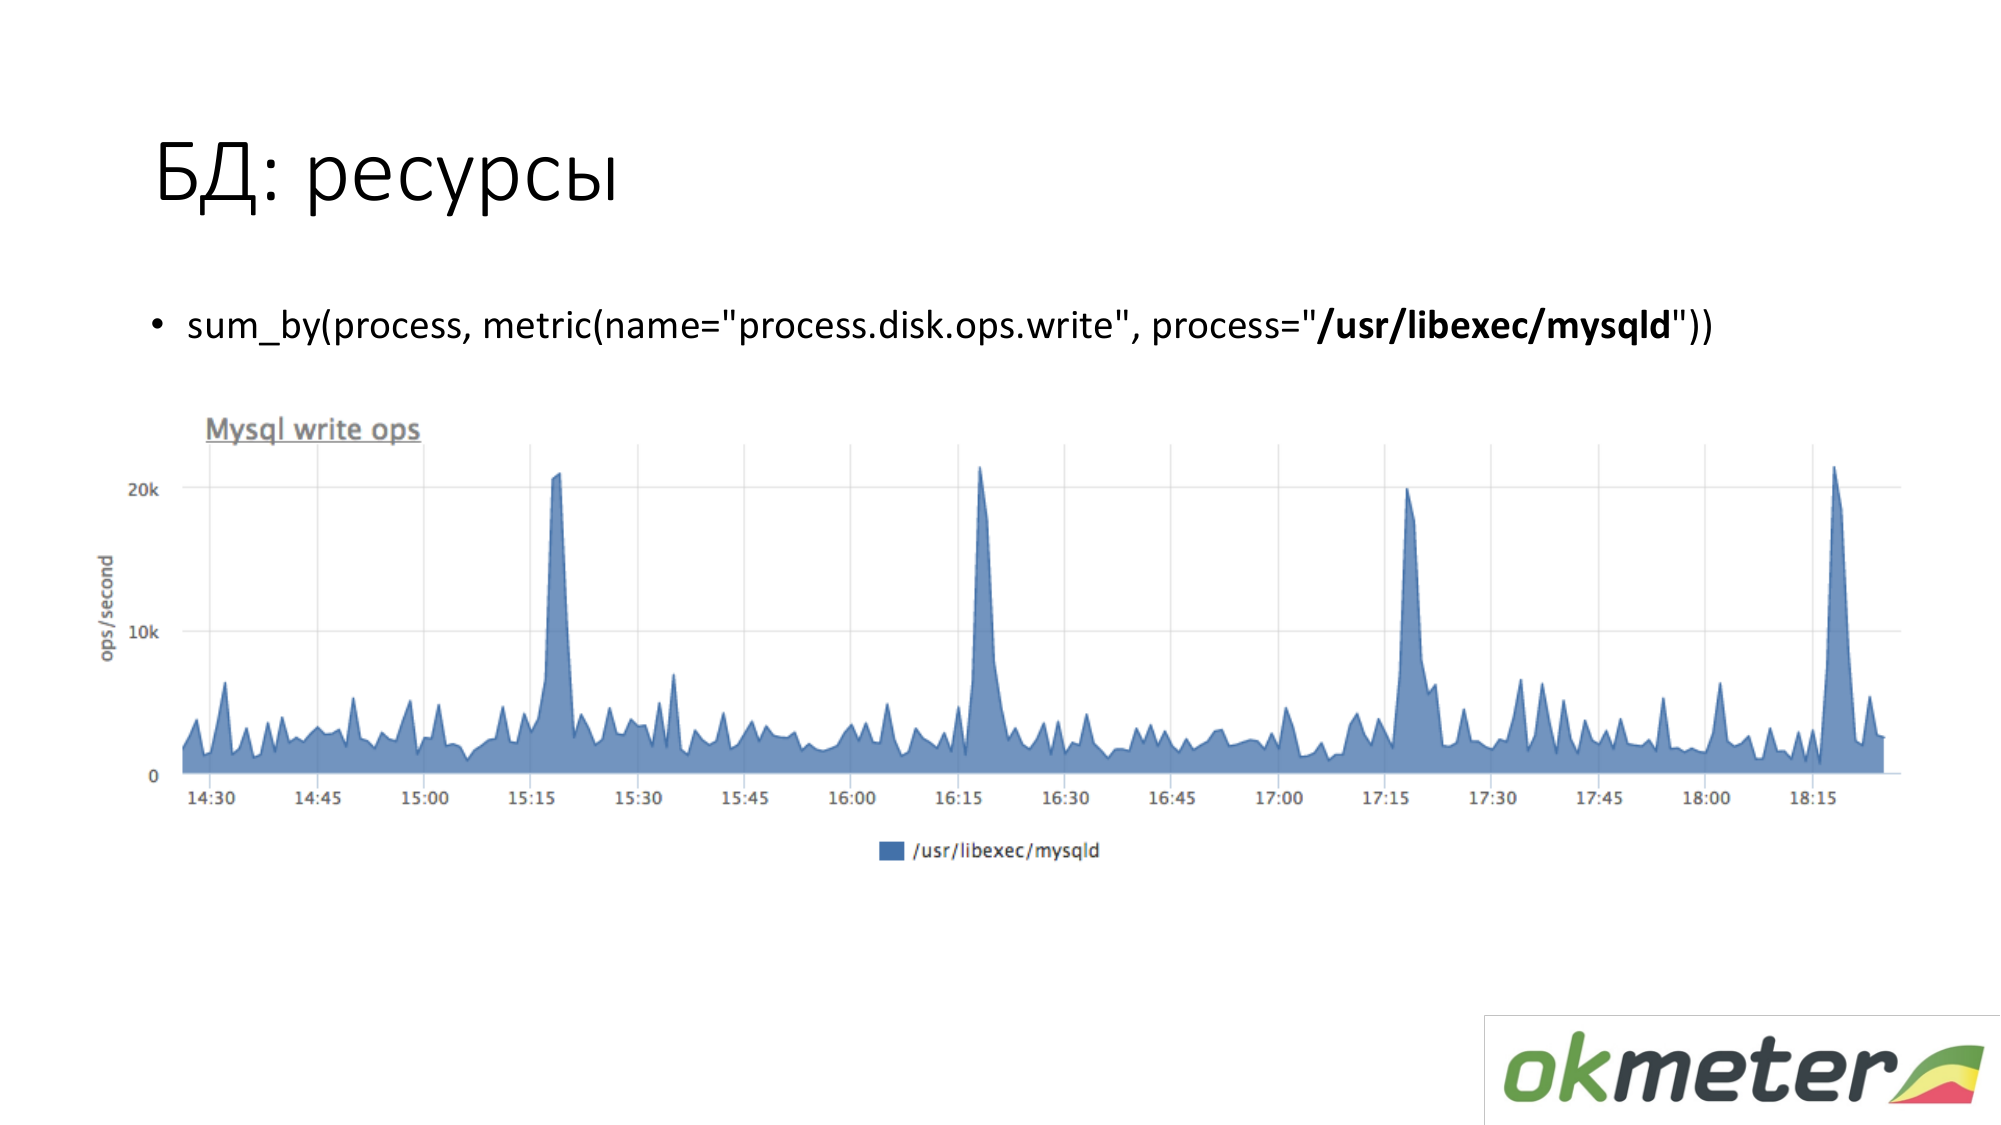
About the resources. In the same way, we look at how long the MySQL process generates disk write operations. We see that on average there is so much, but some kind of peaks happen. For example, a lot of insert arrives there and it starts writing to disk at 15.15, 16.15, 17.15.
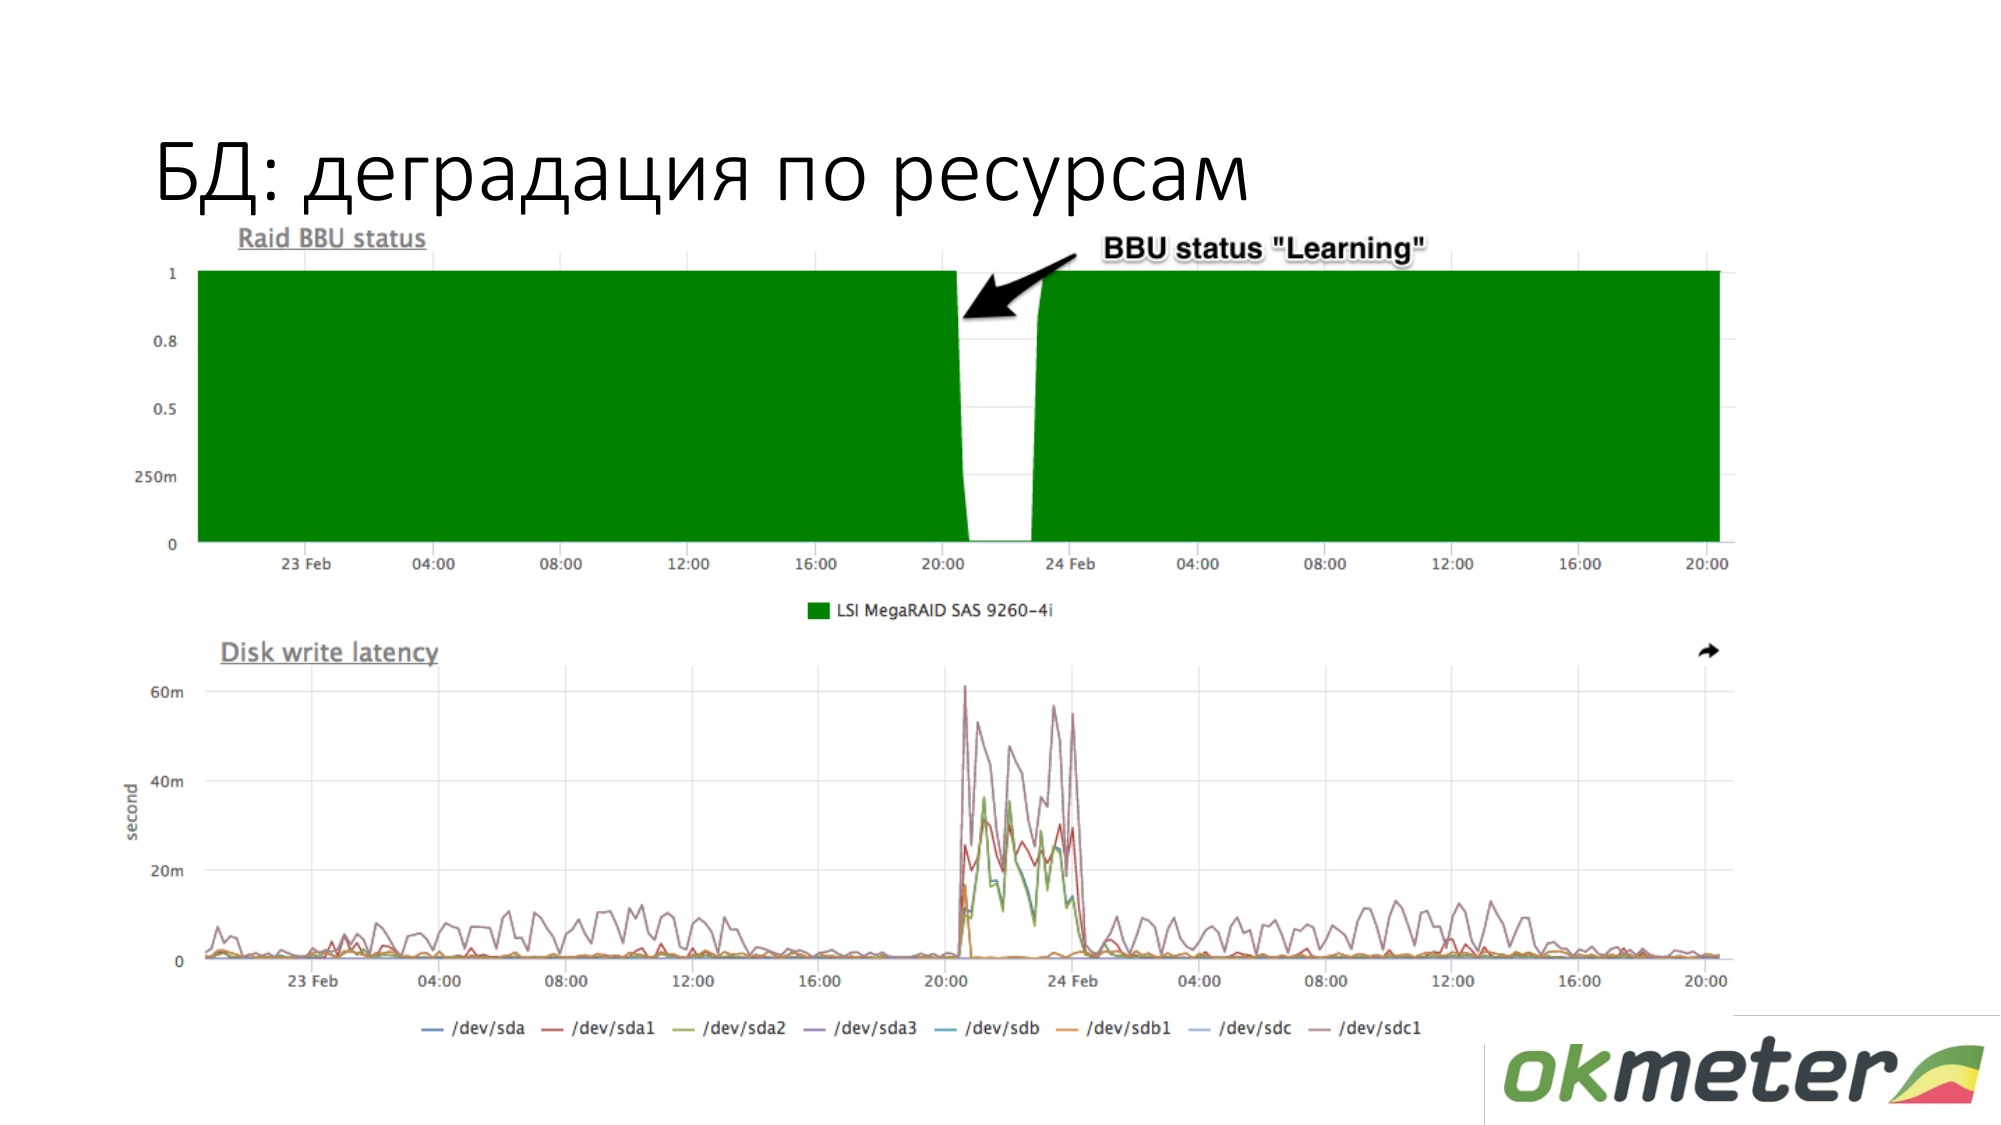
About the degradation of resources. For example, a RAID battery has gone into maintenance mode. She ceased to be a controller like a live battery. At this point, write cache is turned off, the lateny of write disks increases. At this point, if the database started to dull while waiting for the disk, and you know roughly that with the same load on your writing to the disk latency was different, then check the battery in RAID.

Resources on Demand. It's not that simple. Depends on the base. The base should be able to tell about itself: what requests it spends resources, etc. The leader in this is PostgreSQL. He has pg_stat_statements. You can understand what request you use a lot of CPU, read and write disk, traffic.
In MySQL, to be honest, everything is much worse. It has performance_schema. It somehow works from version 5.7. Unlike a single view in PostgreSQL, performance_schema is a 27 or 23 system view table in MySQL. Sometimes, if you make queries on the wrong tables (on the wrong view), you can squander MySQL.
Redis has team statistics. You see that a certain command uses a lot of CPU, etc.
Cassandra has times for querying specific tables. But since the cassandra is designed so that one type of query is made to the table, this is enough for monitoring.
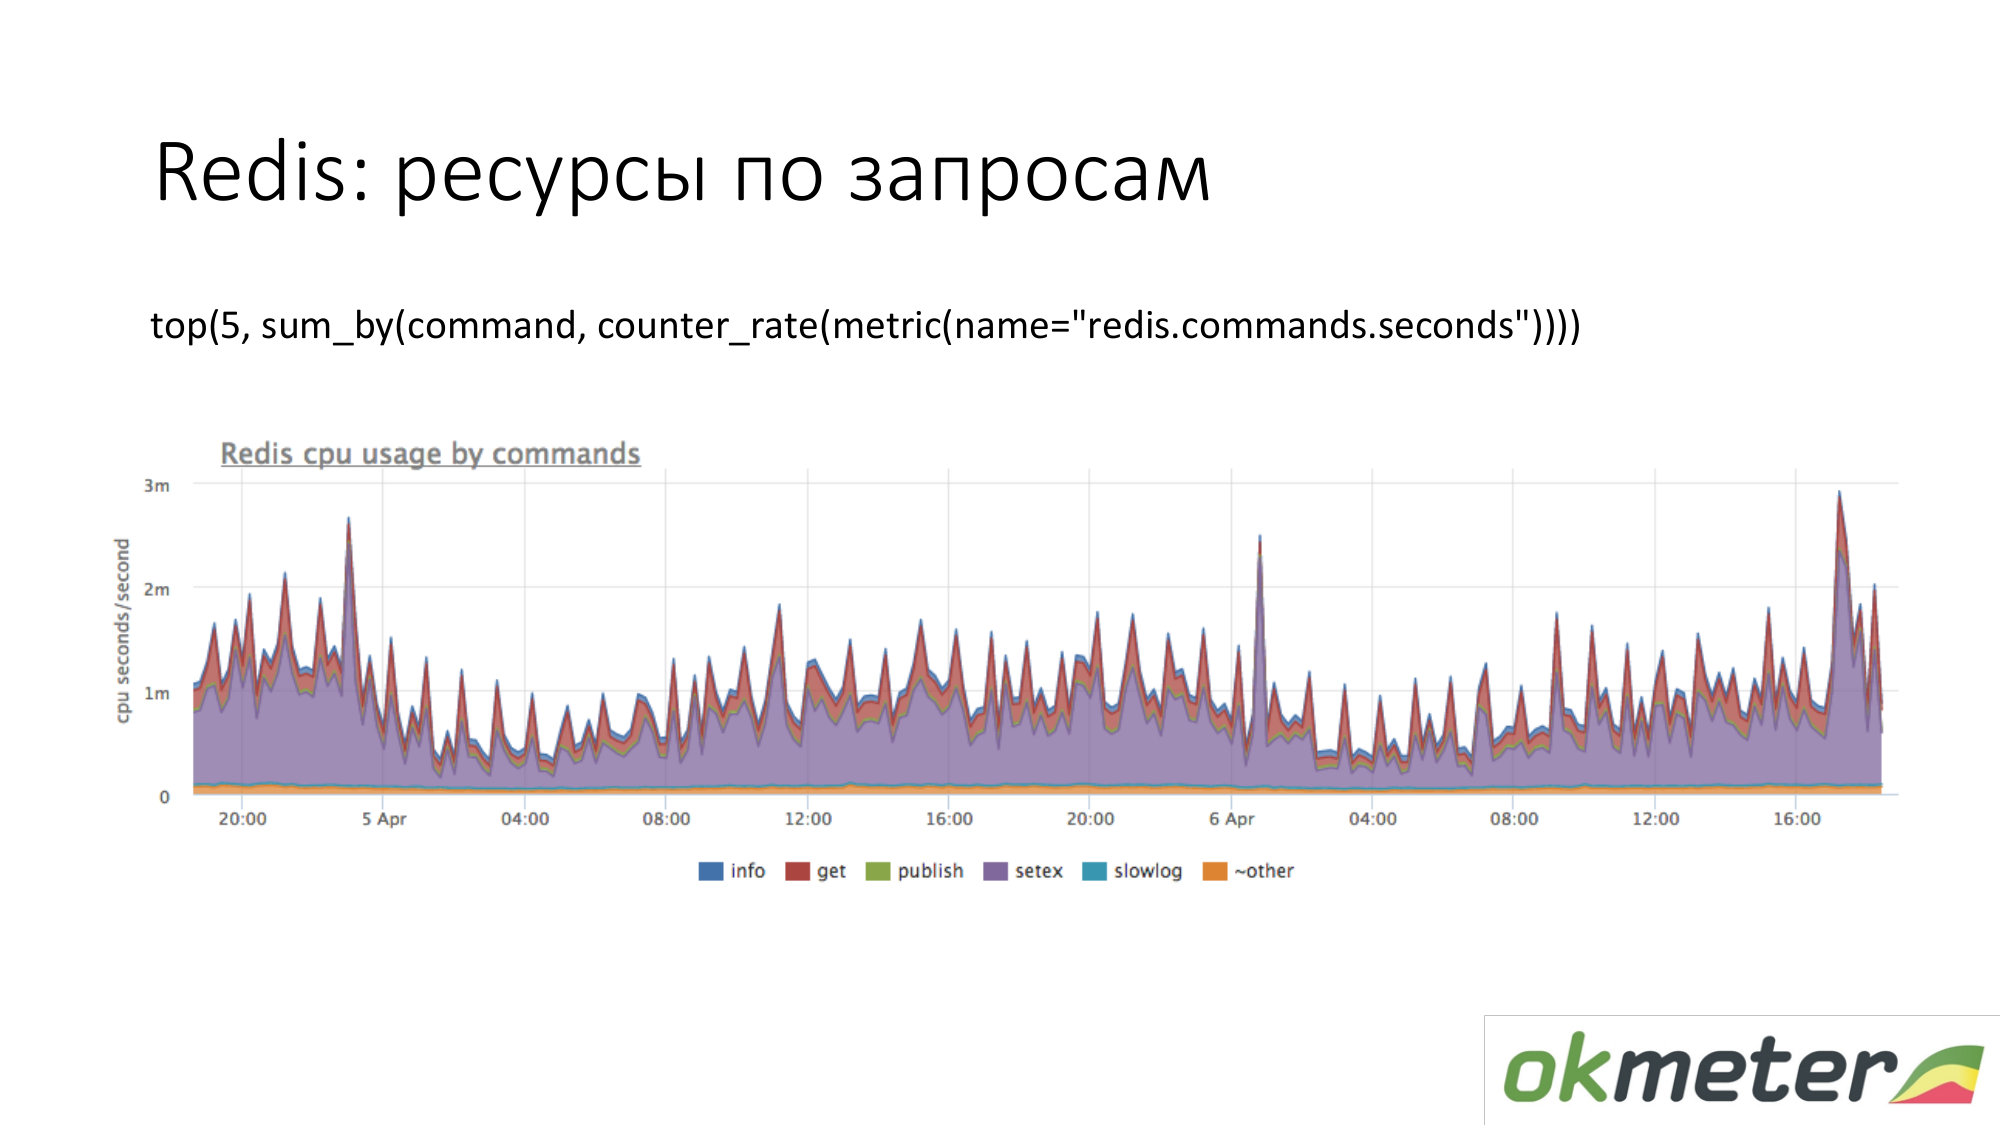
This is Redis. We see that purple uses a lot of CPU. Violet is a setex. Setex - key record with TTL setting. If this is important to us, let's go deal with it. If this is not important for us, we just know where all the resources go.
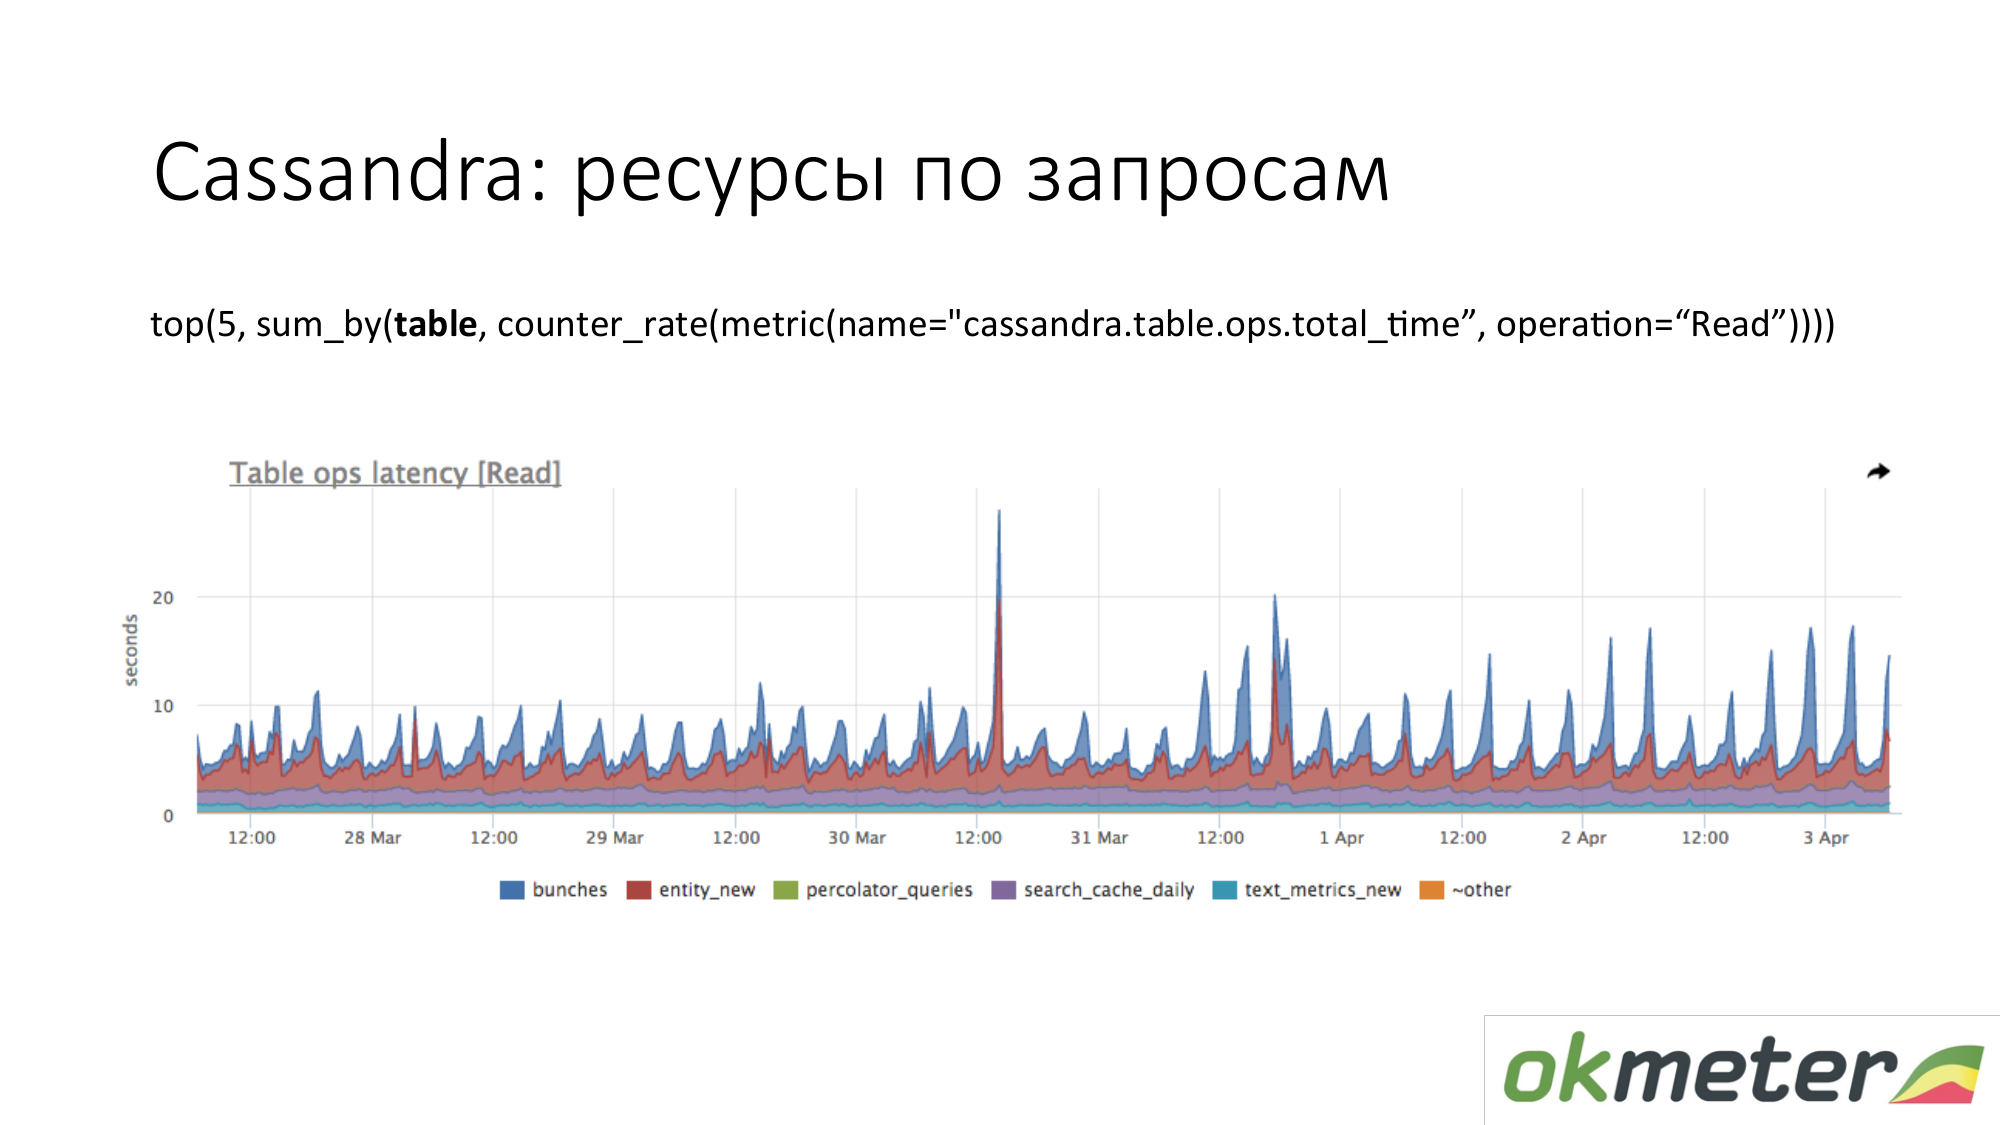
Cassandra. We see the top 5 tables for read requests by the total response time. We see this surge. These are queries to a table, and we roughly understand that a query to this table makes one piece of code. Cassandra is not a SQL database into which we can make different queries on tables. Cassandra is becoming increasingly wretched.

A few words about workflow work with incidents. As i see it.
About alert. Our view of incident workflow is different from what is generally accepted.
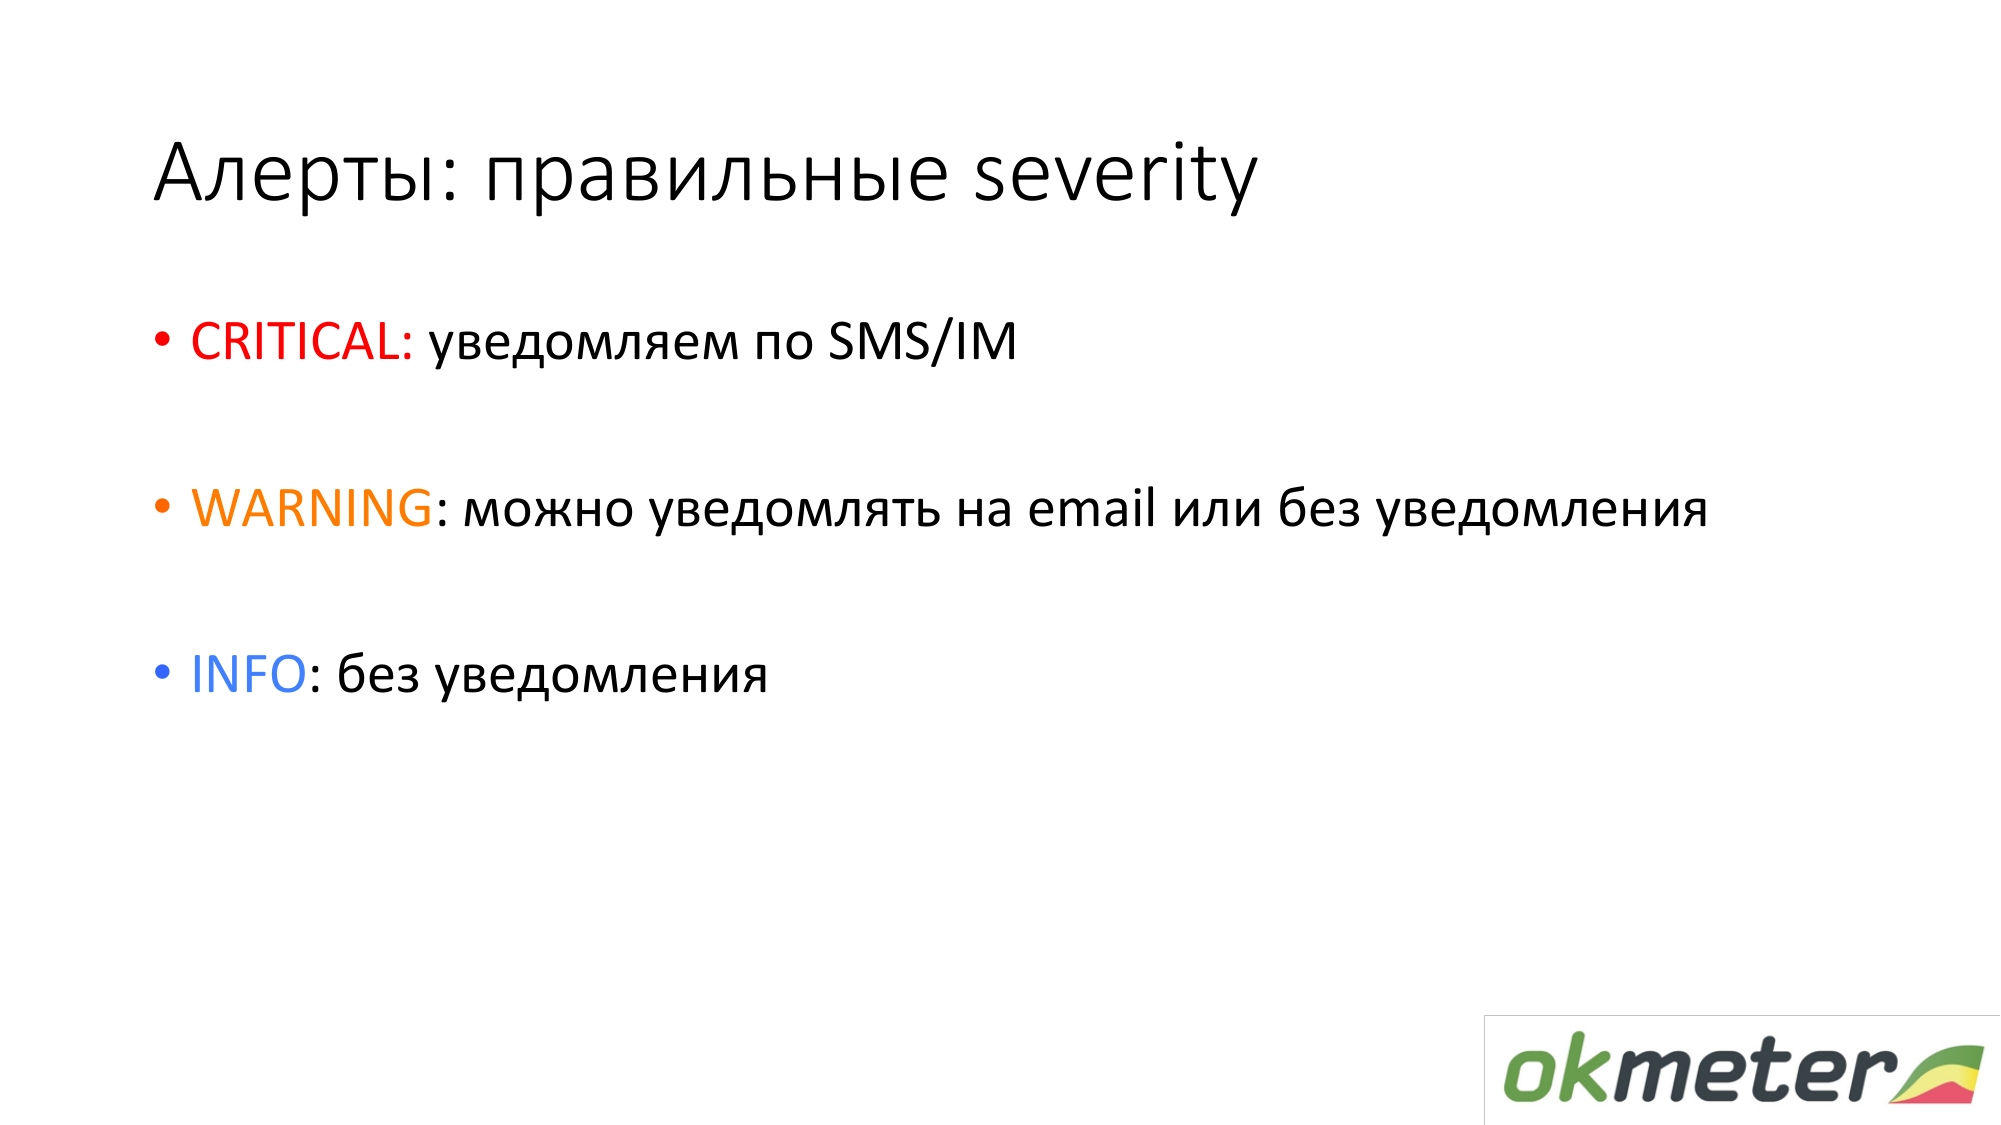
Severy Critical. We notify you via SMS and all real-time communication channels.
Severy Info is a light bulb that can help you with something when working with incidents. Info is not notified anywhere. Info just hangs and tells you that something is happening.
Severy Warning is something that can be notified, maybe not.

Critical examples.
The site does not work at all. For example, 5xx 100% or the response time has increased and users began to leave.
Business logic errors. What is critical. It is necessary to measure money per second. Money per second is a good source of data for Critical. For example, the number of orders, promotion of ads and others.
Workflow with Critical such that this incident cannot be postponed. You cannot click OK and go home. If Critical came to you and you are taking the subway, then you must get out of the subway, go outside, take a bench and start repairing. Otherwise, it is not critical. From these considerations, we construct the remaining severity as a residual.
Warning. Warning examples.
- Disk space runs out.
- The internal service works for a long time, but at the same time, if you do not have Critical, then it means that you are conditional anyway.
- Many errors on the network interface.
- The most controversial is the server is not available. In fact, if you have more than one server and the server is unavailable, this is Warning. If you do not have 1 backend out of 100, then it’s stupid to wake up from SMS and you will get nervous admins.
All other Severy are designed to help you deal with Critical.
Warning. We advocate this approach to working with Warning. Preferably Warning close during the day. Most of our customers have disabled Warning notification. Thus, they do not have the so-called monitoring blindness. This means folding letters in the mail without reading a separate directory. Customers have disabled the warning alert.
(As I understand it, pure monitoring is unnecessary alerts and triggers added to exceptions - note by the author of the post)
If you use the pure monitoring technique, if you have 5 new Warning, then you can repair them in a quiet mode. They didn’t have time to fix it today, but they postponed it until tomorrow, if not critically. If Warning light up and cancel themselves, then this should be twisted in monitoring so again not to bother you. Then you will be more tolerant of them and, accordingly, life will improve.

Examples of info. It is debatable that the high CPU utilization of many Critical. In fact, if nothing affects, then you can ignore this notification.
Warning (maybe I see Info - a note by the author of the post) these are the lights that light when you come to repair the Critical. You see two Warning signs side by side (maybe there is a Info link - note by the author of the post). They can help you in solving the incident with Critical. Why it is not clear about the high CPU usage separately in SMS or in a letter.
Pointless Info is also bad. If you configure them as an exception, then you will love Info too much.
General principles for alert design. Alert should show the reason. It's perfect. But this is difficult to achieve. Here we are working fulltime on the task and it turns out with some part of success.
Everyone is talking about the need for addiction, auto-magic. In fact, if you do not receive notifications for something that you are not interested in, then there will not be too much. In my practice, statistics show that a person will look at the moment of a critical incident with their eyes about a hundred bulbs diagonally. He will find the right one there and will not think that dependency has hidden any bulbs that would help me now. In practice, this works. All you need to do is to clean up unnecessary alerts.

(Here the video skipped - note by the author of the post)

It would be nice to classify these downtime so that you can work with them later. For example, draw organizational conclusions. You need to understand why you were lying. We propose to classify / divide into such classes:
- man made
- hoster set up
- came bots
If you classify them, then everyone will be happy.
SMS has arrived. What are we doing? First we run to repair everything. So far, nothing is important to us, except for the downtime to end. Because we are motivated to lie less. Then, when the incident closed, it should be closed to the monitoring system. We believe that the incident should be checked by monitoring. If your monitoring is not configured, it is enough to make sure that the problem is over. This must be twisted. After the incident is closed, it is not actually closed. He waits while you get to the bottom of the reason. Any leader in the first place really needs to ensure that the problems do not recur. That the problems did not recur, you need to get to the bottom of the reason. After we got to the bottom of the reason, we have data to classify them. We analyze the reasons. Then, as we get to the bottom of the reason, we need to do in the future so that the incident does not recur:
- it takes two people a quarter to write such and such logic into the backend.
- need to put more replicas.
It is necessary to make sure that exactly the same incident does not happen. When you work in such a workflow through N iterations, happiness awaits you, good uptime.
Why did we classify them? We can take the statistics for the quarter and understand what downtime gave you the most. Then work in this direction. You can work on all fronts will not be very effective, especially if you have few resources there.

We counted there, we lay for so long, for example 90% because of the hoster. We charge we change this hoster. If people mess with us, we send them to courses. In fact, the most effective way to defeat man-get on is automation. The machine messes up less often. If the releases are of poor quality, then we reprimand the development teams. When you know the reason, it’s easier for you to look for solutions.
Conclusions captain. We decompose monitoring into two tasks:
- detecting problems.
- search for a reason.
If you are not satisfied with the time you are looking for a reason, then adjust the accuracy of monitoring. If the accuracy doesn’t suit you with detection, you can also twist there and configure monitoring.

Question: we are adding a new service, a new server. Usually how we do it: plugged in, added templates, then the creative process begins. We remove False Positive (false positives), try to remove what we do not check. Can you say a few words about this approach?
Answer: We remove all metrics from the server. When you added the 10th frontend server, then all metrics will be removed from it. If there are timings in the nginx logs on the neighboring 9 frontends, but there are no timings on the 10th, then we will light a warning alert without notification. You add timings during the day and you get all the metrics. If you are doing a new service, then we take off all the metrics. This approach works very well so as not to forget to add metrics. You cannot instruct everything in advance.
Question: I meant about thresholds and notifications. For example, we have a server with a database there, on it load avarage 4 is normal, its web server load avarage 20 is normal.
Answer: The answer to your question does not need to be notified to load avarage. In an average project for several 100 cars, as a rule, the threshold is the same for everyone. Naturally, CPU usage monitoring on Hadoop servers is always disabled. And the threshold of disk space at the bases needs to be done a little less. As a rule, this generally works for everyone. All other triggers are the same. When we automatically make triggers, which are rolled out by default to all users, we make them approximately common. In any project, PostgreSQL works poorly and autovacuum is poorly configured if worker autovacuum works for two hours or more. This means that he will never do his job for 99 percent of cases. Warning typically show comprehensive information. A Critical client customizes for his project. For my Critical project, this is 10 5xx per second, but less is not Critical.
Question: At what point and how is the threshold determined? Who is doing this?
Answer: You come to us and say: we want to ask some Critical of our project. If you put 10 5xx per second now, then how many notifications you would receive a week ago.
Question: What is the burden of all this good monitoring?
Answer: On average, it is generally invisible. But if you parse 50,000 RPS it will be from 1% to 10% of one CPU. Since we are only monitoring, we optimized our agent. We measure agent performance. If you do not have the resources to monitor on the server, then you are doing something wrong. There should always be resources to monitor. If you do not, then you will be as blind to the touch to administer your project.