
Flying Cart, Afu Chan
I work at Mail.ru Cloud Solutons as an architect and developer, including my cloud. It is known that a distributed cloud infrastructure needs a productive block storage, on which the operation of PaaS services and solutions built using them depend.
Initially, when deploying such an infrastructure, we used only Ceph, but gradually, block storage evolved. We wanted our databases , file storage and various services to work at maximum performance, so we added localized storages and set up advanced Ceph monitoring.
I’ll tell you how it was - perhaps this story, the problems we encountered, and our solutions will be useful to those who also use Ceph. By the way, here is a video version of this report.
From DevOps Processes to Your Own Cloud
DevOps practices are aimed at rolling out the product as quickly as possible:
- Automation of processes - the entire life cycle: assembly, testing, delivery to the test and productive. Automate processes gradually, starting with small steps.
- Infrastructure as a code is a model when the infrastructure configuration process is similar to the software programming process. First they test the product, the product has certain requirements for the infrastructure, and the infrastructure needs to be tested. At this stage, wishes for her appear, I want to “tweak” the infrastructure - first in the test environment, then in the grocery. At the first stage, this can be done manually, but then they move on to automation - to the “infrastructure as code” model.
- Virtualization and containers - appear in the company when it is clear that you need to put processes on an industrial track, roll out new features faster with minimal manual intervention.
 The architecture of all virtual environments is similar: guest machines with containers, applications, public and private networks, storage.
Gradually, more and more services are being deployed in the virtual infrastructure built in and around DevOps processes, and the virtual environment is becoming not only a test (used for development and testing), but also productive.
As a rule, at the initial stages they are bypassed by the simplest basic automation tools. But as new tools are attracted, sooner or later there is a need to deploy a full-fledged cloud platform in order to use the most advanced tools like Terraform.
At this stage, the virtual infrastructure from “hypervisors, networks and storage” turns into a full-fledged cloud infrastructure with developed tools and components for orchestrating processes. Then their own cloud appears, in which the processes of testing and automated delivery of updates to existing services and the deployment of new services take place.
The second way to your own cloud is the need to not depend on external resources and external service providers, that is, providing some technical independence for your own services.
 The first cloud looks almost like a virtual infrastructure - a hypervisor (one or several), virtual machines with containers, shared storage: if you build the cloud not on proprietary solutions, it is usually Ceph or DRBD.
Private Cloud Resiliency and Performance
The cloud is growing, the business depends on it more and more, the company begins to demand greater reliability.
Here, distributedness is added to the private cloud, distributed cloud infrastructure appears: additional points where the equipment is located. The cloud manages two, three or more installations built to provide a fault-tolerant solution.
At the same time, data is needed from all sites, and there is a problem: within one site there are no large delays in data transfer, but between sites the data is transmitted more slowly.
 Installation sites and common storage. Red rectangles are bottlenecks at the network level.
The external part of the infrastructure from the point of view of the management network or the public network is not so busy, but on the internal network the transferred data volumes are much larger. And in distributed systems, problems begin, expressed in a long service time. If the client comes to one group of storage nodes, the data must be instantly replicated to the second group so that the changes are not lost.
For a number of processes, data replication latency is acceptable, but in cases such as transaction processing, transactions cannot be lost. If asynchronous replication is used, a time lag occurs that can lead to the loss of part of the data if one of the “tails” of the storage system (data storage system) fails. If synchronous replication is used, service time increases.
It is also quite natural that when the latency of the operations on the storages increases, the databases begin to slow down and there are negative effects that have to be dealt with.
In our cloud, we seek balanced solutions to maintain reliability and performance. The simplest technique is to localize the data - and then we added additional localized Ceph clusters.
 Green color indicates additional localized Ceph clusters.
The advantage of such a complex architecture is that those who need fast data input / output can use localized storages. Data for which full availability is critical within two sites lies in a distributed cluster. It works slower - but the data in it is replicated to both sites. If its performance is not enough, you can use localized Ceph clusters.
Most public and private clouds eventually come to approximately the same pattern of work, when, depending on requirements, the load is deployed in different types of storage (different types of disks).
Ceph diagnostics: how to build monitoring
When we deployed and launched the infrastructure, it was time to ensure its functioning, to minimize the time and number of failures. Therefore, the next step in the development of infrastructure was the construction of diagnostics and monitoring.
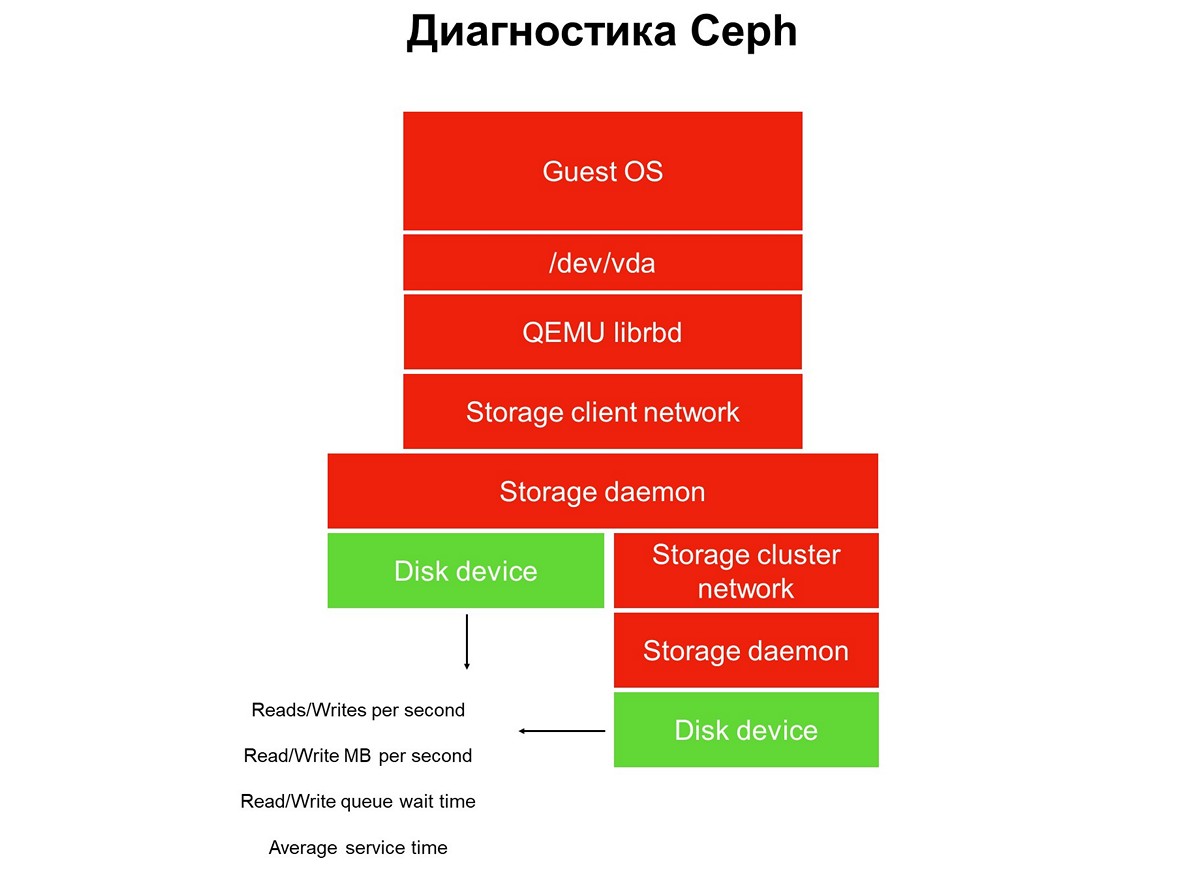
Consider the monitoring task throughout - we have a stack of applications in a virtual cloud environment: an application, a guest operating system, a block device, the drivers of this block device on a hypervisor, a storage network, and the actual storage system (storage system). And all this has not yet been covered by monitoring.
 Elements not covered by monitoring.
Monitoring is implemented in several stages, we begin with disks. We get the number of read / write operations, to some accuracy, the service time (megabytes per second), queue depth, other characteristics, and we also collect SMART about the state of the disks.
 The first stage: we cover monitoring disks.
Disk monitoring is not enough to get a complete picture of what is going on in the system. Therefore, we move on to monitoring a critical element of the infrastructure - the network of the storage system. There are actually two of them - the internal cluster and client, which connects storage clusters with hypervisors. Here we get the data packet transfer rates (megabytes per second, packets per second), the size of network queues, buffers, and possibly data paths.
 Second stage: network monitoring.
They often stop at this, but this cannot be done, because most of the infrastructure has not yet been closed by monitoring.
All distributed storage used in public and private clouds is SDS, software-defined storage. They can be implemented on the solutions of a particular vendor, open source solutions, you can do something yourself using a stack of familiar technologies. But it is always SDS, and the work of these software parts must be monitored.
 Stage Three: Monitoring Storage daemon.
Most Ceph operators use data collected from Ceph monitoring and control daemons (monitor and manager, aka mgr). Initially, we went the same way, but very quickly realized that this information was not enough - warnings about hanging requests appear late: the request hung for 30 seconds, only then we saw it. As long as it comes to monitoring, while monitoring raises the alarm, at least three minutes will pass. In the best case, this means that part of the storage and applications will be idle for three minutes.
Naturally, we decided to expand the monitoring and went down to the main element of Ceph - the OSD daemon. From monitoring Object Storage daemon, we get the approximate operation time as the OSD sees it, as well as statistics on hung requests - who, when, in what PG, for how long.
Why only Ceph is not enough and what to do about it
Ceph alone is not enough for a number of reasons. For example, we have a client with a database profile. He deployed all the databases in an all-flash cluster, the latency that was issued there was fine with him, however, there were complaints about downtime.
The monitoring system does not allow you to see what is happening inside the virtual environment clients. As a result, to identify the problem, we used the advanced analysis, which was requested using the blktrace utility from his virtual machine.
 The result of an extended analysis.
The analysis results contain operations marked with the flags W and WS. The W flag is a record, the WS flag is a synchronous record, waiting for the device to complete the operation. When we work with databases, almost all SQL databases have a bottleneck - WAL (write-ahead log).
The database always first writes data to the log, receives confirmation from the disk with flushing buffers, then it writes the data to the database itself. If she has not received confirmation of a buffer reset, she believes that a power reset can erase a transaction confirmed by the client. This is unacceptable for the database, so it displays “write SYNC / FLUSH”, then writes the data. When the logs are full, their switch occurs, and everything that got into the page cache is also forcibly flashed. Added: there is no reset in the picture itself - that is, operations with the pre-flush flag. They look like FWS - pre-flush + write + sync or FWSF - pre-flush + write + sync + FUA
When a client has many small transactions, virtually all of its I / O turns into a sequential chain: write - flush - write - flush. Since you cannot do something with the database, we begin to work with the storage system. At this moment, we understand that the capabilities of Ceph are not enough.
For us, at this stage, the best solution was to add small and fast local storages that were not implemented using Ceph (we basically exhausted its capabilities). And we are turning cloud storage into something more than Ceph. In our case, we have added many local stories (local in terms of the data center, not the hypervisor).
 Additional localized repositories Target A and B.
The service time of such local storage is about 0.3 ms per stream. If it lies in another data center, it works more slowly - with a performance of approximately 0.7 ms. This is a significant increase compared to Ceph, which produces 1.2 ms, and distributed over data centers - 2 ms. The performance of such small factories, of which we have more than a dozen, is about 100 thousand per module, 100 thousand IOPS per record.
After such a change in infrastructure, our cloud squeezes out a million IOPS for writing, or about two to three million IOPS for reading in total for all clients:

It is important to note that this type of storage is not the main method of expansion, we place the main bet on Ceph, and the presence of fast storage is important only for services that require disk response time.
New iterations: code and infrastructure improvements
All our stories are shared resources. Such an infrastructure requires us to implement a service level policy : we must provide a certain level of service and not allow one client to interfere with another by accident or on purpose, by disabling storage.
To do this, we had to do the finalization and non-trivial roll-out - iterative delivery to the productive.
This roll-out was different from the usual DevOps practices, when all the processes: assembly, test, code roll-out, restart service, if necessary, begin with the click of a button, and then everything works. If you roll out DevOps practices to the infrastructure, it lives on until the first error.
That is why “full automation” did not particularly take root in the infrastructure team. Of course, there is a certain approach to testing and delivery automation - but it is always controlled and delivery is initiated by the SRE engineers of the cloud team.
We rolled out changes in several services: in the Cinder backend, Cinder frontend (Cinder client) and in the Nova service. Changes were applied in several iterations - one iteration at a time. After the third iteration, the appropriate changes were applied to the clients' guest machines: someone migrated, someone himself restarted the VM (hard reboot) or planned migration to serve the hypervisors.
The next problem that arose was a jump in write speed . When we work with network attached storage, the default hypervisor considers the network to be slow, and therefore caches all data. He writes quickly, up to several tens of megabytes, and then begins to flush the cache. There were many unpleasant moments because of such jumps.
We found that if you enable the cache, the performance of the SSD sags by 15%, and if you turn off the cache, the performance of the HDD sags by 35%. It took another development, rolled out managed cache management, when caching is explicitly assigned for each type of disk. This allowed us to drive SSDs without a cache, and HDDs with a cache, as a result, we stopped losing performance.
The practice of delivering development to a product is similar - iterations. We rolled out the code, restarted the daemon, and then, as necessary, restart or migrate guest virtual machines, which should be subject to change. The client VM migrated from the HDD, its cache turned on - everything works, or, on the contrary, the client migrated with SSD, its cache turned off - everything works.
The third problem is the incorrect operation of virtual machines deployed from GOLD images to the HDD .
There are many such clients, and the peculiarity of the situation is that the work of the VM was adjusted by itself: the problem was guaranteed to occur during deployment, but it was solved while the client reached technical support. At first, we asked customers to wait half an hour until the VM is stabilized, but then we started working on the quality of the service.
In the process of research, we realized that the capabilities of our monitoring infrastructure are still not enough.
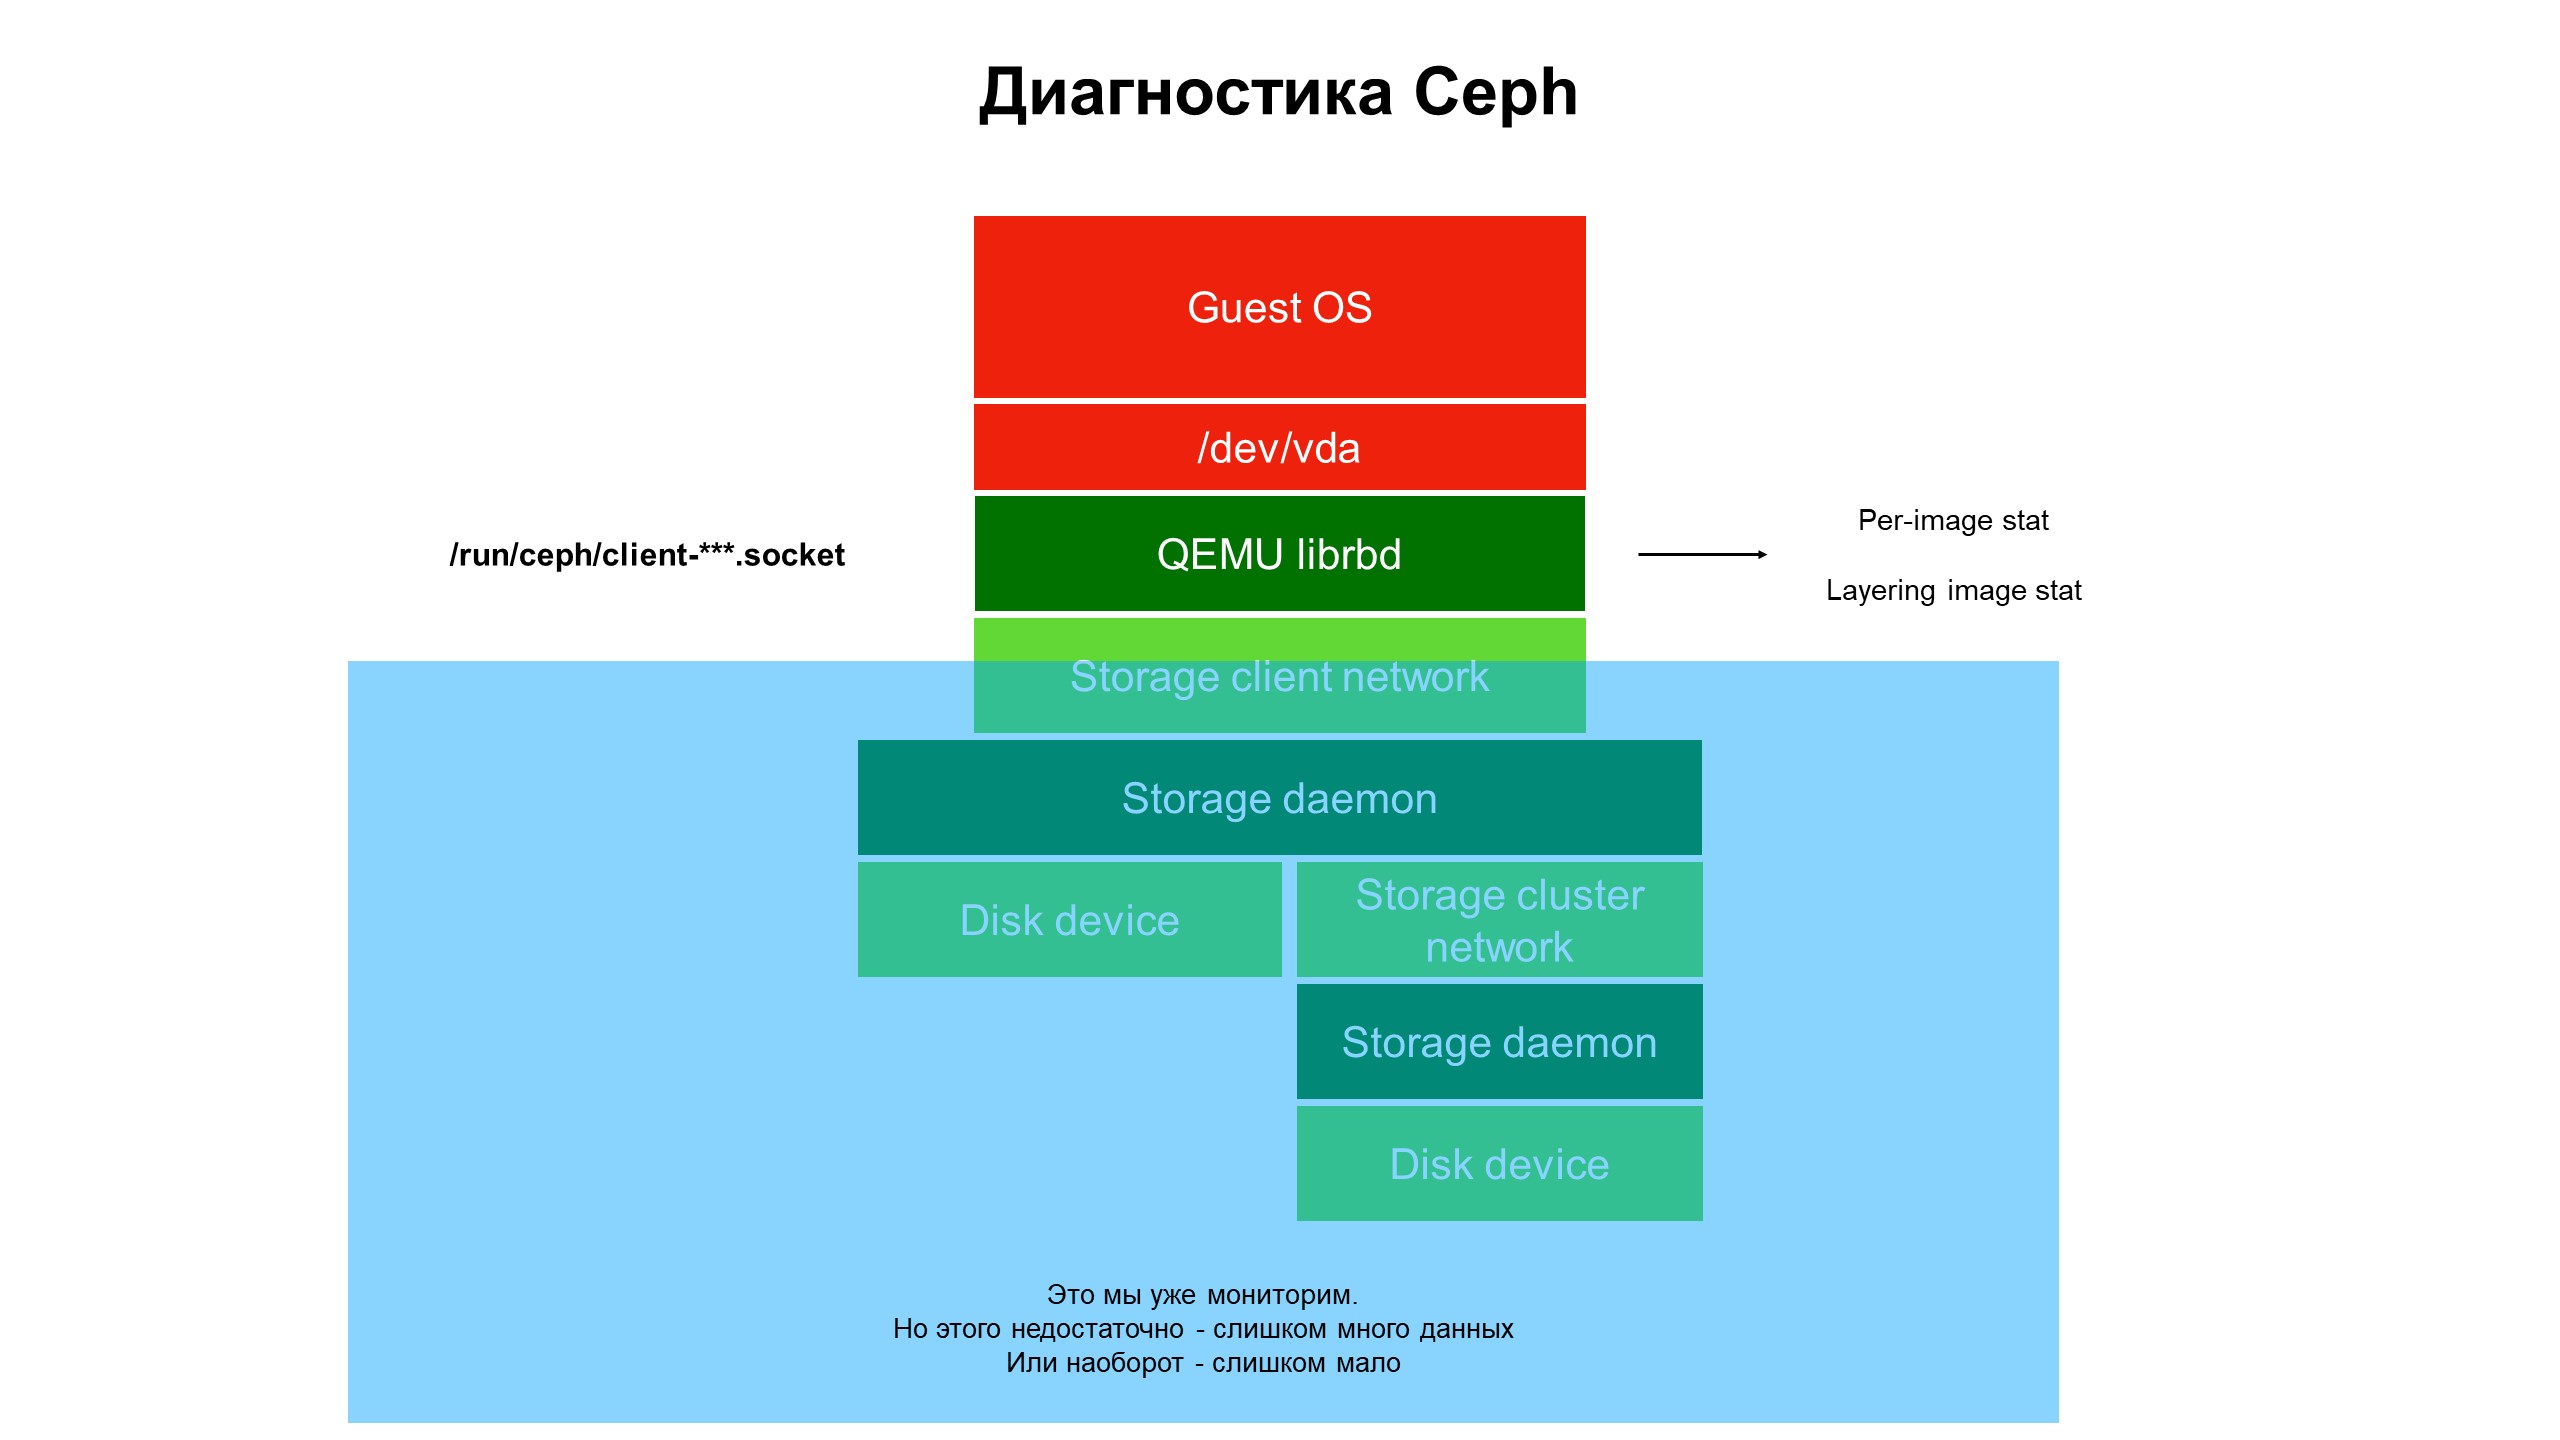 Monitoring closed the blue part, and the problem was at the top of the infrastructure, not covered by monitoring.
We began to understand what is happening in the part of the infrastructure that was not covered by monitoring. To do this, we used the advanced Ceph diagnostics (or rather, one of the varieties of the Ceph client - librbd). Using automation tools, they made changes to the Ceph client configuration to access internal data structures through the Unix domain socket, and began to take statistics from Ceph clients on the hypervisor.
What did we see? We did not see statistics on the Ceph cluster / OSD / cluster, but statistics on each disk of the client virtual machine whose disks were in Ceph — that is, statistics associated with the device.
 Advanced monitoring statistics results.
It was the extended statistics that made it clear that the problem only occurs on disks cloned from other disks.
Next, we looked at statistics on operations, in particular read-write operations. It turned out that the load on the upper level images is relatively small, and on the initial ones, from which the clone comes, it is large, but nonequilibrium: a large amount of reading with no recording at all.
The problem is localized, now a solution is needed - code or infrastructure?
Nothing can be done with the Ceph code, it is “hard”. In addition, the safety of customer data depends on it. But there is a problem, it must be solved, and we changed the architecture of the repository. The HDD cluster turned into a hybrid cluster - a certain amount of SSD was added to the HDD, then the priorities of the OSD daemons were changed so that the SSD was always in priority and became the primary OSD inside the placement group (PG).
Now, when the client deploys the virtual machine from the cloned disk, its read operations go to the SSD. As a result, the recovery from the disk became fast, and only client data other than the original image is written to the HDD. We received a threefold increase in productivity almost free of charge (relative to the initial cost of infrastructure).
Why infrastructure monitoring is important
- The monitoring infrastructure must be included to the maximum in the entire stack, starting with the virtual machine and ending with the disk. Indeed, while a client using a private or public cloud gets to their infrastructure and provides the necessary information, the problem will change or move to another place.
- Monitoring the entire hypervisor, virtual machine, or container “in its entirety” yields almost nothing. We tried to understand from network traffic what is happening with Ceph - it is useless, data flies at high speed (from 500 megabytes per second), it is extremely difficult to select the necessary ones. It will take a monstrous volume of disks to store such statistics and a lot of time to analyze it.
- It is necessary to collect as much monitoring data as possible, otherwise there is a risk of missing something important. And the flip side: if you collected a lot of data, but then you can’t analyze it and find what you need among them, this makes the accumulated statistics useless, the collected data will simply waste your disk space aimlessly.
- The purpose of monitoring is not only the determination of infrastructure failure. Failure you will see when it happens. The main goal is to predict failure and see trends, collect statistics to improve the quality of service. To do this, we need well-organized data flows in monitoring, tied to the infrastructure. Ideally, from a specific disk of a virtual machine to the lowest level - to those storage disks where the data accessed by the client virtual machine is located.
- Cloud MCS Cloud Solutions is an infrastructure whose evolution decisions are made largely on the basis of data accumulated by monitoring. We improve monitoring and use its data to improve the level of service for customers.