This story is especially impressive. In fact, how often do you have one thread spin for a few seconds in a cycle of seven teams, holding a lock that stops the work of 63 other processors? It's just amazing, in some terrible sense.
Contrary to popular belief, I actually do not have a machine with 64 logical processors, and I have never seen this particular problem. But my friend ran into it,
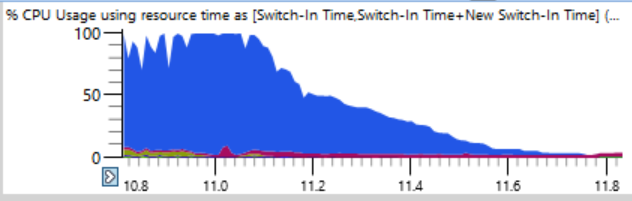
The friend’s complaint was quite simple: he collected the build using ninja . Typically, ninja does a great job of increasing load, constantly supporting n + 2 processes to avoid downtime. But here, the CPU usage in the first 17 seconds of the assembly looked like this:

If you take a closer look (a joke), you can see a thin line where the total CPU load drops from 100% to 0% in a couple of seconds. In just half a second, the load drops from 64 to two or three threads. Here is an enlarged fragment of one of these falls - seconds are marked along the horizontal axis:
The first thought was that ninja cannot create processes fast enough. I have seen this many times, usually due to the intervention of antivirus software. But when I sorted the charts by the end time, I found that during such crashes no processes were completed, so ninja is not to blame.
The CPU Usage (Precise) table is ideal for identifying the cause of downtime. The logs of all context switches are stored there, including accurate records of each start of the stream, including the place and timeout.
The trick is that there is nothing wrong with downtime. The problem arises when we really want the thread to do the work, but instead it is idle. Therefore, you need to select certain moments of downtime.
When analyzing, it is important to understand that context switching occurs when a thread resumes operation. If we look at those places when the processor load starts to fall, we will not find anything. Instead, focus on when the system started working again. This trace phase is even more dramatic. While the CPU load drop takes half a second, the reverse process from one used thread to a full load takes only twelve milliseconds! The graph below is quite heavily enlarged, and yet the transition from idle to load is an almost vertical line:

I zoomed in to twelve milliseconds and found 500 context switches, a careful analysis is required here.
The context switch table has many columns that I have documented here . When a process freezes, in order to find the reason, I do a grouping by new processes, new threads, new thread stacks, etc. ( discussed here ), but this does not work on hundreds of stopped processes. If I studied any one wrong process, it is clear that it was prepared by the previous process, which was prepared by the previous one, and I would scan a long chain to find the first link that (presumably) holds an important lock for a long time.
So, I tried a different column layout in the program:
- Switch-In Time (when context switching occurred)
- Readying Process (who released the lock after waiting)
- New Process (who started working)
- Time Since Last (how long the new process has been waiting)
This gives a time-ordered list of context switches with a note of who prepared whom and how long the processes were ready to work.
It turned out that this is enough. The table below speaks for itself if you know how to read it. The first few context switches are not of interest, because the wait time for a new process (Time Since Last) is quite small, but on the highlighted line (# 4) an interesting thing starts:
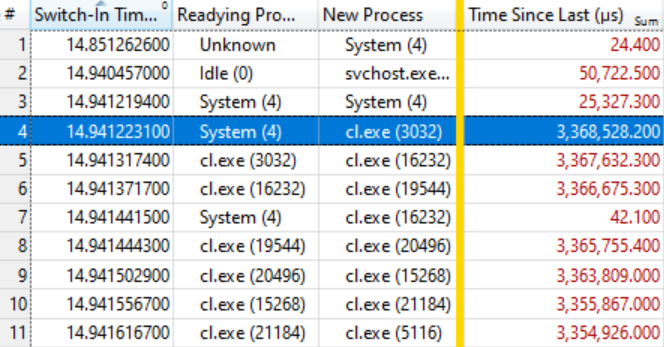
This line says that System (4) prepared cl. Exe (3032) , which waited 3.368 seconds. The next line says that in less than 0.1 ms, cl. Exe (3032) prepared cl.exe (16232) , which waited 3.367 seconds. And so on.
Several context switches, as in line # 7, are not included in the wait chain, but simply reflect other work in the system, but in general the chain is stretched to many tens of elements.
This means that all these processes are waiting for the release of the same lock. When the System (4) process releases the lock (after holding for 3,368 seconds!), The waiting processes, in turn, capture it, do their little work and pass the lock on. The waiting queue has about a hundred processes, which shows the degree of influence of a single lock.
A small study of Ready Thread Stacks showed that most of the expectations come from KernelBase.dllWriteFile . I asked WPA to display the callers of this function, with grouping. There you can see that in 12 milliseconds of this catharsis 174 threads go out of WriteFile waiting, and they waited an average of 1,184 seconds:
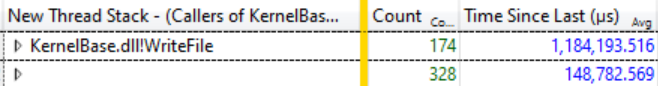
174 threads waiting for WriteFile, average wait time 1,184 seconds
This is an amazing lag, and in fact, not even the whole extent of the problem, because many threads from other functions, such as KernelBase.dll! GetQueuedCompletionStatus, expect the release of the same lock.
What System does (4)
At this point, I knew that the build progress stopped because all compiler processes and others were expecting WriteFile , since System (4) held the lock. Another Ready Thread Id column showed that thread 3276 released the lock in the system process.
During all the “hangs” of the assembly, thread 3276 was 100% loaded, so it’s clear that it did some work on the CPU while holding the lock. To find out where the CPU time is spent, let's look at the CPU Usage (Sampled) graph for stream 3276. The CPU usage data was surprisingly clear. Almost all the time it takes the work of one function ntoskrnl.exe! RtlFindNextForwardRunClear (the number of samples is indicated in the column with numbers):

Call stack leads to ntoskrnl.exe! RtlFindNextForwardRunClear
Viewing the thread stack Readying Thread Id confirmed that NtfsCheckpointVolume released the lock after 3.368 s:
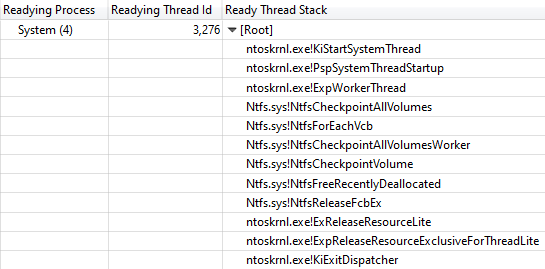
Call Stack from NtfsCheckpointVolume to ExReleaseResourceLite
At this moment, it seemed to me that it was time to use the rich knowledge of my followers on Twitter, so I posted this question and showed a full call stack. Tweets with such questions can be very effective if you provide enough information.
In this case, the right answer came very quickly from Caitlin Gadd , along with many other great suggestions. She turned off the system recovery feature - and suddenly the build went two to three times faster!
But wait, further is even better
Blocking execution throughout the system for 3+ seconds is quite impressive, but the situation is even more impressive if you add the Address column to the CPU Usage (Sampled) table and sort by it. It shows where exactly in RtlFindNextForwardRunClear samples get - and 99% of them fall on one instruction!

I took the ntoskrnl.exe and ntkrnlmp.pdb files (the same version as my friend) and ran
dumpbin /disasm
to view the function of interest in assembler. The first digits of the addresses are different because the code moves at boot, but the last four hex values are the same (they do not change after ASLR):
  RtlFindNextForwardRunClear:
 ...
 14006464F: 4C 3B C3 cmp r8, rbx
 140064652: 73 0F jae 0000000140064663
 140064654: 41 39 28 cmp dword ptr [r8], ebp
 140064657: 75 0A jne 0000000140064663
 140064659: 49 83 C0 04 add r8.4
 14006465D: 41 83 C1 20 add r9d, 20h
 140064661: EB EC jmp 000000014006464F
 ...
We see that the instruction on ... 4657 is included in a cycle of seven instructions, which are found in other samples. The number of such samples is indicated on the right:
  RtlFindNextForwardRunClear:
 ...
 14006464F: 4C 3B C3 cmp r8, rbx 4
 140064652: 73 0F jae 0000000140064663 41
 140064654: 41 39 28 cmp dword ptr [r8], ebp
 140064657: 75 0A jne 0000000140064663 7498
 140064659: 49 83 C0 04 add r8.4 2
 14006465D: 41 83 C1 20 add r9d, 20h 1
 140064661: EB EC jmp 000000014006464F 1
 ...
As an exercise for the reader, let us leave the interpretation of the number of samples on a superscalar processor with extraordinary execution of instructions, although some good ideas can be found in this article . In this case, we have a 32-core AMD Ryzen Threadripper 2990WX. Apparently, the processor function of Micro-Up Fusion with the execution of five instructions at a time actually allows each cycle to be completed on jne, since the instruction after the most expensive instruction falls into the majority of interruptions in the selection.
So it turns out that a machine with 64 logical processors stops in a cycle of seven commands in the system process, while holding a vital NTFS lock, which is fixed by disabling system recovery.
Coda
It is not clear why this code behaved badly on this particular machine. I suppose this is somehow related to the distribution of data on an almost empty 2 TB disk. When the system recovery was turned back on, the problem also returned, but not so severe. Maybe there is some kind of pathology for disks with huge fragments of empty space?
Another follower on Twitter mentioned the Volume Shadow Copy bug from Windows 7, which allows execution during O (n ^ 2) . This error was allegedly fixed in Windows 8, but it may have been preserved in some form. My stack traces clearly show that VspUpperFindNextForwardRunClearLimited (finding a used bit in this 16 megabyte area) calls VspUpperFindNextForwardRunClear (looking for the next used bit anywhere, but does not return it if it is outside the specified area). Of course, this causes a certain sense of deja vu. As I recently said , O (n ^ 2) is a weak point of poorly scalable algorithms. Two factors coincide here: such a code is fast enough to get into production, but slow enough to drop this production.
There were reports that a similar problem occurs with a massive deletion of files , but our trace does not show many deletions, so the problem, apparently, is not that.
In conclusion, I’ll duplicate the system-wide CPU load schedule from the beginning of the article, but this time indicating the CPU usage by the System problem process (green below). In such a picture, the problem is completely obvious. The system process is technically visible on the top graph, but on this scale it is easy to miss.
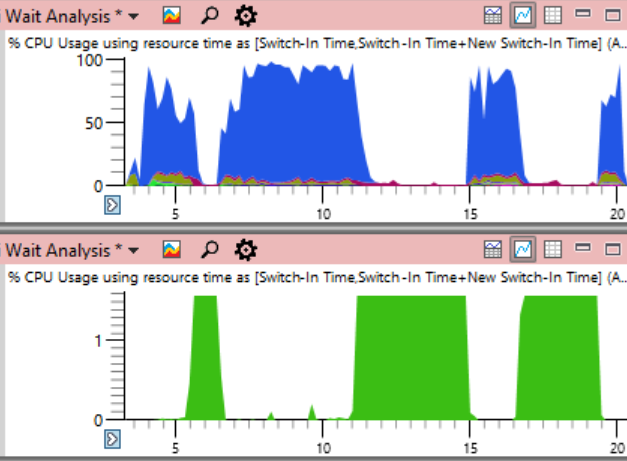
Although the problem is clearly visible on the graph, it actually proves nothing. As they say , correlation is not a causal relationship. Only an analysis of context switching events shows that it is this stream that holds the critical lock - and then you can be sure that we have found the actual cause, and not just a random correlation.
Inquiries
As usual, I conclude this investigation with a call to better name the threads . The system process has dozens of threads, many of which have a special purpose, and none have a name. The busiest system thread in this trace was MiZeroPageThread . I repeatedly plunged into its stack, and each time I recalled that it was not of interest. The VC ++ compiler does not name its threads either. It does not take much time to rename the streams, and it is really useful. Just give the name. It is simple . Chromium even includes a tool for listing stream names in a process .
If someone from the NTFS team at Microsoft wants to talk about this topic, let me know, and I can connect you with the author of the original report and provide an ETW trace.
References
- Original Twitter thread
- Twitter post announcement
- Discussion at Hacker News
- Discussion on Reddit
- Perhaps the relevant Windows / NTFS tirade